Synergies is a cognitive application service provider that combines business knowledge, artificial intelligence technology, and software development. Their mission is to help businesses through their digital transformation journey, become leaders and innovators in their industries by unlocking the power of data in the hands of business users and decision makers. Their product, JarviX, is an AnalyticOps Platform . JarviX uses NLP…
N/A
Zoho Analytics
Score 8.4 out of 10
Small Businesses (1-50 employees)
Zoho Analytics is a self-service BI and analytics platform that uncovers patterns, spots emerging trends, tracks business metrics, and detects anomalies. Designed for ease of use, it enables business users to create reports and dashboards independently, without relying on IT.
$60
per month 5 users
Pricing
JarviX
Zoho Analytics
Editions & Modules
No answers on this topic
Standard
$60
per month Starts at 5 Users
Premium
$145
per month Starts at 15 Users
Enterprise
$575
per month Starts at 50 Users
Offerings
Pricing Offerings
JarviX
Zoho Analytics
Free Trial
No
Yes
Free/Freemium Version
No
Yes
Premium Consulting/Integration Services
No
Yes
Entry-level Setup Fee
No setup fee
No setup fee
Additional Details
—
There is a 20% discount for all plans if subscribed yearly. Customers can buy add-on rows and users, in addition to the plans listed above.
More Pricing Information
Community Pulse
JarviX
Zoho Analytics
Features
JarviX
Zoho Analytics
BI Standard Reporting
Comparison of BI Standard Reporting features of Product A and Product B
JarviX
7.6
2 Ratings
7% below category average
Zoho Analytics
8.7
135 Ratings
6% above category average
Pixel Perfect reports
8.21 Ratings
8.8106 Ratings
Customizable dashboards
7.32 Ratings
8.5135 Ratings
Report Formatting Templates
7.31 Ratings
00 Ratings
Ad-hoc Reporting
Comparison of Ad-hoc Reporting features of Product A and Product B
JarviX
7.8
2 Ratings
3% below category average
Zoho Analytics
8.1
137 Ratings
1% above category average
Drill-down analysis
7.12 Ratings
8.1131 Ratings
Formatting capabilities
7.31 Ratings
7.6136 Ratings
Integration with R or other statistical packages
9.11 Ratings
00 Ratings
Report sharing and collaboration
7.72 Ratings
8.6137 Ratings
Report Output and Scheduling
Comparison of Report Output and Scheduling features of Product A and Product B
JarviX
7.8
1 Ratings
5% below category average
Zoho Analytics
8.4
129 Ratings
2% above category average
Publish to Web
9.11 Ratings
8.3108 Ratings
Publish to PDF
7.31 Ratings
8.6127 Ratings
Report Versioning
6.41 Ratings
00 Ratings
Report Delivery Scheduling
8.21 Ratings
8.5112 Ratings
Delivery to Remote Servers
8.21 Ratings
00 Ratings
Data Discovery and Visualization
Comparison of Data Discovery and Visualization features of Product A and Product B
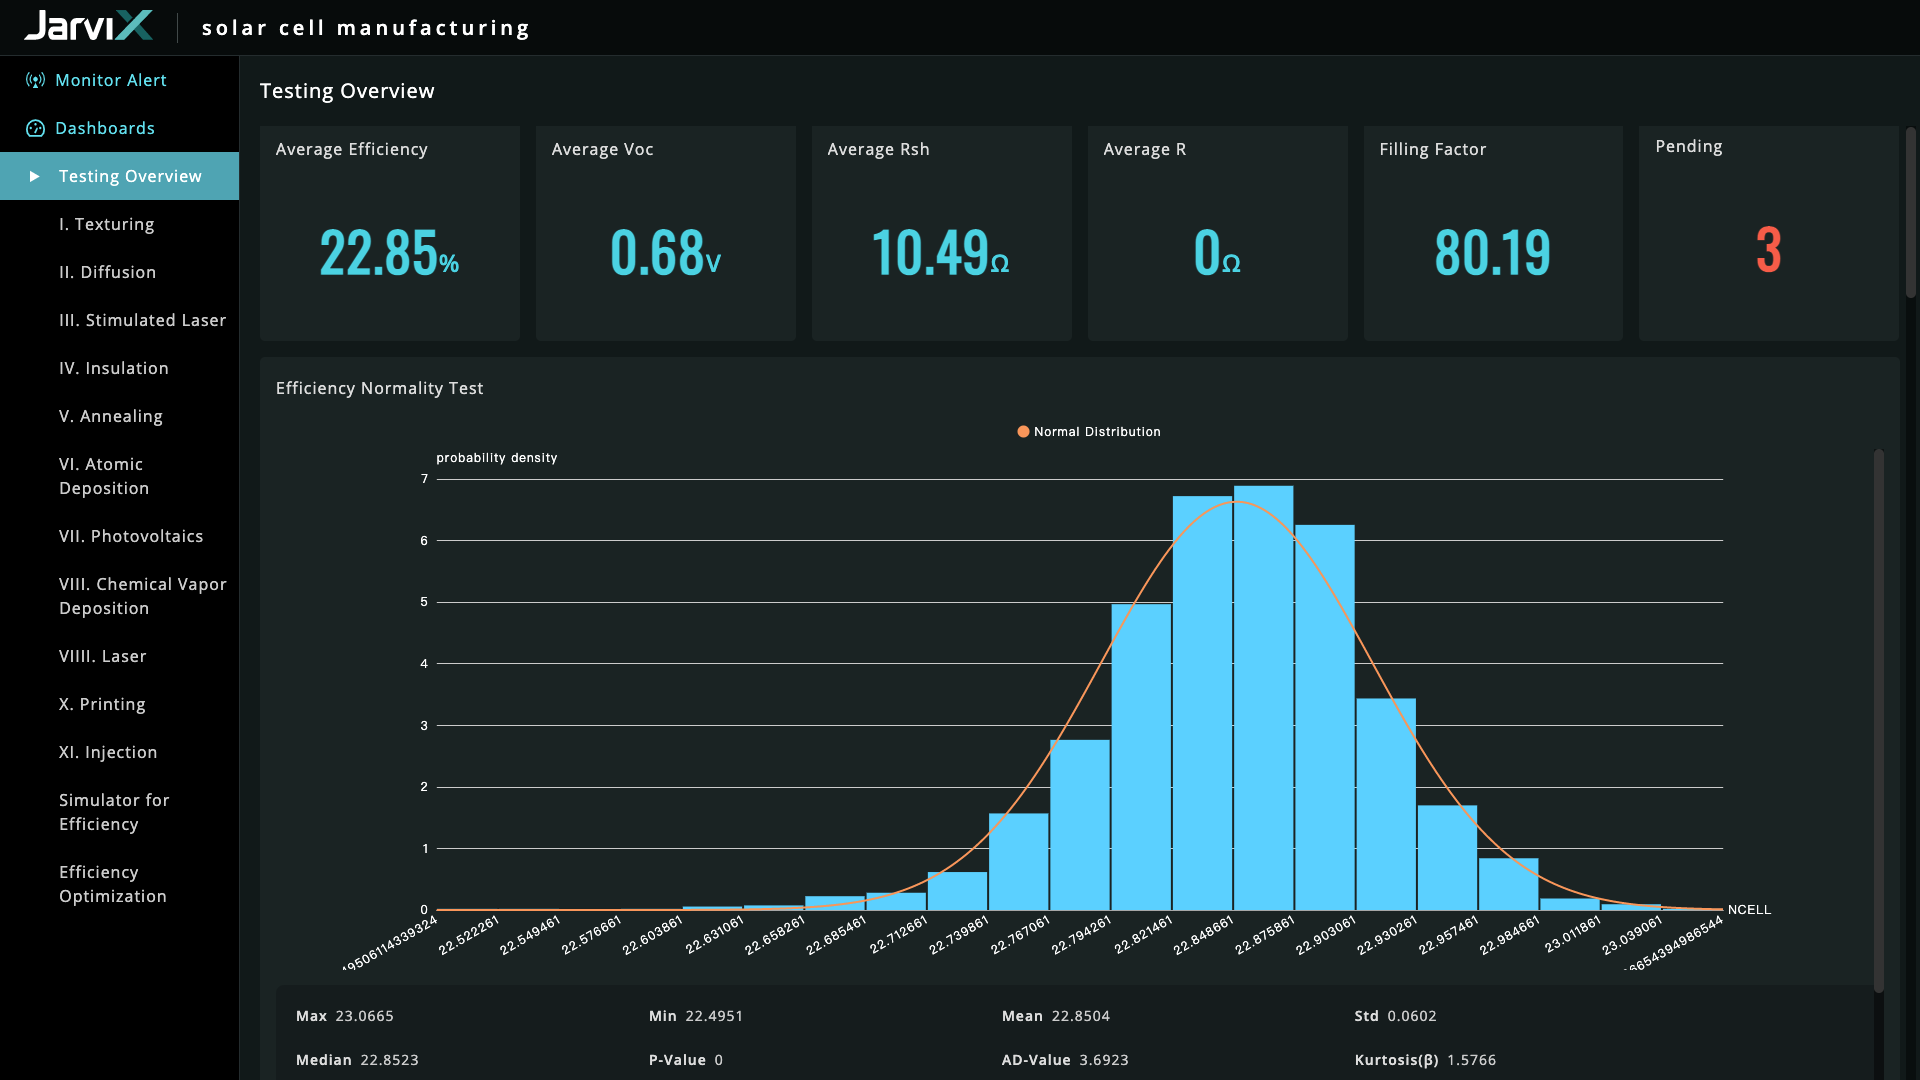
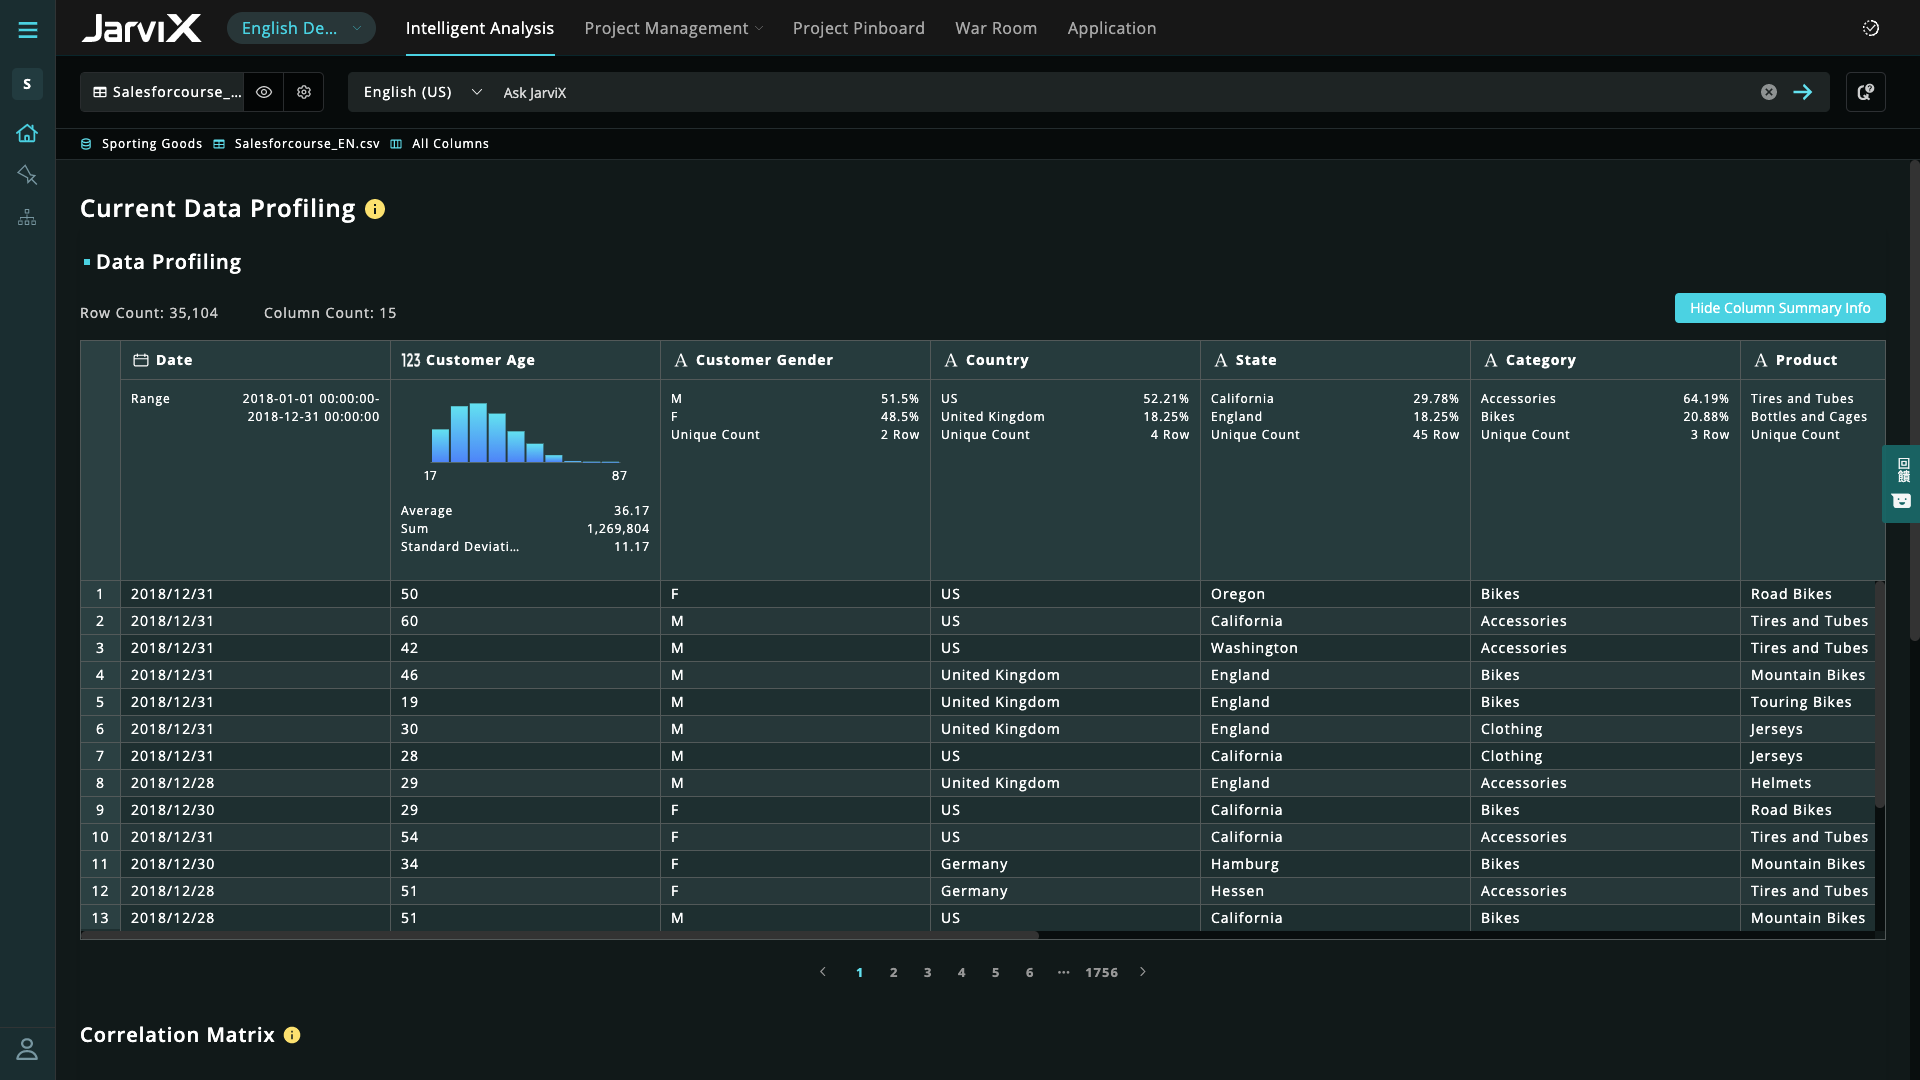
JarviX is very good at data integration, creating charts and reports for data visualization. It is really impressive that Jarvix can let our marketing team know the number of members living in a specific area in seconds. In addition, the product manager from Synergies is willing to help us with all problems we encounter. I accidentally changed one of the settings in a data table which threw the existing dashboard into chaos. However, after assistance from the product manager, we were able to successfully bring the data back to normal.
Zoho Analytics is the best way to consume data created by Zoho products . It's robust and quick build formula libraries and auto generated reports. A data source can be integrated and be ready for consumption within minutes. This gives a well developed baseline for organizing to develop advance analytics. It's mobile dashboards are very intuitive and useful for leaders who are on the move.
Zoho Analytics’ predictive analytics capabilities can help forecast future trends, allowing for proactive planning and risk management.
Performance Monitoring: We can track key performance indicators (KPIs) across departments, such as sales, marketing, finance, and HR. This aids in identifying bottlenecks and areas for improvement.
There should be more flexibility in changing the data tables uploaded into JarviX. For example, it should enable users to edit the syntax of the table or change the data format of the columns without affecting the existing dashboard and charts already created using that data table.
I'm guessing it's out there somewhere but I really could have used a 'quick start guide' or guided start.
Once I figured it out, it makes sense how to make sure the right data is provided in order to make dashboards quite flexible--- but without examples, I found it quite a challenge
The initial organization of Analytics is NOT intuitive. Once in context, the organizational features make sense, but (at least initially) it would have been most useful if the organization of Analytics reports in Zoho Analytics had saved me a lot of time.
I'd give this an 11 if I could! As our business moves forward we hope to use Zoho Analytics more then we do now. Creating better reports and dashboards for our management team to evaluate the health of our business and to provide more insightful reports for our customers. The possibilities are endless with this tool
For an end user, Zoho Analytics is pretty easy to use and very easy to access the dashboard. Linking data from multiple sources is very convenient. Multiple people can work on preparing and publishing the dashboards simultaneously, which helps delegate tasks.
ZOHO is a very reliable company/product. We never had any issues with downtime or inaccessibility to our data. Any type of maintenance that they had to perform was clearly communicated and never an issue. We use a lot of external hooks and we've never had any issues with getting ZOHO to communicate with any of those hooks.
ZOHO has obviously invested a lot of time effort and money in to creating a reliable infrastructure with high availability. We've never had any issues with performance and all of our data crunching small to large has always been well within reason. We have come to appreciate the performance of ZOHO and will continue to use it for all of our data needs.
The support team is honestly not that great. At times, it seems as if members of our own team know more about the product than the support team. They must not have a lot of training or the turnaround is quick
If your external data sources are previously organized and correlated (e.g.: in your datawarehouse or database) your implementation will be easier. Of cource some not previously predicted correlation would be necessary to be done during the implementation, but if your organization let it to be all done into Zoho Analytics, it will take more time from your team.
Tableau and Power BI. Obviously, they are not in the same category. Tableau and Power BI only provide data visualizations plus a little bit of analytics. JarviX not only provides data exploration, so you can find out what the problem is, as well as model management and App builder. If you only look for a dashboard, yes BI is probably enough, but if you constantly feel lacking actionable insights for actual implementations of improvements, JarviX is the choice for you.
Zoho Analytics has the best UI and user friendly to create reports and dashboard along with features like Zia Assistance that guide in creating reports and dashboard and also help in the forecasting of the data based on the past records.
As far as I know, Zoho Analytics has been able to fulfill every need we've had for it. Our reports have gotten better and more detailed with pretty much every new issue of our magazine. It just keeps getting better, and we keep feeding it more data to digest and present to us.
I think the best part of JarviX is that we can get the analysis results in several minutes. We spent lots of time making reports and managing our data in the past. All in all, it helps us save the time, cost, and labor of managing data.