Jirav, headquartered in San Francisco, aims to deliver smarter financials and faster insights, helping to understand where a business has been and predict where it will go. The system joins cloud-based Accounting, HR, CRM and billing data to automatically surface an interconnected model that is unique to a business. The solution helps eradicate spreadsheet errors, produce monthly reports that occur in real-time, and connected data enables teams to collaborate on multiple scenarios – bookings,…
$10,000
per year
QlikView
Score8.4 out of 10
N/A
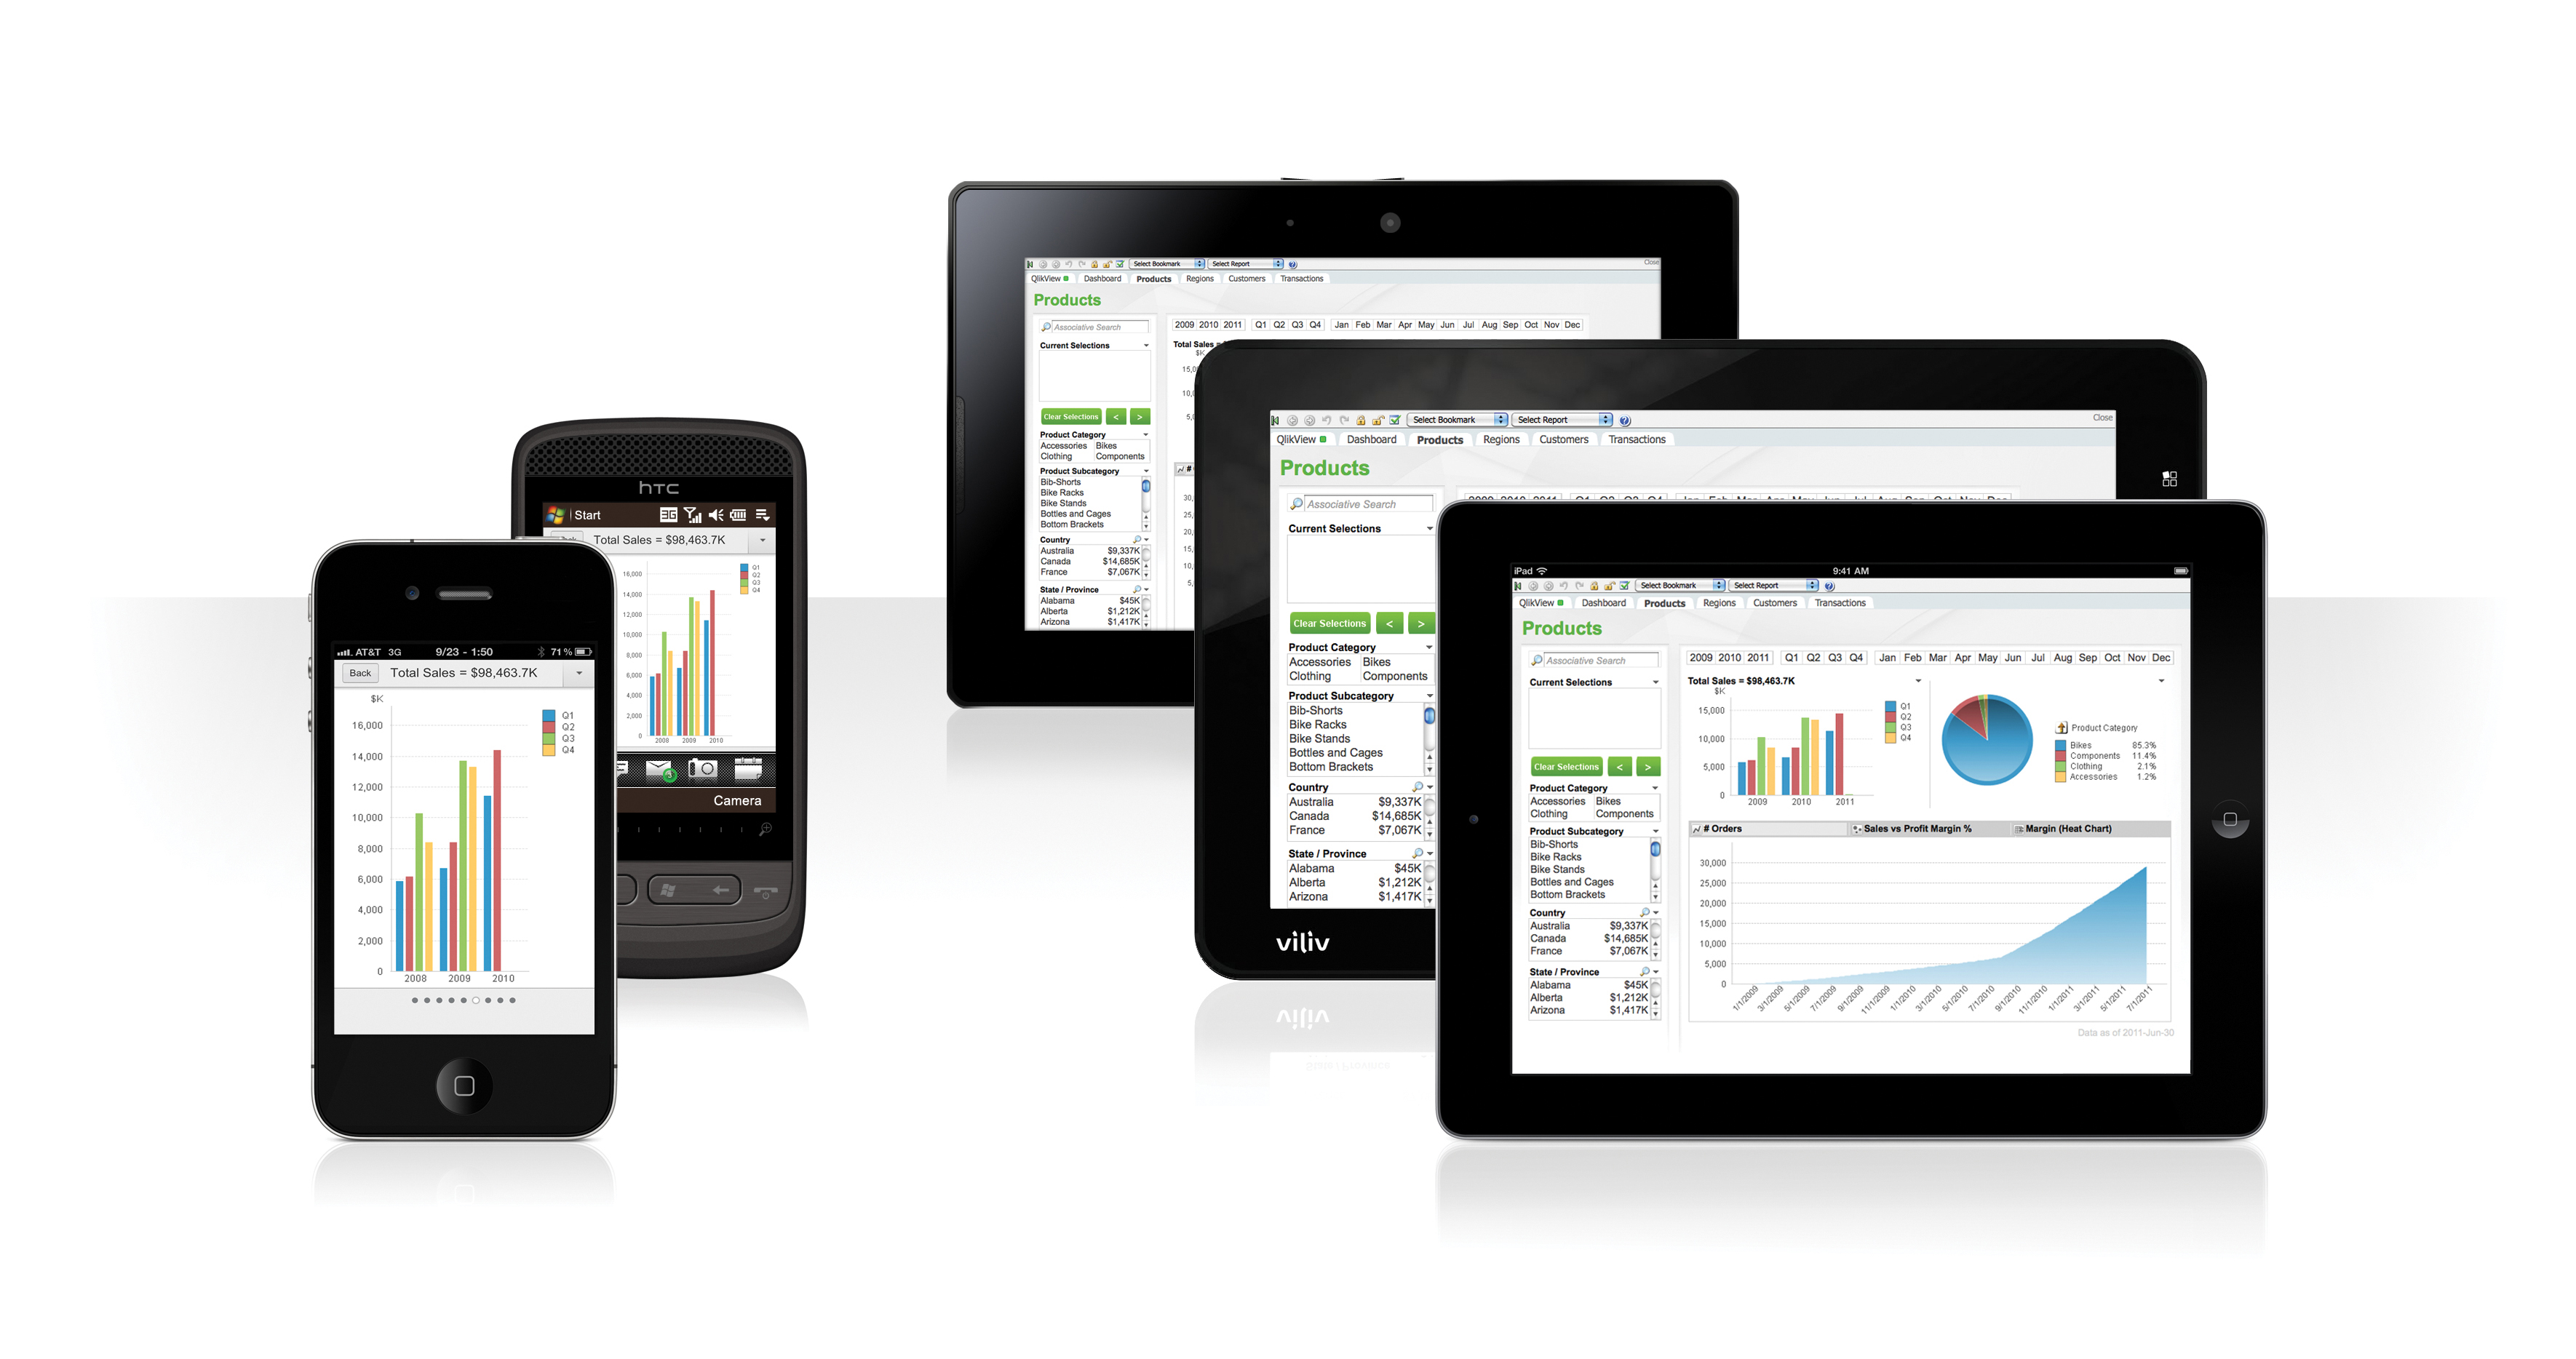
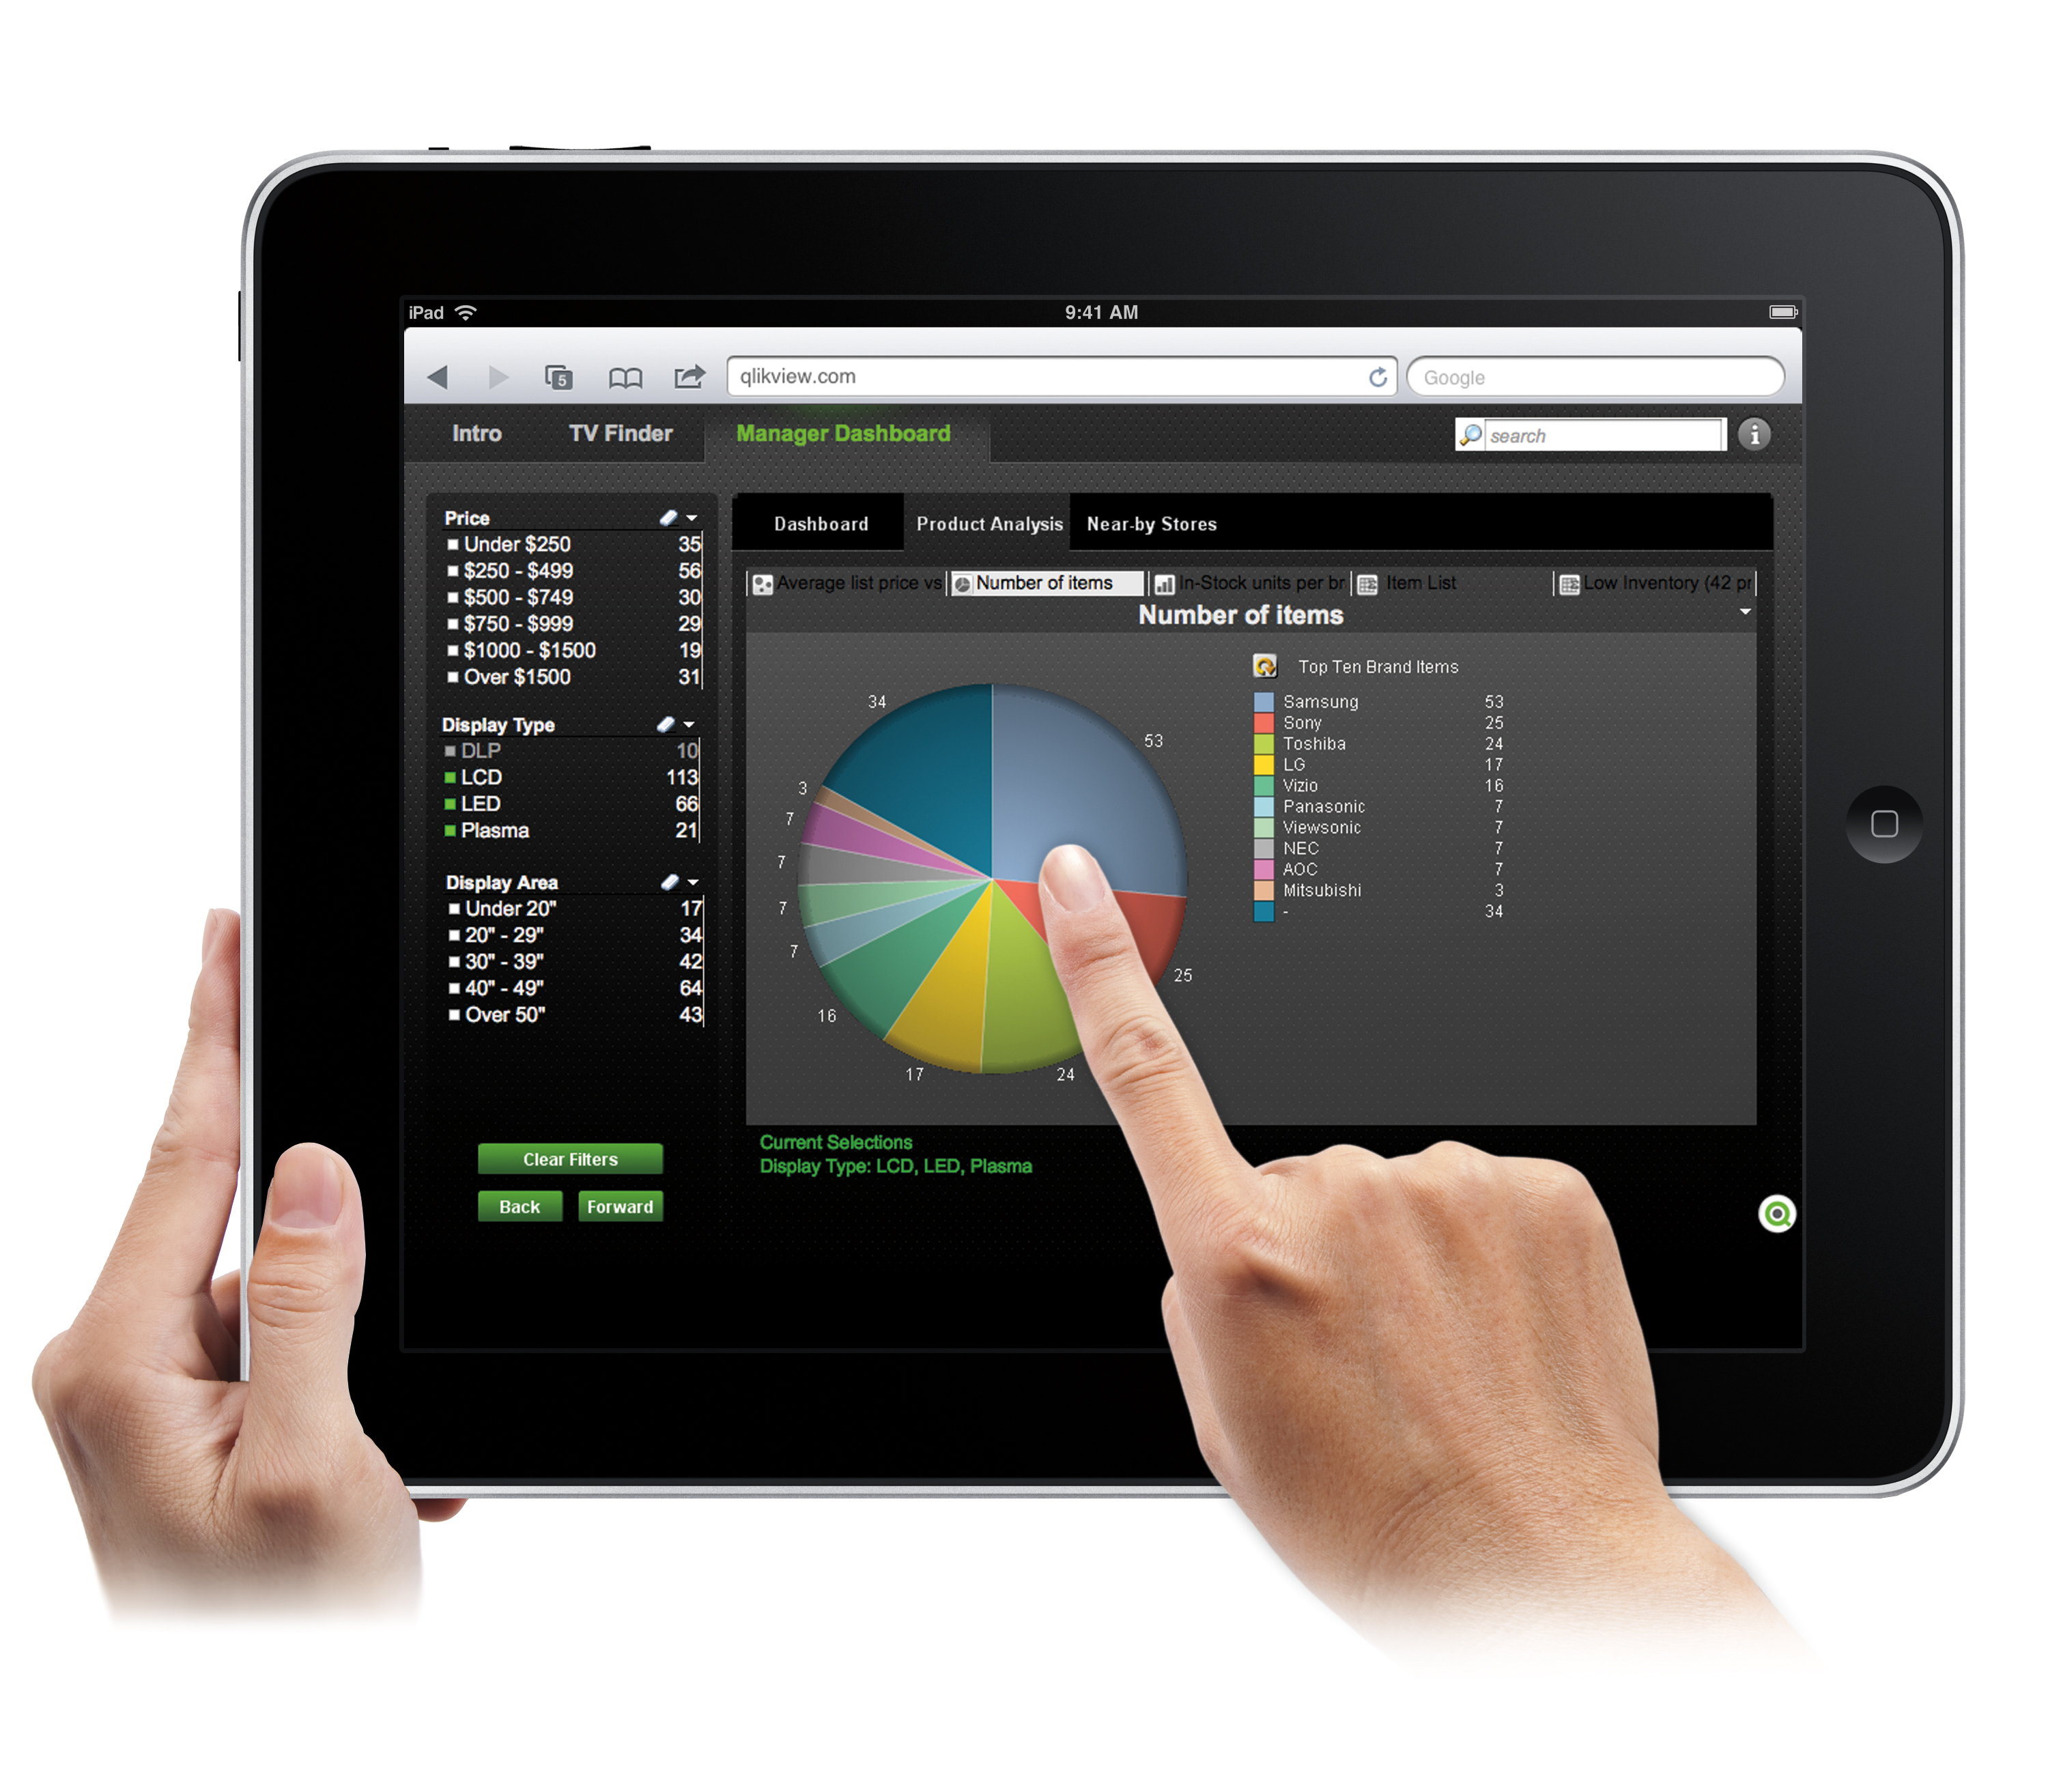
QlikView® is Qlik®’s original BI offering designed primarily for shared business intelligence reports and data visualizations. It offers guided exploration and discovery, collaborative analytics for sharing insight, and agile development and deployment.
N/A
Pricing
Jirav
QlikView
Editions & Modules
Starter
$10,000
per year
Pro
$15,000
per year
Enterprise
Contact Sales
QlikView
Custom
per user
Offerings
Pricing Offerings
Jirav
QlikView
Free Trial
Yes
Yes
Free/Freemium Version
No
No
Premium Consulting/Integration Services
No
Yes
Entry-level Setup Fee
No setup fee
Optional
Additional Details
—
On an perpetual license basis, based on server plus number of users.
Contact vendor for pricing.
I feel that Jirav would be best suited for companies with less than 75 employees that need a more robust software than Fathom (Quickbooks Onlne integrated FP&A tool based in Australia) that is very customizable, with simple revenue modeling, few personnel changes every month, few departments, no multi currency, and need collaboration only with top-level personnel. I think Jirav is a product that is being highly recommended in the accounting industry for outsourced accounting firms, but accounting only looks at historical information and there needs to more finance industry influence, approval, and input so they can improve their product.
Sales data validations have helped manage our justifications in the past, especially with regard to new product development and new business introduction. It has also been helpful in identifying trends with business impact and direction specific to quarter and monthly sales from ERP data as well as decisions to purchase equipment of staffing based on run rates and product demand.
One thing that can get out of hand is data output - if you aren't careful in your query, you may be overloaded with data dumps and drown in the amount of info you have to filter through. This is a user caution, not a comment on the software itself.
A de minimis incentive was given to thank the reviewer for their time. The incentive was not used to bias or drive a particular response, nor was the incentive contingent on a positive endorsement. More Info
Jirav integrates well with Quickbooks Online (QBO), and I like how you can easily customize the reporting presentation by combining GL accounts and showing more or less details as needed for managerial reporting
I like that Jirav is browser-based and that I can easily share reports with internal and external parties for comments
I feel more confident using Jirav than I do with Excel because there is more data validation, and some notifications will appear if there are errors in the model
The sales capacity model and ramping employees schedule that their implementation / professional services team built for us works well overall (with some limitations)
Ideally, having a direct integration into Jirav would be great for all our data. However, some of our software didn't have a direct integration, so I was glad that Jirav offered the ability to use a connected Google Sheet that lets me input data that can be imported directly into the system
A de minimis incentive was given to thank the reviewer for their time. The incentive was not used to bias or drive a particular response, nor was the incentive contingent on a positive endorsement. More Info
At times, I feel that Jirav is too customizable. It would be great if they could tailor the system to be more industry-specific. For example, if the system could provide standard formulas for SaaS industry metrics already within the system, then that would have saved me a ton of time with having to create the metrics myself. The formula creation for metrics is quite tedious as well because you can only do simple calculations, such as A + B or A x C. You cannot do A + B + C or A x B x C.
I struggle with the way they have their staff planning set up because I have to reimport an Excel every month with all the changes (new hires, terminations, pay changes), and the changes appear to be retroactive on reports, which doesn't make sense if someone receives a raise or pay change during the year. It would be much easier for planning for bookings if they could add a column for quota by salesperson.
If there are notifications of errors in the model, then the notifications will continue to present themselves after I resolve the issue. It would be nice if I could clear out notifications I know are not relevant anymore. I also still find errors in the system that I would have expected the system to notify me about, such as Assumptions that are set up but they are not included in any formulas, so I should delete that assumption to prevent anyone from thinking changing that assumption will impact the model.
There is some functionality for sharing reports and information, but there is not enough granularity in security settings to allow me to share certain information easily. For example, if I want to share information with managers to manage their departments' budget, but also not see their boss' compensation, then it takes some work to set that up. Or, if I want to share a report with a recruiter of planned headcount and salary, then I need to export it to Excel first and delete Actual headcount and salary, so they don't see current employees' compensation (including the person's boss' salary).
Customer and vendor names do not import, only the totals, so if you look at Actuals vs Plan, the actuals will show a total figure and the plan will show detail, creating the need for an external and manual reconciliation
There is no multi-currency available
Scenario analysis can be difficult to do quickly. For example, if I want to see the plan with planned hires and without planned hires, then I would need to create two separate plans, individually select and delete the planned hires in one plan and keep then in another plan, which is time-consuming
Using Google Sign-In causes the system to time-out frequently for me, so I get kicked out of the system and have to log back in. If I have multiple tabs of Jirav open, then re-logging in sometimes doesn't bring me back to where I was originally at.
You can export reports to Excel, but there are no formulas of the calculations, which makes it more difficult to understand how calculations are being performed unless you look in the browser and dig into the calculations. This also might make it more difficult if you decide to go to another software in the future since you may need to start from scratch in the next software
Seasonality has been difficult to model. For example, the way our model is set up, I can use an assumption for Q1, Q2, Q3 and Q4. However, if I update Q3 for this year, then it also updates Q3 of all subsequent years, which I don't want. A more complex model and additional maintenance would be needed to accomplish more accurate seasonality planning
We found that QlikView can be a bit slow in supporting some forms of encryption. It is web-based and we needed to upgrade all of our server to not support the older SSL and TLS 1 protocols, only support TLS 1.2 and TLS 1.3. However, QlikView could not run with TLS 1.2 and TLS 1.3. We had to wait over six months to get a version that would handle the newer TLS versions.
There are so many options with QlikView that you can get lost when developing a visualization. There are still items I have not yet figured out, such as labeling a graph with the name of a selected detail item.
QlikView works by pulling the data it is going to use for visualization into its database. I am a security reviewer and I need to make certain that PII and PHI is not pulled by QlikView for a visualization, otherwise this could become a reportable indecent.
A de minimis incentive was given to thank the reviewer for their time. The incentive was not used to bias or drive a particular response, nor was the incentive contingent on a positive endorsement. More Info
Ease of use, ability to load from pretty much any data source. today I created an application that loaded time sheets from excel that are not in a table format. With Qlik's "enable transformation steps" I was able to automate loads of multiple spreadsheets and multiple tabs easily. Could not do that with any other tool.
A de minimis incentive was given to thank the reviewer for their time. The incentive was not used to bias or drive a particular response, nor was the incentive contingent on a positive endorsement. More Info
QlikView is very easy to implement. The installation is very straight forward. QlikView has several different data connectors that can connect to different data sources very smoothly. The user interface to build the reports is very easy to understand. This helps to have a smaller learning curve. Something very helpful is that QlikView is a browser application for the end users. So, you don't need to install any applications on the user's computer.
A de minimis incentive was given to thank the reviewer for their time. The incentive was not used to bias or drive a particular response, nor was the incentive contingent on a positive endorsement. More Info
My experience with the Qlik support team has been somewhat limited, but every interaction I have had with them has been very professional and I received a response quickly. Typically if there is a technical issue, our IT team will follow up. My inquiries are specific to product functionality, and Qlik has been very helpful in clarifying any questions I might have.
A de minimis incentive was given to thank the reviewer for their time. The incentive was not used to bias or drive a particular response, nor was the incentive contingent on a positive endorsement. More Info
My team attended, but I cannot myself rate, but I think it was good as they've successfully launched a training program at our company themselves for users. It was 3-4 day training.
Training was as expected. The demo environments tend to be more fully featured that our own environment, but the training was clear and well delivered.
"Implementation" can mean a few things... so I'm not sure that this is the answer you want.... but here it goes: To me, implementation means: "Is the user interface intuitive and can I produce meaningful reports with ease?" On that score, I'd say YES. The amount of training required was minimal and the results were powerful. The desktop implementation is a simple, "blank" interface just waiting for your creativity. The pre-populated templates give you a reasonable start to any project -- and a good set of objects to "play around with" if you're just getting started. Finally, note that the "implementation" I used was baked into QuickBooks 2016 Enterprise -- called "Advanced Reporting"..... That integration makes it ultra useful and simple.
A de minimis incentive was given to thank the reviewer for their time. The incentive was not used to bias or drive a particular response, nor was the incentive contingent on a positive endorsement. More Info
Fathom was the cheapest and most basic as an add-on directly to QuickBooks Online Plus, but you lose functionality with Fathom if you use QuickBooks Online Advanced (QBOA). The main loss of functionality for me was the lack of multiple department reporting, which was absolutely necessary for my analysis. Jirav was half the price of Moscaic.tech, but I've heard Mosaic has standard metrics for the SaaS-industry, which is appealing after going through the tedious process of setting up metrics in Jirav. QBOA has additional reporting than QBO Plus, but not enough robust features for planning and modeling. PlaceCPM is Salesforce-based and a I felt having a strong Salesforce admin that can great reports made their unnecessary, and I feel like most of the time you need a Salesforce admin just to run Salesforce. Cube, Vena and OnPlan are spreadsheet-based, but I don't want to use spreadsheets. Prophix, Board and Anaplan seem outdated. Workday was more than what I needed
The only other vendor product that I have worked with that provides a similar experience to Qlikview is Tableau. I would recommend Tableau if your use case is to build a fixed dashboard. You can share reports for free without needing to buy additional licenses. I would recommend Qlikview if your users are looking for a more interactive experience. They can create new objects to represent the data which can't be accomplished as easily in Tableau
A de minimis incentive was given to thank the reviewer for their time. The incentive was not used to bias or drive a particular response, nor was the incentive contingent on a positive endorsement. More Info
You can use the free desktop version to do a lot of reporting and analysis work more quickly so the ROI is huge
QlikView is great at finding outliers such as data entry errors
QlikView is great at helping you quickly discover new insights about your business that can prompt you to take action that can immediately affect your cash flow.
A de minimis incentive was given to thank the reviewer for their time. The incentive was not used to bias or drive a particular response, nor was the incentive contingent on a positive endorsement. More Info