Logi Report vs. Looker
Logi Report vs. Looker
| Product | Rating | Most Used By | Product Summary | Starting Price |
|---|---|---|---|---|
 Logi Report | N/A | Logi Report (formerly JReport) is an embedded reporting platform provides developers and users with advanced pixel perfect, operational reporting capabilities for any data source. According to the vendor, JReport delivers insights for hundreds of thousands of users at over 10,000 installations worldwide. The vendor's goal is to empower ISVs and enterprise companies to embed the most sophisticated reports and dashboards into web applications. JReport developer Jinfonet… | N/A | |
 Looker | N/A | Looker is a BI application with an analytics-oriented application server that sits on top of relational data stores. It includes an end-user interface for exploring data, a reusable development paradigm for data discovery, and an API for supporting data in other systems. | N/A |
| Logi Report | Looker | |||||||||||||||
|---|---|---|---|---|---|---|---|---|---|---|---|---|---|---|---|---|
| Editions & Modules | No answers on this topic | No answers on this topic | ||||||||||||||
| Offerings |
| |||||||||||||||
| Entry-level Setup Fee | Optional | Required | ||||||||||||||
| Additional Details | — | Must contact sales team for pricing. | ||||||||||||||
| More Pricing Information | ||||||||||||||||
| Logi Report | Looker |
|---|
| Logi Report | Looker | ||||||||||||||||||
|---|---|---|---|---|---|---|---|---|---|---|---|---|---|---|---|---|---|---|---|
| BI Standard Reporting |
| ||||||||||||||||||
| Ad-hoc Reporting |
| ||||||||||||||||||
| Data Discovery and Visualization |
| ||||||||||||||||||
| Access Control and Security |
| ||||||||||||||||||
| Application Program Interfaces (APIs) / Embedding |
| ||||||||||||||||||
| Report Output and Scheduling |
| ||||||||||||||||||
| Mobile Capabilities |
|
| Logi Report | Looker | |
|---|---|---|
| Small Businesses |  Yellowfin Score 8.6 out of 10 | Yellowfin Score 8.6 out of 10 |
| Medium-sized Companies |  Reveal Score 10.0 out of 10 | Reveal Score 10.0 out of 10 |
| Enterprises |  Infor Birst Score 6.4 out of 10 |  Kyvos Semantic Layer Score 9.5 out of 10 |
| All Alternatives | View all alternatives | View all alternatives |
| Logi Report | Looker | |
|---|---|---|
| Likelihood to Recommend | 9.0 (7 ratings) | 8.3 (134 ratings) |
| Likelihood to Renew | - (0 ratings) | 9.2 (8 ratings) |
| Usability | - (0 ratings) | 8.8 (12 ratings) |
| Availability | - (0 ratings) | 10.0 (1 ratings) |
| Performance | - (0 ratings) | 6.0 (1 ratings) |
| Support Rating | - (0 ratings) | 8.8 (14 ratings) |
| Implementation Rating | - (0 ratings) | 10.0 (1 ratings) |
| Configurability | - (0 ratings) | 10.0 (1 ratings) |
| Contract Terms and Pricing Model | - (0 ratings) | 10.0 (1 ratings) |
| Ease of integration | - (0 ratings) | 10.0 (1 ratings) |
| Product Scalability | - (0 ratings) | 10.0 (1 ratings) |
| Professional Services | - (0 ratings) | 10.0 (1 ratings) |
| Vendor post-sale | - (0 ratings) | 10.0 (1 ratings) |
| Vendor pre-sale | - (0 ratings) | 10.0 (1 ratings) |
| Logi Report | Looker | |
|---|---|---|
| Likelihood to Recommend |  Insightsoftware, Inc
 Bill Goulet Co-Owner, SVP Business Solutions |  Google
 Daniel Dammerman Regional Sales Director |
| Pros | Insightsoftware, Inc
| Google
|
| Cons | Insightsoftware, Inc
| Google
|
| Likelihood to Renew | Insightsoftware, Inc No answers on this topic | Google
|
| Usability | Insightsoftware, Inc No answers on this topic | Google
|
| Reliability and Availability | Insightsoftware, Inc No answers on this topic | Google
 David Mynář Head Of Online Marketing |
| Performance | Insightsoftware, Inc No answers on this topic | Google
David Mynář Head Of Online Marketing |
| Support Rating | Insightsoftware, Inc No answers on this topic | Google
 Anson Abraham Data Lord |
| Implementation Rating | Insightsoftware, Inc No answers on this topic | Google
David Mynář Head Of Online Marketing |
| Alternatives Considered | Insightsoftware, Inc
| Google
|
| Contract Terms and Pricing Model | Insightsoftware, Inc No answers on this topic | Google
David Mynář Head Of Online Marketing |
| Return on Investment | Insightsoftware, Inc
| Google
|
| ScreenShots | Logi Report Screenshots    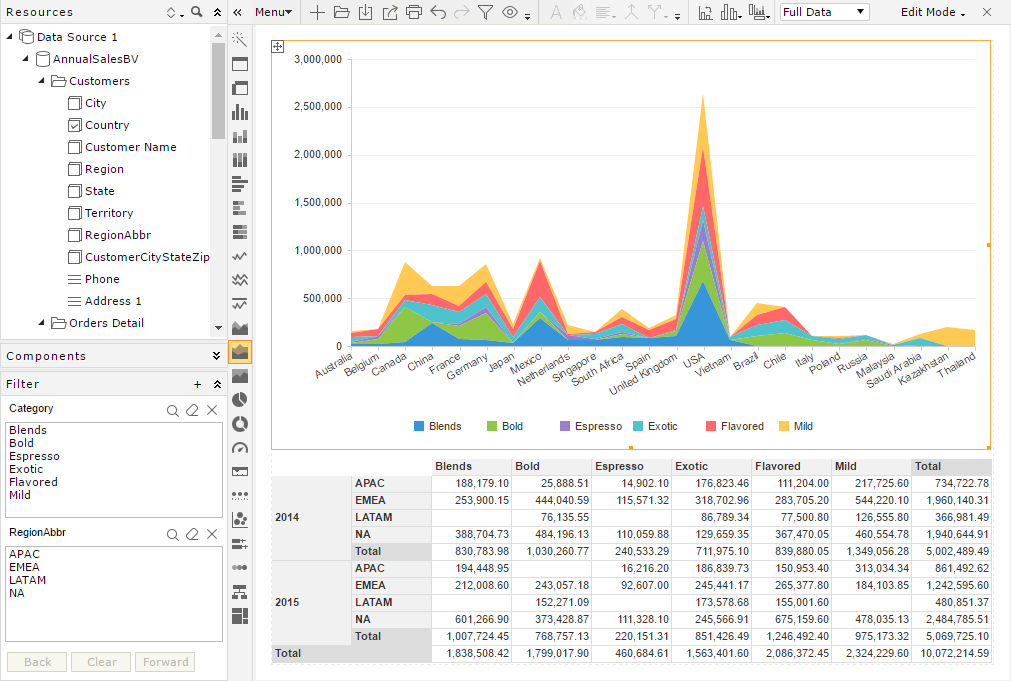  | Looker Screenshots |