Looker vs. Toucan
Looker vs. Toucan
| Product | Rating | Most Used By | Product Summary | Starting Price |
|---|---|---|---|---|
 Looker | N/A | Looker is a BI application with an analytics-oriented application server that sits on top of relational data stores. It includes an end-user interface for exploring data, a reusable development paradigm for data discovery, and an API for supporting data in other systems. | N/A | |
 Toucan | N/A | Toucan Toco, from the company of the same name headquartered in France, is an embedded BI solution that communicates contextualised and actionable insights to untrained business users, no matter their data literacy levels or device used, and without the need for training, coding or design skills, or hardware requirements. | N/A |
| Looker | Toucan | |||||||||||||||
|---|---|---|---|---|---|---|---|---|---|---|---|---|---|---|---|---|
| Editions & Modules | No answers on this topic | No answers on this topic | ||||||||||||||
| Offerings |
| |||||||||||||||
| Entry-level Setup Fee | Required | Optional | ||||||||||||||
| Additional Details | Must contact sales team for pricing. | — | ||||||||||||||
| More Pricing Information | ||||||||||||||||
| Looker | Toucan |
|---|
| Looker | Toucan | |||||||||||||||
|---|---|---|---|---|---|---|---|---|---|---|---|---|---|---|---|---|
| BI Standard Reporting |
| |||||||||||||||
| Ad-hoc Reporting |
| |||||||||||||||
| Report Output and Scheduling |
| |||||||||||||||
| Data Discovery and Visualization |
| |||||||||||||||
| Access Control and Security |
| |||||||||||||||
| Mobile Capabilities |
|
| Looker | Toucan | |
|---|---|---|
| Small Businesses |  Yellowfin Score 8.6 out of 10 | Yellowfin Score 8.6 out of 10 |
| Medium-sized Companies |  Reveal Score 10.0 out of 10 | Reveal Score 10.0 out of 10 |
| Enterprises |  Kyvos Semantic Layer Score 9.5 out of 10 |  Infor Birst Score 6.4 out of 10 |
| All Alternatives | View all alternatives | View all alternatives |
| Looker | Toucan | |
|---|---|---|
| Likelihood to Recommend | 8.3 (134 ratings) | 7.0 (1 ratings) |
| Likelihood to Renew | 9.2 (8 ratings) | - (0 ratings) |
| Usability | 8.8 (12 ratings) | - (0 ratings) |
| Availability | 10.0 (1 ratings) | - (0 ratings) |
| Performance | 6.0 (1 ratings) | - (0 ratings) |
| Support Rating | 8.8 (14 ratings) | 10.0 (1 ratings) |
| Implementation Rating | 10.0 (1 ratings) | - (0 ratings) |
| Configurability | 10.0 (1 ratings) | - (0 ratings) |
| Contract Terms and Pricing Model | 10.0 (1 ratings) | - (0 ratings) |
| Ease of integration | 10.0 (1 ratings) | - (0 ratings) |
| Product Scalability | 10.0 (1 ratings) | - (0 ratings) |
| Professional Services | 10.0 (1 ratings) | - (0 ratings) |
| Vendor post-sale | 10.0 (1 ratings) | - (0 ratings) |
| Vendor pre-sale | 10.0 (1 ratings) | - (0 ratings) |
| Looker | Toucan | |
|---|---|---|
| Likelihood to Recommend |  Google
 Daniel Dammerman Regional Sales Director | Toucan
 Kathleen Paluso Director, Customer Success & Implementation |
| Pros | Google
| Toucan
Kathleen Paluso Director, Customer Success & Implementation |
| Cons | Google
| Toucan
Kathleen Paluso Director, Customer Success & Implementation |
| Likelihood to Renew | Google
| Toucan No answers on this topic |
| Usability | Google
| Toucan No answers on this topic |
| Reliability and Availability | Google
 David Mynář Head Of Online Marketing | Toucan No answers on this topic |
| Performance | Google
David Mynář Head Of Online Marketing | Toucan No answers on this topic |
| Support Rating | Google
 Anson Abraham Data Lord | Toucan
Kathleen Paluso Director, Customer Success & Implementation |
| Implementation Rating | Google
David Mynář Head Of Online Marketing | Toucan No answers on this topic |
| Alternatives Considered | Google
| Toucan No answers on this topic |
| Contract Terms and Pricing Model | Google
David Mynář Head Of Online Marketing | Toucan No answers on this topic |
| Return on Investment | Google
| Toucan
Kathleen Paluso Director, Customer Success & Implementation |
| ScreenShots | Looker Screenshots | Toucan Screenshots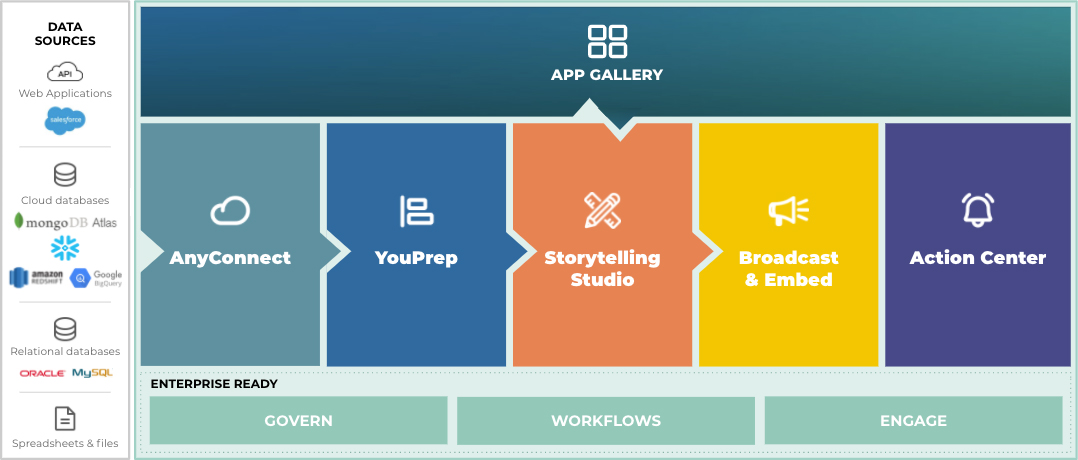   |