Nagios Core vs. TrueSight Operations Management (discontinued)
Nagios Core vs. TrueSight Operations Management (discontinued)
| Product | Rating | Most Used By | Product Summary | Starting Price |
|---|---|---|---|---|
 Nagios Core | N/A | Nagios provides monitoring of all mission-critical infrastructure components. Multiple APIs and community-build add-ons enable integration and monitoring with in-house and third-party applications for optimized scaling. | N/A | |
 TrueSight Operations Management (discontinued) | N/A | TrueSight Operations Management was an IT infrastructure monitoring and management application. The product reached End of Life in July of 2023. | N/A |
| Nagios Core | TrueSight Operations Management (discontinued) | |||||||||||||||
|---|---|---|---|---|---|---|---|---|---|---|---|---|---|---|---|---|
| Editions & Modules |
| No answers on this topic | ||||||||||||||
| Offerings |
| |||||||||||||||
| Entry-level Setup Fee | No setup fee | Optional | ||||||||||||||
| Additional Details | — | — | ||||||||||||||
| More Pricing Information | ||||||||||||||||
| Nagios Core | TrueSight Operations Management (discontinued) |
|---|
| Nagios Core | TrueSight Operations Management (discontinued) | |
|---|---|---|
| Small Businesses |  ConnectWise Automate Score 8.5 out of 10 | ConnectWise Automate Score 8.5 out of 10 |
| Medium-sized Companies |  Icinga Score 8.8 out of 10 | Icinga Score 8.8 out of 10 |
| Enterprises |  ScienceLogic SL1 Score 8.8 out of 10 | ScienceLogic SL1 Score 8.8 out of 10 |
| All Alternatives | View all alternatives | View all alternatives |
| Nagios Core | TrueSight Operations Management (discontinued) | |
|---|---|---|
| Likelihood to Recommend | 8.5 (44 ratings) | 8.0 (5 ratings) |
| Likelihood to Renew | 9.9 (3 ratings) | - (0 ratings) |
| Usability | 4.0 (1 ratings) | - (0 ratings) |
| Support Rating | 7.7 (9 ratings) | - (0 ratings) |
| Nagios Core | TrueSight Operations Management (discontinued) | |
|---|---|---|
| Likelihood to Recommend |  Nagios Enterprises
 Shawn Brito Senior Systems Architect |  Discontinued Products
 Sean O'Brien Senior Manager of Enterprise Solutions for Monitoring |
| Pros | Nagios Enterprises
 Eric Krueger Operations/Systems Manager | Discontinued Products
 Allan Danquoins Monitoring Analyst & Exploitation |
| Cons | Nagios Enterprises
| Discontinued Products
 Andrew Kawczynski Systems Administrator - ROC Technology |
| Likelihood to Renew | Nagios Enterprises
| Discontinued Products No answers on this topic |
| Usability | Nagios Enterprises
| Discontinued Products No answers on this topic |
| Support Rating | Nagios Enterprises
 Chris Saenz Lead System Engineer | Discontinued Products No answers on this topic |
| Alternatives Considered | Nagios Enterprises  Pavan Mehare Linux Administrator | Discontinued Products
|
| Return on Investment | Nagios Enterprises
| Discontinued Products
 Benjamin McKrill Enterprise Management Automation Administrator |
| ScreenShots | TrueSight Operations Management (discontinued) Screenshots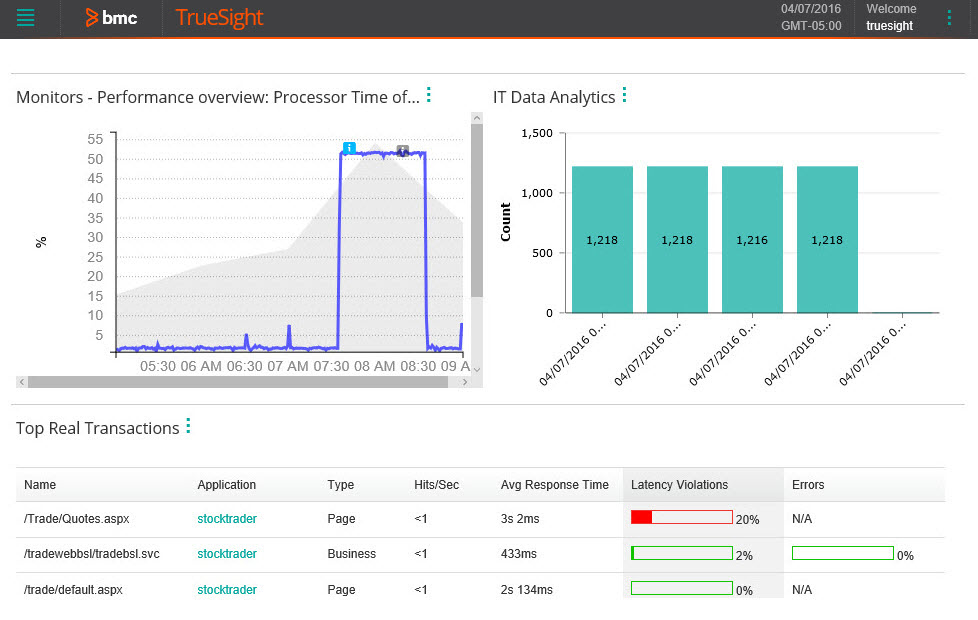 |