
Snehal Katariya CSM, CSPO
Product Owner / Business Analyst
Chose Panorama Necto
| Product | Rating | Most Used By | Product Summary | Starting Price |
|---|---|---|---|---|
 Panorama Necto | N/A | Panorama Necto is a business intelligence solution that provides enterprises with new ways to collaborate and create unique contextual connections. Some key features include: Workboards/Dashboards, Advanced Analytics, and Contextual Discovery. | N/A | |
 Tableau Desktop | N/A | Tableau Desktop is a data visualization product from Tableau. It connects to a variety of data sources for combining disparate data sources without coding. It provides tools for discovering patterns and insights, data calculations, forecasts, and statistical summaries and visual storytelling. | $115 per month (billed annually) per user |
| Panorama Necto | Tableau Desktop | |||||||||||||||
|---|---|---|---|---|---|---|---|---|---|---|---|---|---|---|---|---|
| Editions & Modules | No answers on this topic |
| ||||||||||||||
| Offerings |
| |||||||||||||||
| Entry-level Setup Fee | No setup fee | No setup fee | ||||||||||||||
| Additional Details | — | All pricing plans are billed annually. A Creator license includes Tableau Desktop, Tableau Prep Builder, and Tableau Pulse. Discounts sometimes available for volume. | ||||||||||||||
| More Pricing Information | ||||||||||||||||
| Panorama Necto | Tableau Desktop | |
|---|---|---|
| Considered Both Products |  Panorama Necto Snehal Katariya CSM, CSPO Product Owner / Business Analyst Chose Panorama Necto  Hema Malini Senior Software Engineer Chose Panorama Necto Tableau Desktop and Pentaho  Felix BOGNOU Datawarehouse and BI Architect Chose Panorama Necto Panorama Necto is a very self service BI, data discovery and automation tool. It empowers business users with data discovery tools.  Malabyajit Roy IT Analyst Chose Panorama Necto More visually enriched infographics and geo analytics and lower license cost means Panorama is a front runner in comparison to the tools mentioned above.  Sarmista Nath Senior Sofware Engineer Chose Panorama Necto No I have not used any other self service BI tool.  Nidhish Khare BI Developer Chose Panorama Necto This is the next generation BI tool, which will be very helpful for small and medium businesses to kick start data exploration and visualization of their diverse databases, with less intervention from IT. This tool is more end user centric and gives way more power to the end …  Sidharth Dash Data Visualization and BI Consultant Chose Panorama Necto One of the best tools in the market available today. I started getting attached to this tool recently and this never stops amazing me. I can connect to a variety of data sources and quickly analyze my data. The best part of this product is the built-in intelligence system which … Chose Panorama Necto We compared Panorama Necto with another leading product. Necto's cost and visual appeal were certainly winners.  Dileep Kumar Varala System Analyst Chose Panorama Necto We can visualize the data right away in Necto. Where as we have to create reports in SAP Business Objects to present it to the business user. The reports have to be scheduled at particular time to get the presentation. We need to have additional SDK code for SAP Business …  Dilip Prajapati BI Developer Chose Panorama Necto We have evaluated few small vendor's BI tools for reporting purposes. Among other BI tools, we found Necto is quite easy to use and provides very good data visualization. Also it provides collaboration features which are least supported by other BI tools.  Chittiappa Areyada QA Lead & Test Analyst Disney Consumer Products for Satwic Inc Chose Panorama Necto In comparison with Pentaho Business Analytics, Panorama Necto 14 is providing similar features where it is distinguished through its provision of a suggestive analytics feature. This is fairly unique to the Panorama Necto 14 software where it analyzes information from various …  Rajan Patel BI Intelligence Developer Chose Panorama Necto It works very well with Microsoft tools and platforms.  Aditya Singh Programmer Analyst Chose Panorama Necto We are evaluating different data visualization tools and recently I tried Panorama Necto. I was really amazed with this product as it's a new age technology and powerful tool for visualizing data, creating reports. It comes with Infographics which is great and best unique …  manshul goel IT Analyst Chose Panorama Necto we are assessing latest BI tools available in market for customer  Soumya Roy Senior BI Analyst Chose Panorama Necto All the above mentioned BI tools are complex from a maintenance perspective. They are not easy to learn. All those BI tools have limited cloud based reporting capability. Whereas Necto is a fully web based self service BI tool. It's collaborative capability makes it stack up …  Lewis Ewing UI Designer Chose Panorama Necto It provides attractive info-graphics according to user's interest. Their visual materiels are modern and stylish. You can use the same dashboard everywhere. Necto always keeps you up-to-date through mobile devices. It gives you many automated analysis and recommendations …  Gaurav Pandya Data Analyst Chose Panorama Necto Collaboration on data is super powerful in the case of Necto and wins all the medals compared to other BI tools. The real time analysis for decision making is extremely easy and just a click away, which is really not a smooth case for other BI tools.  GP Nath Data Analyst Chose Panorama Necto
 Milos Milenkovic Senior Business Intelligence/Reporting Developer Chose Panorama Necto Tableau, QlikView, Power BI, Klipfolio, Zoho Reports... |  Tableau Desktop  Manidipa Kundu Data Analyst Chose Tableau Desktop Both power bi and Tableau Desktop has its own pros and cons. Microsoft power bi is best to work with Microsoft products. however for fast connection with diverse range of integration with data sources Tableau Desktop is best. if you are cost sensitive power bi is best option …  Jannika Rasi Senior Business Analyst Chose Tableau Desktop Tableau is more flexible than these - I liked Qlikview old version a lot but have not used the Qlik Sense etc new ones. Tableau user logic is harder to understand than Looker Studio. However it's more trust worthy. Connecting internet sources to Tableau Desktop is much harder. …  Karol Kozłowski Project manager Chose Tableau Desktop We used to use products from the Google family in parallel. After migrating to GA4, we use Tableau much more.  Liz Brandon Sr Manager Performance Analytics Chose Tableau Desktop Tableau Desktop has a more easy to use drag and drop interface and is easier to learn. It also allows greater customization of charts than Power BI. However, Tableau Desktop costs more than Power BI which is bundled into our Microsoft contract at no additional charge. Power BI …  Amanda McCombs Director Client Operations & Analysis Chose Tableau Desktop The visualizations are far and away more powerful and it is more user friendly than Power BI. It would take 3-4 times as long to create the types of reports in Excel that I can create in Tableau Desktop and there are a slew of ways I can present the data in Tableau Desktop that …  Shubham Tiwari Data analyst Chose Tableau Desktop Tableau can create visually attractive customizable dashboards than can quickly by drag-drop while in power bi we can create simple dashboard. Power bi support lesser data source while in Tableau there is a lot of options When we talk about data handling tableau is a clear …  Tohidul Islam Information Technology Team Lead Chose Tableau Desktop With Tableau Desktop, it's easy to create a report in the
context quickly. It allows for the seamless management of the data sources,
which is convenient for the data users. Because it is simple to use, it is  Orin Mamun Junior Frontend Developer Chose Tableau Desktop For complex data visualization, Tableau Desktop shines. Even though it uses highly granular databases, it has a powerful engine that can process large amounts of data quickly and produce high-quality charts. It has the broadest range of APIs and is extremely simple. The …  Jeremy Pierce, MBA Data Warehouse Engineer Chose Tableau Desktop We decided to use Tableau Desktop as that's fairly standard in the industry, it is being taught in college, and is widely known. Tableau Desktop is nice, but in my opinion, it is VERY expensive. Unless you are really making money off of decisions, then your ROI is going to be …  Al Mubassir Muin Software Engineer Chose Tableau Desktop Using Tableau Desktop, we have found it the most actionable and user-friendly application ever. It has the broadest range of APIs and is exceptionally user-friendly. It can handle a large amount of data and produce smooth charts quickly. For data geeks, this is the ideal stack.  Afia Tamanna Information Technology Business Consultant Chose Tableau Desktop Tableau Desktop is preferred over other BI software because it allows for more data visualization, storytelling, and dashboards. Microsoft Power BI may be a better option if you need to perform data modeling, however. Tableau Desktop is an excellent tool for nearly all other …  Joseph Alleruzzo Director, Client Lead Chose Tableau Desktop Tableau Desktop is the most user-friendly and actionable application we have used in comparison to others. It has the best API connection potential along with easy start-up. They seem to always be updating the platform to solve newer problems which help keep my company up to … |
| Panorama Necto | Tableau Desktop | |||||||||||||||||||||
|---|---|---|---|---|---|---|---|---|---|---|---|---|---|---|---|---|---|---|---|---|---|---|
| BI Standard Reporting |
| |||||||||||||||||||||
| Ad-hoc Reporting |
| |||||||||||||||||||||
| Report Output and Scheduling |
| |||||||||||||||||||||
| Data Discovery and Visualization |
| |||||||||||||||||||||
| Access Control and Security |
| |||||||||||||||||||||
| Mobile Capabilities |
| |||||||||||||||||||||
| Application Program Interfaces (APIs) / Embedding |
|
| Panorama Necto | Tableau Desktop | |
|---|---|---|
| Small Businesses |  Yellowfin Score 8.6 out of 10 | Yellowfin Score 8.6 out of 10 |
| Medium-sized Companies |  Reveal Score 10.0 out of 10 | Reveal Score 10.0 out of 10 |
| Enterprises |  Kyvos Semantic Layer Score 9.5 out of 10 | Kyvos Semantic Layer Score 9.5 out of 10 |
| All Alternatives | View all alternatives | View all alternatives |
| Panorama Necto | Tableau Desktop | |
|---|---|---|
| Likelihood to Recommend | 8.0 (0 ratings) | 9.0 (0 ratings) |
| Likelihood to Renew | 8.0 (0 ratings) | 7.5 (0 ratings) |
| Usability | 8.2 (0 ratings) | 8.3 (0 ratings) |
| Availability | - (0 ratings) | 10.0 (0 ratings) |
| Performance | - (0 ratings) | 8.0 (0 ratings) |
| Support Rating | 7.1 (0 ratings) | 1.0 (0 ratings) |
| In-Person Training | - (0 ratings) | 9.4 (0 ratings) |
| Online Training | - (0 ratings) | 8.0 (0 ratings) |
| Implementation Rating | 6.7 (0 ratings) | 8.0 (0 ratings) |
| Configurability | - (0 ratings) | 7.0 (0 ratings) |
| Ease of integration | - (0 ratings) | 10.0 (0 ratings) |
| Product Scalability | - (0 ratings) | 9.0 (0 ratings) |
| Vendor post-sale | - (0 ratings) | 10.0 (0 ratings) |
| Vendor pre-sale | - (0 ratings) | 10.0 (0 ratings) |
| Panorama Necto | Tableau Desktop | |
|---|---|---|
| Likelihood to Recommend |
Soumya Roy Senior BI Analyst |
Karol Kozłowski Project manager |
| Pros |
Sarmista Nath Senior Sofware Engineer |
|
| Cons |
Felix BOGNOU Datawarehouse and BI Architect |
|
| Likelihood to Renew |
Lewis Ewing UI Designer |
 Mashhood Syed BI Analyst |
| Usability |
Milos Milenkovic Senior Business Intelligence/Reporting Developer |
Al Mubassir Muin Software Engineer |
| Reliability and Availability | No answers on this topic |
 Brad Llewellyn Associate Data Analytics Consultant |
| Performance | No answers on this topic |
|
| Support Rating |
Hema Malini Senior Software Engineer |
|
| In-Person Training | No answers on this topic |
 Jon Boeckenstedt Associate Vice President |
| Online Training | No answers on this topic |
|
| Implementation Rating |
Milos Milenkovic Senior Business Intelligence/Reporting Developer |
 Phillip Smith Sr. Financial Analyst (Finance Manager) |
| Alternatives Considered |
Chittiappa Areyada QA Lead & Test Analyst Disney Consumer Products for Satwic Inc |
|
| Scalability | No answers on this topic |
|
| Return on Investment | No answers on this topic |
Afia Tamanna Information Technology Business Consultant |
| ScreenShots | Panorama Necto Screenshots 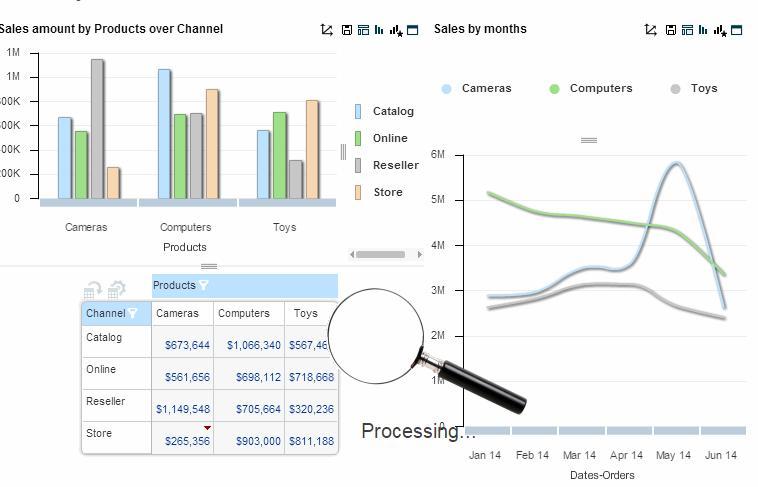 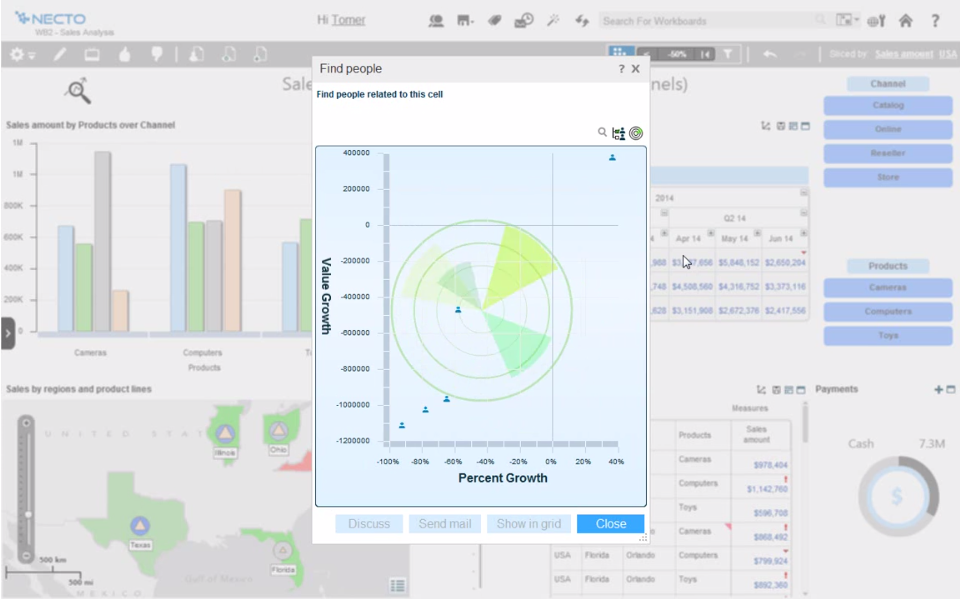   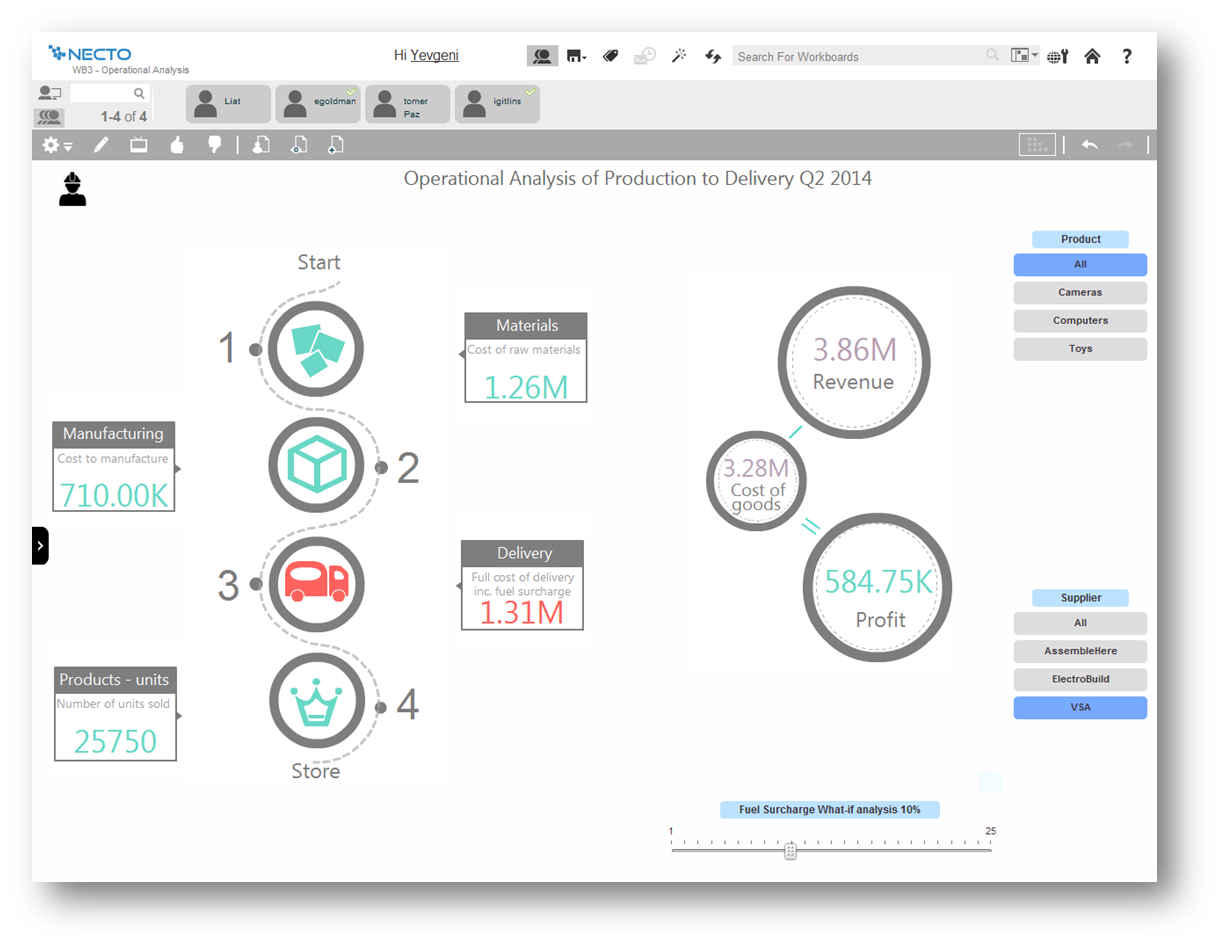 |
