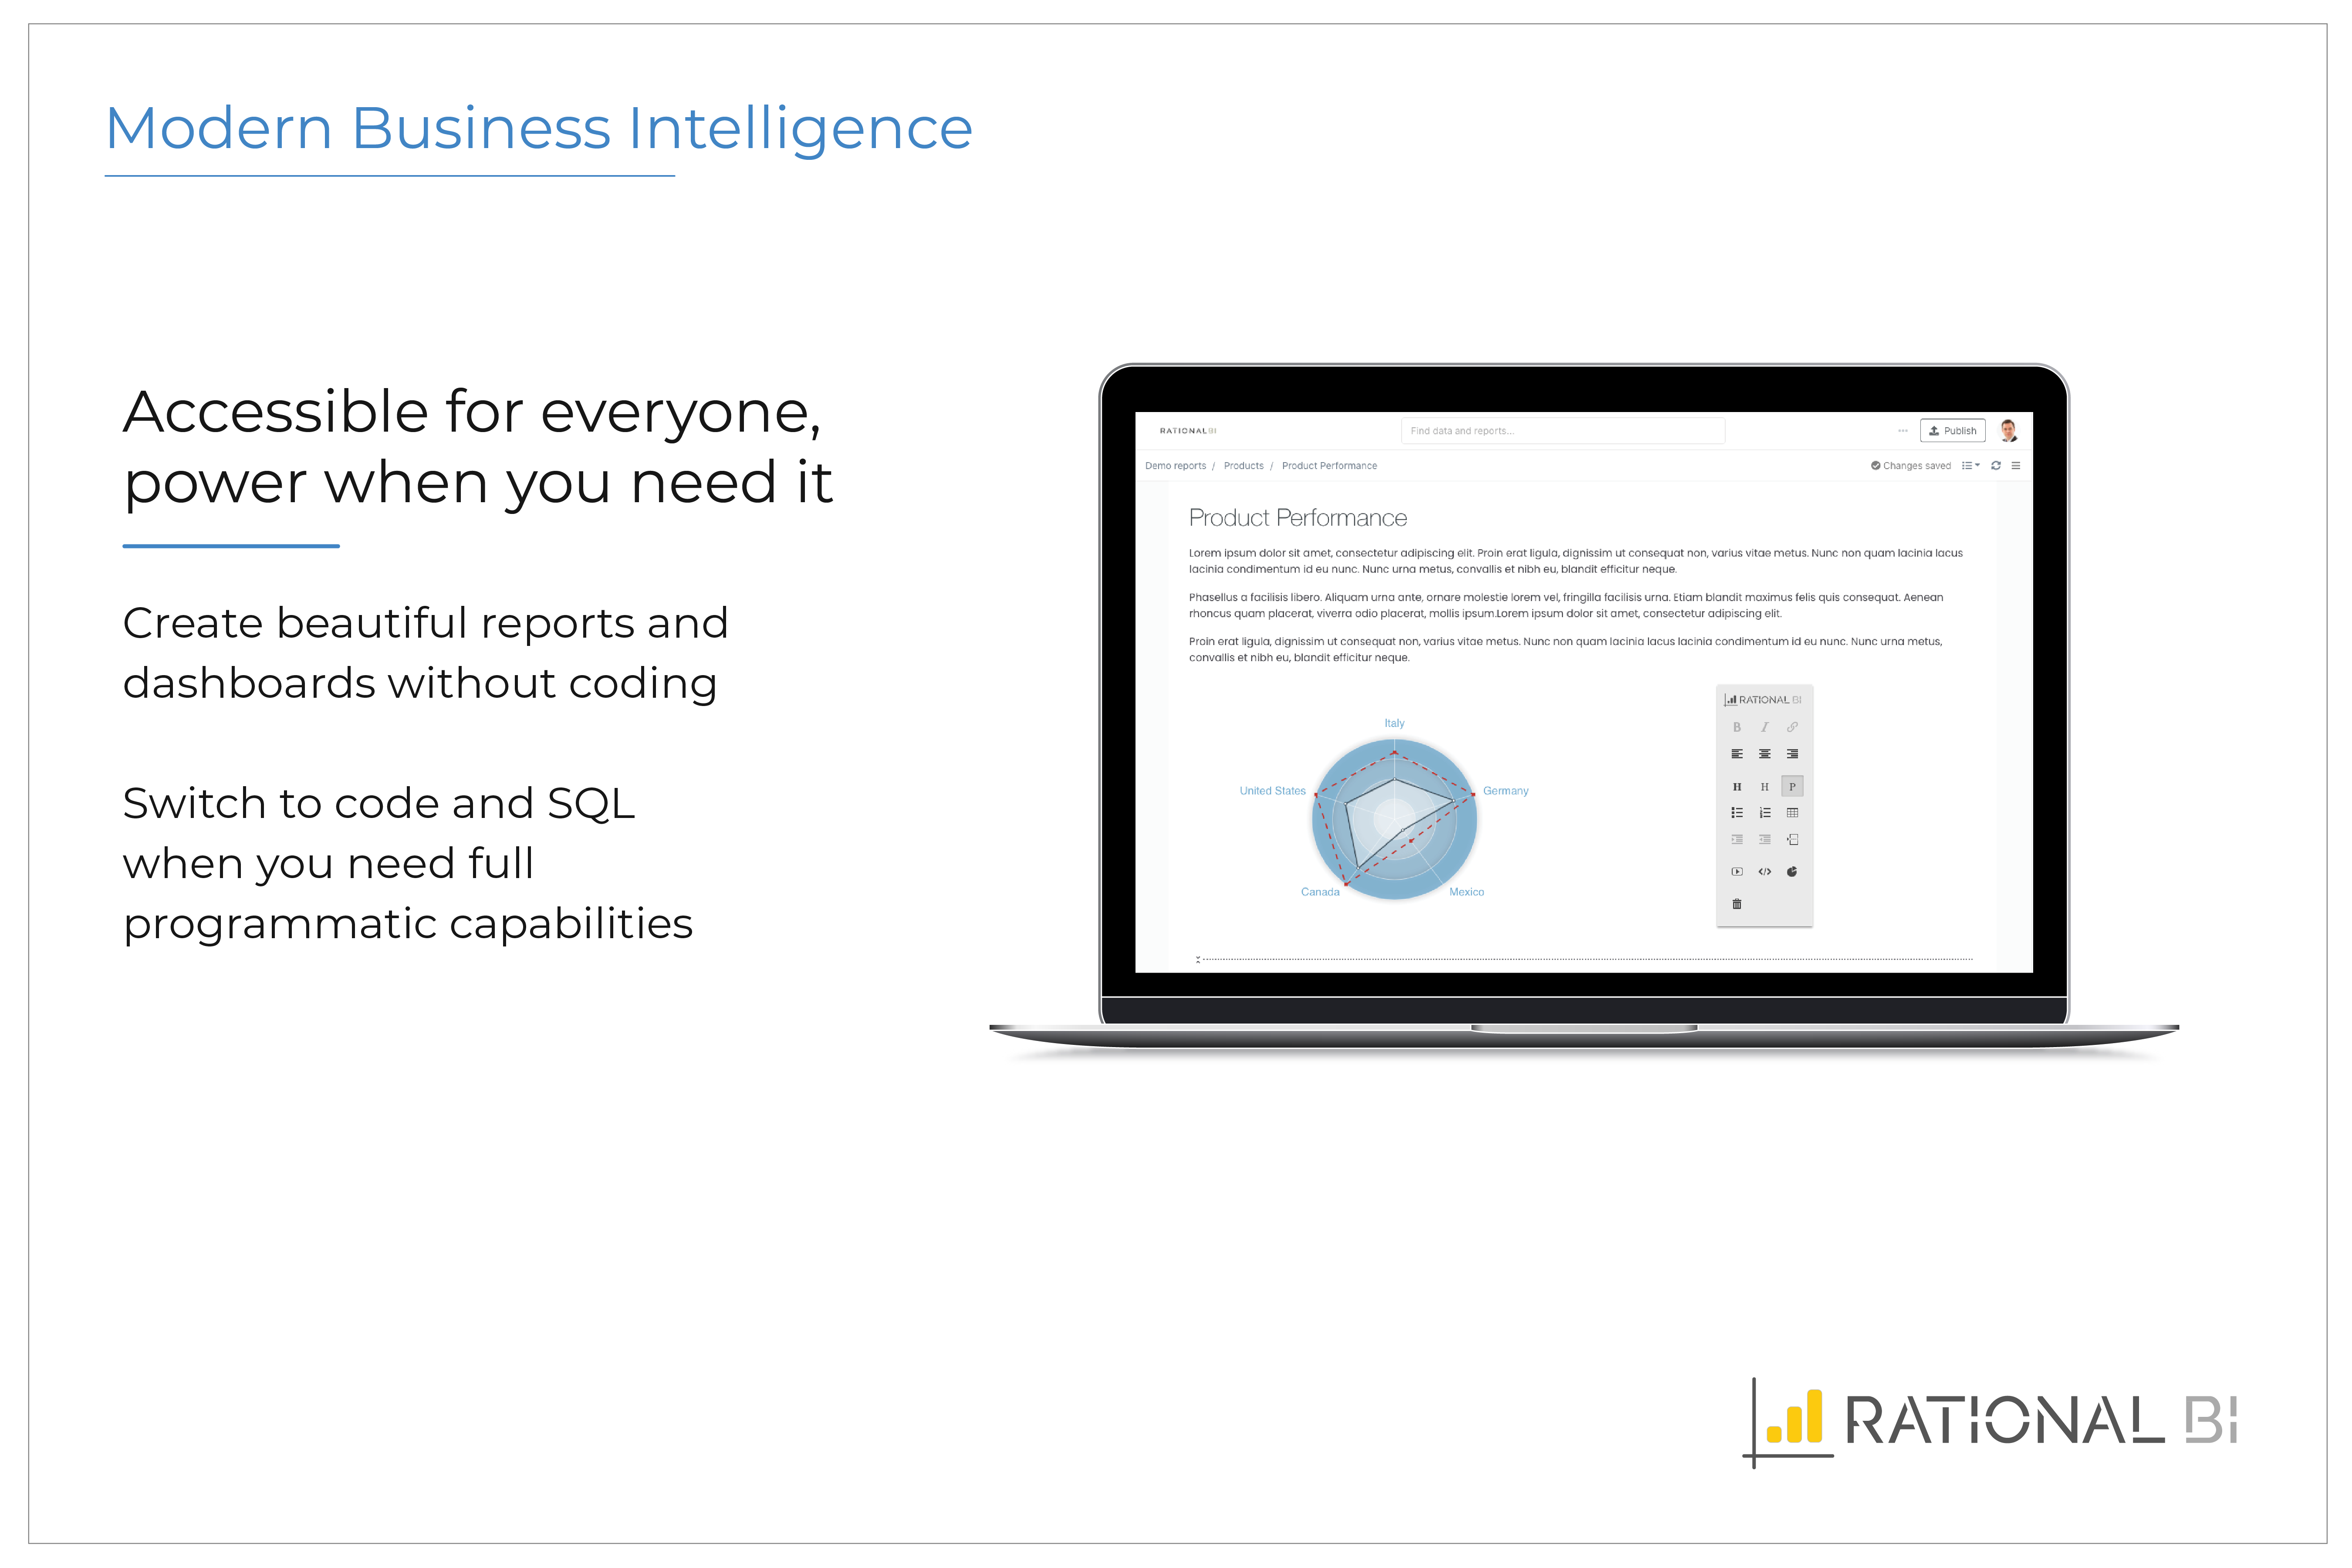
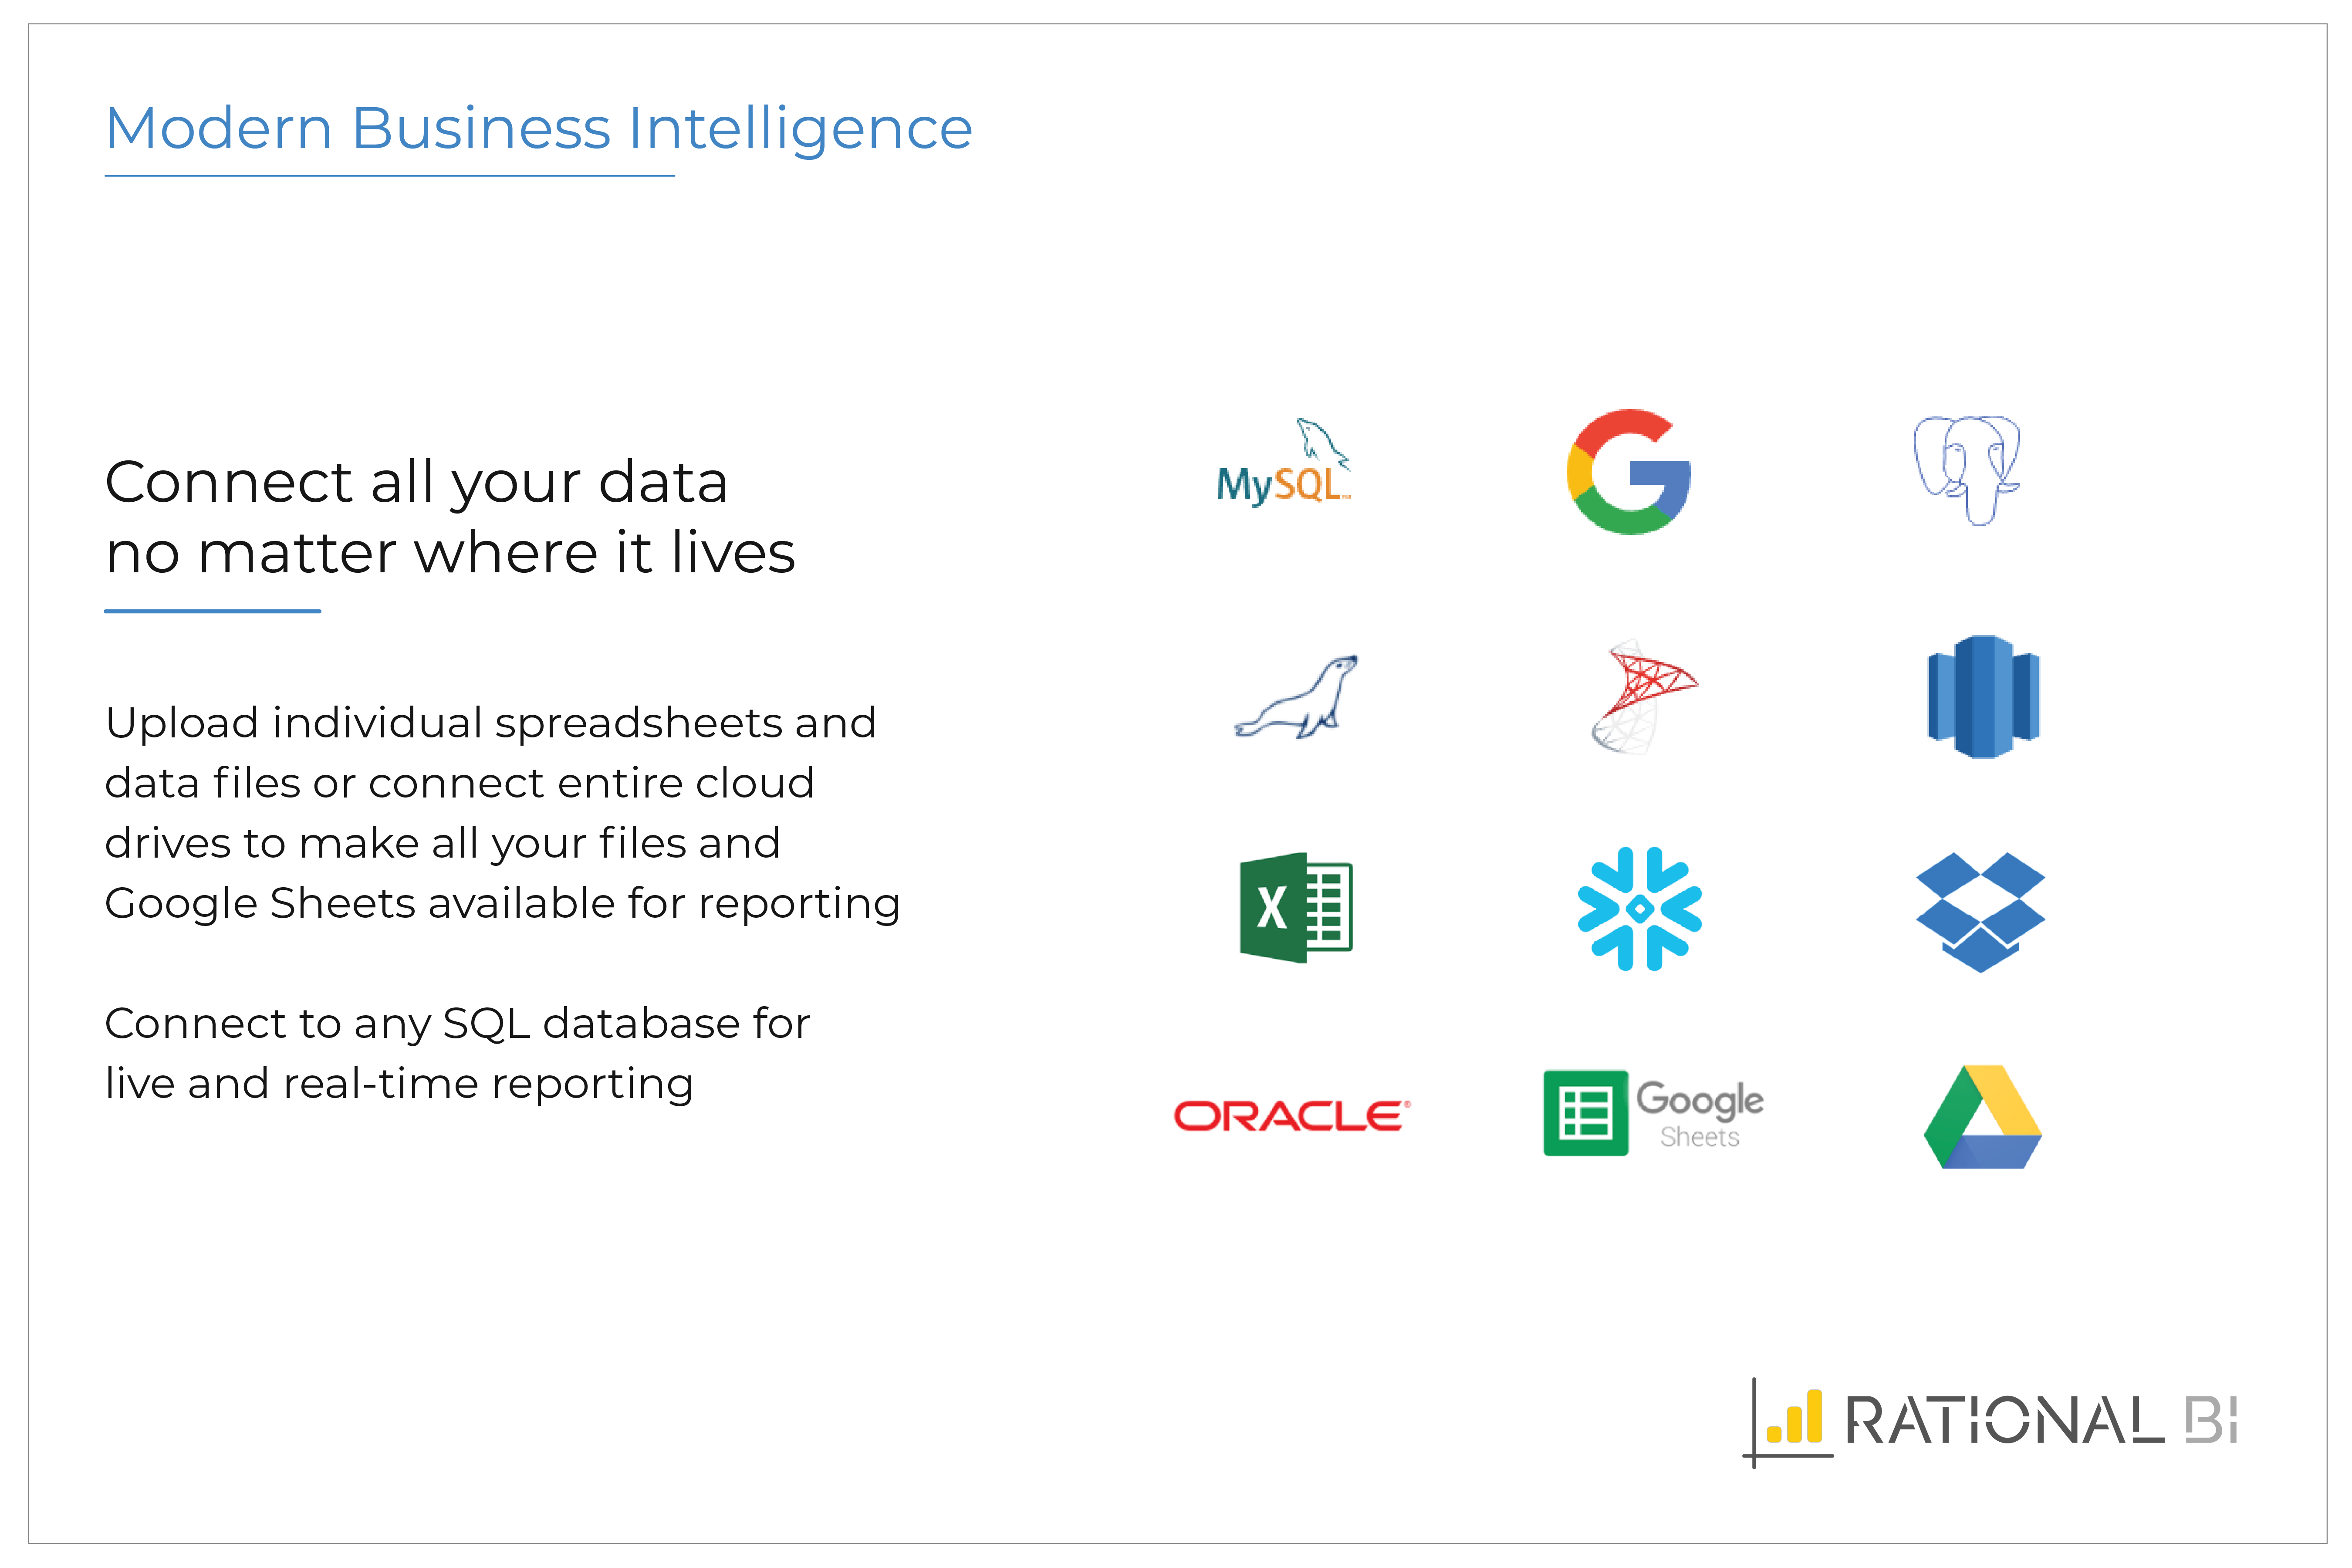
Rational BI provides analytics, data science and business intelligence in an analytical platform that connects to databases, data files and cloud drives including AWS and Azure data sources, enabling users to explore and visualize data. Users can build real-time notebook-style reports directly in a web browser with JavaScript and SQL with direct and live connections to data. Filter and query data with an SQL database embedded in the client, without network…
$0
single user
Tableau Server
Score 7.6 out of 10
N/A
Tableau Server allows Tableau Desktop users to publish dashboards to a central server to be shared across their organizations. The product is designed to facilitate collaboration across the organization. It can be deployed on a server in the data center, or it can be deployed on a public cloud.
$12
Per User Per Month
Pricing
Rational BI
Tableau Server
Editions & Modules
Free
$0
single user
Professional
$129
single user
Enterprise
Varies
single user
Viewer
$12.00
Per User Per Month
Explorer
$35.00
Per User Per Month
Creator
$70.00
Per User Per Month
Offerings
Pricing Offerings
Rational BI
Tableau Server
Free Trial
Yes
Yes
Free/Freemium Version
Yes
No
Premium Consulting/Integration Services
No
No
Entry-level Setup Fee
Optional
No setup fee
Additional Details
Additional cost per extra user (varies by edition)
—
More Pricing Information
Community Pulse
Rational BI
Tableau Server
Considered Both Products
Rational BI
Verified User
Anonymous
Chose Rational BI
Rational BI allows a deeper data analysis with respect to the other software I experimented with. The velocity to perform the analysis is similar to the other one. The predictive analysis could be very useful, but at the moment I do not use it in my activities. Dashboards are …
Rational BI offers richer data visualization components when compared to other BI products. It is visualization options are much more broader and can be complimented by on JavaScript graphic libraries available on the web. It also offers high performance and faster page load …
Today there are many companies providing BI solutions, and generally, I think Microsoft Power BI is the easiest go-to solution as it is part of the Office365 software. However all software solutions have their limitations, advantages, and disadvantages, but sometimes you don't …
Solutions Architect - Infrastructure Solutions Group
Chose Rational BI
Rational BI is one of the leading business intelligence software products. Ease of use is imperative when bringing on a new software product, you want your folks to have a very low learning curve. The rationale is pretty easy right out of the box, I like the fact that …
Looker and Tableau are quite similar products. I think Tableau's ability to view data visually is more comprehensive. The different breakdowns in UTM level versus first touch and last touch are shown in a visual format, making it much easier to view and interpret the results. …
Tableau Server can handle a large datasets without any lagging the data or slow updating the data, easily can use all the functions and formulas by using data up-to thousands of entry and easily can present in table, charts and dashboards formats and main thing to store and …
Seemed to be the industry standard with a lot of support. The problem is their own support suck so much that if you use them you can only pray nothing will ever go wrong.
Tableau Server is extremely well suited for a company with a few dedicated analysts creating dashboards and reports for a few stakeholders. It is also great at handling a large number of report viewers, but it is more expensive because you have to pay for each user. We have …
Tableau Server is a world-class product offering ease of integration with a database or third-party service platforms such as SalesForce, Intercom, or Hubspot. Data visualisation and chart capability is excellent. Tableau really helps an organisation connect with its data to …
Tableau server has among the best visualization compared to other similar products. It is in some cases much easier to use when the data is nicely arranged in the required format. It also has a good drill down capability which helps us expand and look for variances and other …
Today, if my shop is largely Microsoft-centric, I would be hard pressed to choose a product other than Power BI. Tableau was the visualization leader for years, but Microsoft has caught up with them in many areas, and surpassed them in some. Its ability to source, transform, …
We selected Tableau Server over other options because of the published feature set and capabilities. It appeared to be far more advanced than its competition. However, it failed to meet expectations. Moving forward we are going to give a more serious look at Google Data Studio …
We used and still are using IBM Cognos for business intelligence purposes. It is good for use as a data infrastructure and analytic framework, rather than a BI toolkit, but Tableau is replacing Cognos fast. We used d3.js for a few proofs of concept visualization and …
Compared to our previous version of software and tool that had been used since the beginning of the company, Tableau is reliable, fast and accurate. Some important features for advanced analytics and data visualization are not available with the previous system. Therefore it …
The choice to use Tableau Server is really made for you if you already have adopted Tableau Desktop. If you're focused on an on-premise solution, Tableau is probably the way that you'll have to go. Looker and Mode are cloud-based (so is Tableau Online) and offer a true …
We find Tableau Server much more flexible and powerful for the developer. The resulting dashboard and interactive charts far surpass those of Business Objects. IBM Cognos is much too restrictive in its ability to present data visualizations in a way that is easily integrated …
There were a lot of reasons why we chose Tableau and the least is the cost but also the way Tableau stores data in the columnar fashion instead of in Cubes. We went through a painstaking selection process and at the end, came down to a couple of vendors and we ended up with the …
We still use Microsoft Excel for much of the lighter, day-to-day pivot tables or calculations. We see Tableau as the future however and are slowly tying more and more of our standard work with Tableau. Smartsheet isn't a 1:1 example, but it was considered for importing …
Tableau is a stable and time tested product which can handle hundreds and thousands of users and a huge amount of content, plus tableau has also introduced a web authoring tool which you can [use to] edit dashboards using your browser.
I did not choose Tableau for my organization, but did choose my organization in part because they use Tableau! Fantastic flexibility combined with relative ease of visualization.
Because our big data project team wants to show highly customized visualization for their complex data and analyzed results, only Tableau Desktop can support this target. After we developed many, many dashboards and other views, we wanted to share it with different users. We …
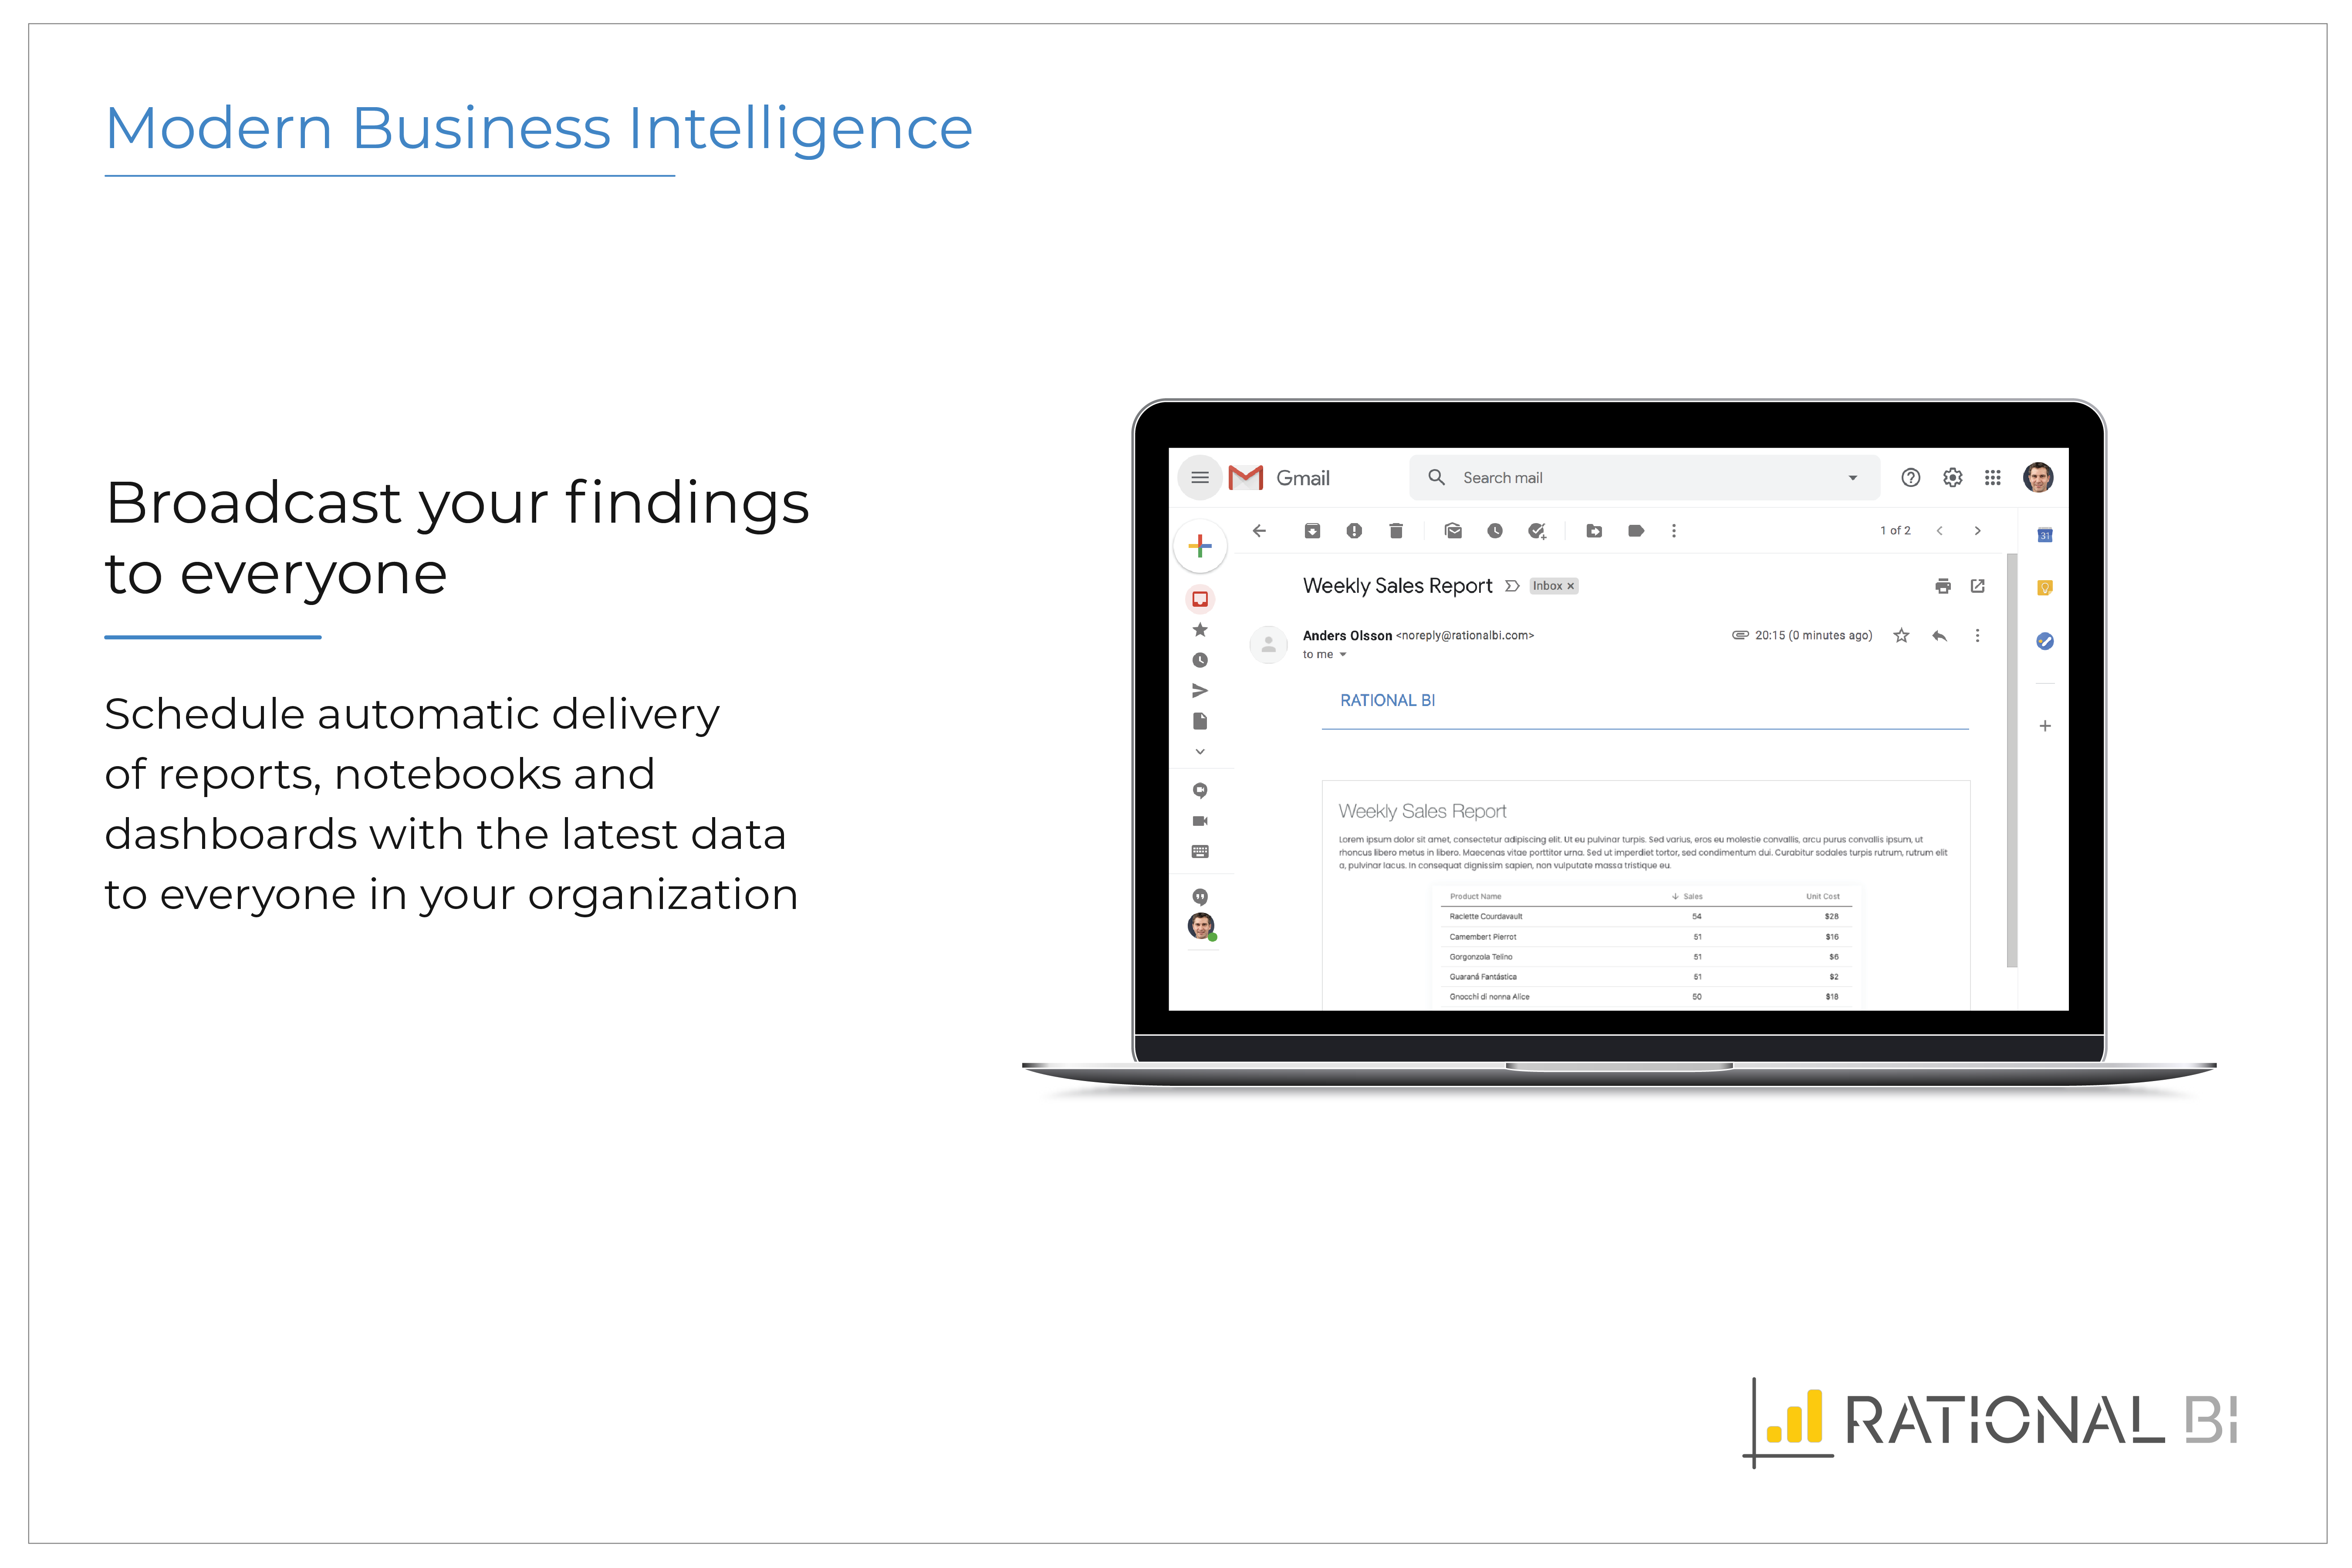
Rational BI allows managing data analysis coming from different projects in order to create useful reports and dashboards. I usually set up automatically scheduled reports. All the stakeholders can easily share a rational view with the possibility to filter between the interesting arguments. Sometimes different user profiles could be needed, optimize the view.
Tableau Server is well suited for a data warehouse build and handling big data. Tableau data aggregation, transformation, clustering capability is powerful and easy to implement. The choice of charts and visualisation tools is outstanding. Customisation and dynamic data visualisation capability is superb. The user interface takes some time getting used to.
It's good at doing what it is designed for: accessing visualizations without having to download and open a workbook in Tableau Desktop. The latter would be a very inefficient method for sharing our metrics, so I am glad that we have Tableau Server to serve this function.
Publishing to Tableau Server is quick and easy. Just a few clicks from Tableau Desktop and a few seconds of publishing through an average speed network, and the new visualizations are live!
Seeing details on who has viewed the visualization and when. This is something particularly useful to me for trying to drive adoption of some new pages, so I really appreciate the granularity provided in Tableau Server
Documentation for new users could be better. Sometimes it's hard for my users that are not that skilled in IS/IT to set up data connectors are understand the dynamics of data sources.
I have used several other BI solutions as well, and their GUI is okay, but surely there is also room for improvement here. Not all things are made entirely logically.
Understanding their price structure. Generally, their website looks nice, but it's not very informative when it comes to pricing, and support options. I really miss some kind of transparency and overview.
While it took little time for our data analysts to crank out visualizations, it did take some time(longer than I expected) for our technology operations team to configure the server to share the sizes.
The server update process is rather cumbersome -- requires a full uninstall/re-install.
Again, while it took our data analysts next to no time to start creating, I've been in other organizations that have struggled with the feature-rich interface and complexity of the Tableau client. So, it requires the right personnel, with dedicated time, to fully leverage the tool.
It simply is used all the time by more and more people. Migrating to something else would involve lots of work and lots of training. The renewal fee being fair, it simply isn't worth migrating to a different tool for now.
Rational BI allows managing data analysis coming from different projects. The outputs are one or more reports, that can be delivered automatically to the stakeholders or other communication media inside the organization. Nice dashboards help to describe and analyze data. Sometimes different user profiles could be needed, optimize the view.
User experience is the most important factor to consider whenever considering capabilities for non-technical business users. If the learning curve is so steep business users must be advanced users to be productive, you hit the wall of diminishing returns, this is exceptionally true when it comes to analyzing data. Transforming data analysts into BI development experts shifts the focus of the analyst from analyzing data to mastering software. Tableau does a masterful job at minimizing the technology and maximizing the users understanding of their data.
Our instance of Tableau Server was hosted on premises (I believe all instances are) so if there were any outages it was normally due to scheduled maintenance on our end. If the Tableau server ever went down, a quick restart solved most issues
While there are definitely cases where a user can do things that will make a particular worksheet or dashboard run slowly, overall the performance is extremely fast. The user experience of exploratory analysis particularly shines, there's nothing out there with the polish of Tableau.
I think the folks that work in support are generally pretty good at what they do (when you get them on a WebEx). But the process of reporting issues to them and waiting for a response (via email only) is a hassle. I never understood why you can't just call them up and discuss the issues with them. It would take a handful of email exchanges before they would agree to a WebEx session. That was frustrating.
In our case, they hired a private third party consultant to train our dept. It was extremely boring and felt like it dragged on. Everything I learned was self taught so I was not really paying attention. But I do think that you can easily spend a week on the tool and go over every nook and cranny. We only had the consultant in for a day or two.
The sales consultants do an amazing job of introducing the tool and its capabilities. They are also helpful in explaining the layout of the desktop client and its different functionality. Keep in mind that they use a sample data source (MS Excel) with a very small amount of data to show off what it can do. What you have to remember is that you are buying the tool so that you can connect to large amounts of data (and possibly blend data together from different databases).
Implementation was over the phone with the vendor, and did not go particularly well. Again, think this was our fault as our integration and IT oversight was poor, and we made errors. Would they have happened had a vendor been onsite? Not sure, probably not, but we probably wouldn't have paid for that either
Today there are many companies providing BI solutions, and generally, I think Microsoft Power BI is the easiest go-to solution as it is part of the Office365 software. However all software solutions have their limitations, advantages, and disadvantages, but sometimes you don't need the perfect solution. You just need a solution that delivers 80-90 percent of the full potential to reach your goal and in this scope, we were really happy with Rational BI.
Looker and Tableau are quite similar products. I think Tableau's ability to view data visually is more comprehensive. The different breakdowns in UTM level versus first touch and last touch are shown in a visual format, making it much easier to view and interpret the results. Tableau also has faster load times compared to Looker for larger datasets.