SAP Crystal is an analytics and reporting software solution for SMBs. SAP Crystal comprises Crystal Reports for pixel-perfect reporting, and SAP Crystal Server for automated distribution and self-service access to reports, dashboards and data exploration.
$295
per single user license
Spotfire
Score 8.2 out of 10
N/A
Spotfire, formerly known as TIBCO Spotfire, is a visual data science platform that combines visual analytics, data science, and data wrangling, so users can analyze data at-rest and at-scale to solve complex industry-specific problems.
N/A
Pricing
SAP Crystal
Spotfire
Editions & Modules
Upgrade Version to SAP Crystal Reports 2020
$295
per single user license
SAP Crystal Reports 2020 64-Bit
$495
per single user license
SAP Crystal Reports 2016 32-Bit
$495
per single user license
SAP Crystal Server 2020 1 NUL
$869
per user license + first year maintenance to be added
SAP Crystal Server 2020 5 CAL
$8,744
5 concurrent users + first year maintenance to be added
No answers on this topic
Offerings
Pricing Offerings
SAP Crystal
Spotfire
Free Trial
Yes
Yes
Free/Freemium Version
Yes
No
Premium Consulting/Integration Services
Yes
Yes
Entry-level Setup Fee
Optional
No setup fee
Additional Details
* SAP Crystal Reports 2020 Viewer allows you to view static data within a SAP Crystal Reports file.
* SAP Crystal Reports 2020 - Full version allows you to create powerful, richly formatted, and dynamic reports from virtually any data source, delivered in dozens of formats, in up to 28 languages. If you already have an older version of Crystal Reports, buy a license for SAP Crystal Reports 2020 - Upgrade at a discounted, upgrade price.
* SAP Crystal Server 2020, 1 NUL includes 1 license of: SAP Crystal Reports 2020 - SAP Crystal Server 2020.
* As an add-on to SAP Crystal Server 2020 1 NUL, SAP Crystal Server 2020 5 CAL allows you to support a wider, intermittent audience of end users, up to five logged on at the same time.
For Enterprise engagements, contact Spotfire directly for a custom price quote.
We've had SAP Crystal for about ten years at this point. We've never really evaluated any alternatives since, as of today, well over 400 reports are being generated in the system, and we've yet to consider switching to a competing product.
The user interface within Spotfire was more easily followed by new users than other products such as Tableau. The recommended visualizations that is provided when you first log in was definitely a huge selling point for our department. This helped to move through creating a …
We evaluated on Mobility, Dashboarding, Web Based User Interface and Analytical capability. At the forefront was the user experience which accounted for just over half of our evaluation criteria. No platform was a 10/10 in all four categories - SAS Visual Analytics excelled in …
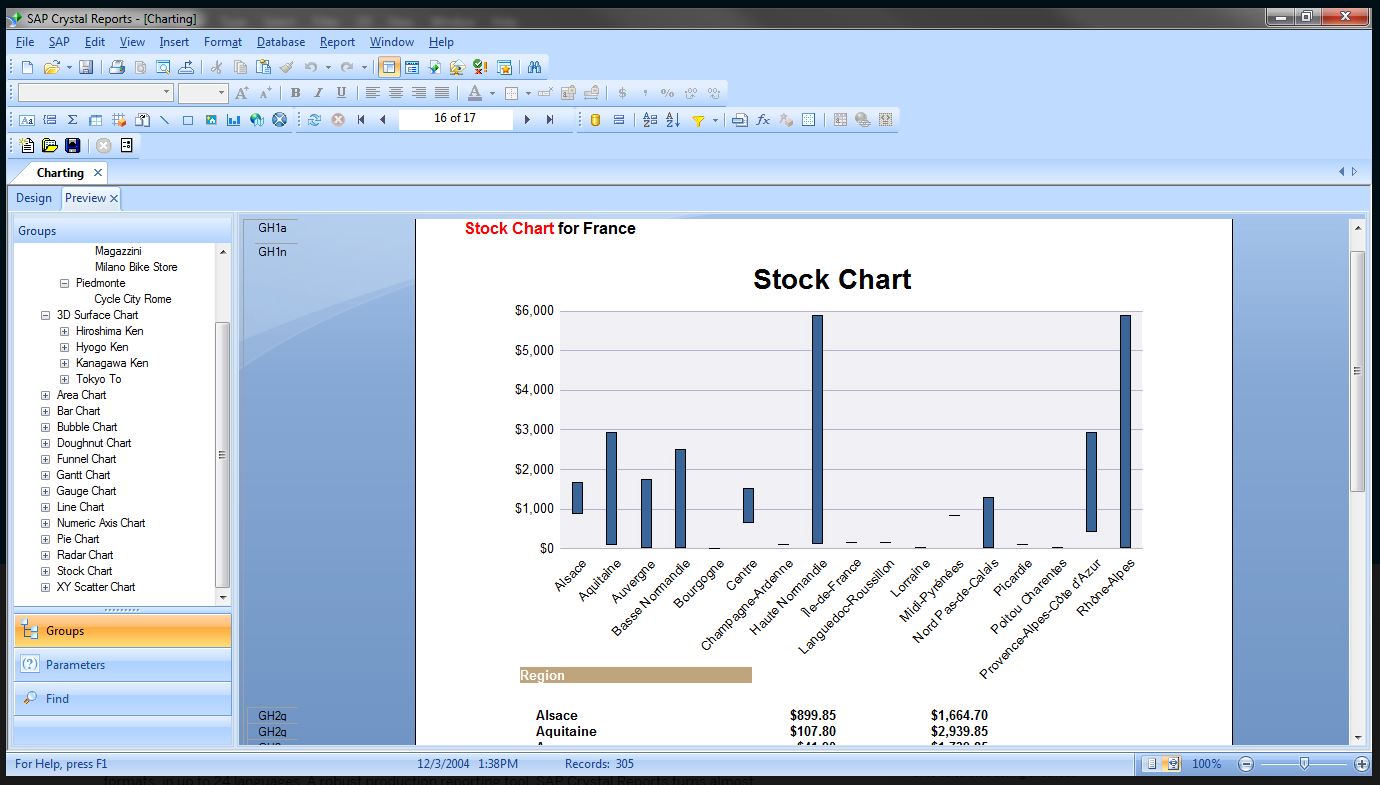
Generation of templated reports is the strong suit of SAP Crystal. Allows users to change formats in templates bases on requirement with minimal effort. Automated report delivery requires the user to be aware of sql which cannot be expected from all users. Should support more document export formats and improve the UI for SAP B1 Users
A high level of data integration is available here it supports various data sources and so on. Collaborating features allow users to give access to the dashboard and merge data analytics with other team members. It can meet the demands of both small and large size business enterprises. A customized dashboard and reports are provided to meet the specific needs and get support of extensibility through APIs and customized scripts.
Crystal Reports allows us to create a consistent template for all of our reports.
Crystal Reports and Server allows us to house a repository for all of our reports to make them easy to find and update when necessary.
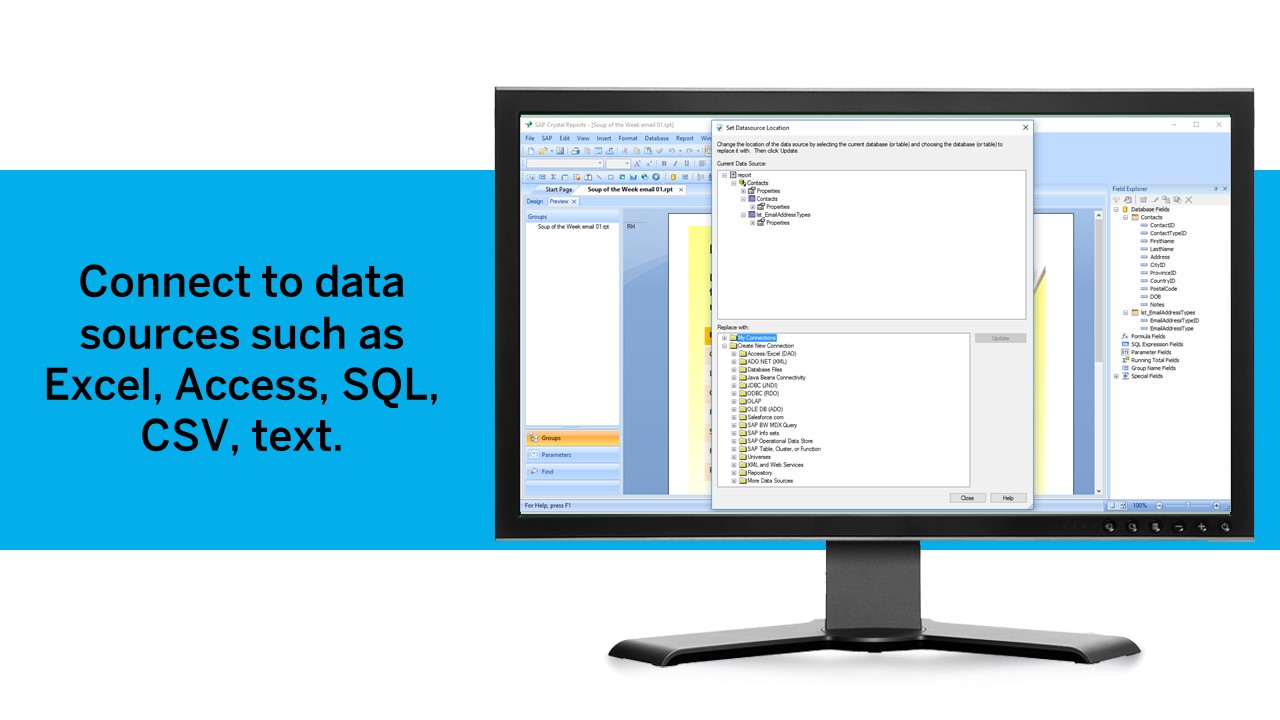
Crystal Reports can connect to a wide variety of data sources.
Crystal Reports can be a little daunting when first implementing. There are a lot of nuances in learning how to truly master this software and it can be frustrating at times.
The donut chart is I guess a powerful illustrations but I hope it should be done quite simple in Spotfire. But in Spotfire there are lots of steps involve just to build a simple donut chart.
Table calculation (like Row or Column Differences) should be made simple or there should be drag and drop function for Table Calculation. No need for scripting.
Information Link should be changed. If new columns are added to the table just refreshing the data should be able to capture the new column. No need extra step to add column
We have been using this product for so many years and it has truly become a cornerstone to our business processes when it comes to developing and distributing information via reports. We currently have over 500 reports developed to date over about 30 systems and that will continue to grow as user needs change.
-Easy to distribute information throughout the enterprise using the webplayer. -Ad hoc analysis is possible throughout the enterprise using business author in the webplayer or the thick client. -Low level of support needed by IT team. Access interfaces with LDAP and numerous other authentication methods. -Possible to continually extend the platform with JavaScript, R scripts, HTML, and custom extensions. -Ability to standardize data logic through pre-built queries in the Information Designer. Everyone in the enterprise is using the same logic -Tagging and bookmarking data allows for quick sharing of insights. -Integration with numerous data sources... flat files, data bases, big data, images, etc. -Much improved mapping capability. Also includes the ability to apply data points over any image.
Crystal is very robust, but not always easy to use. It create wonderful looking reports, and so deserves a high rating. However, I have to take a couple of points off for the simple fact that I cannot hand it to a user and expect them to be able to do development with it.
Basic tasks like generating meaningful information from large sets of raw data are very easy. The next step of linking to multiple live data sources and linking those tables and performing on the fly analysis of the imported data is understandably more difficult.
Even though, it's a rather stable and predictable tool that's also fast, it does have some bugs and inconsistencies that shut down the system. Depending on the details, it could happen as often as 2-3 times a week, especially during the development period.
Generally, the Spotfire client runs with very good performance. There are factors that could affect performance, but normally has to do with loading large analysis files from the library if the database is located some distance away and your global network is not optimal. Once you have your data table(s) loaded in the client application, usually the application is quite good performance-wise.
The support community can be difficult to navigate. I've also run into issues with my login. The SAP system has a bizarre mechanism for validating users that requires users to have what is called an S-ID. A basic ID may not give you access to all the features in the portal. The limitation may include not being able to perform a simple task like downloading patches and updates. This isn't a big deal for single user license but for teams it can be a pain.
Support has been helpful with issues. Support seems to know their product and its capabilities. It would also seem that they have a good sense of the context of the problem; where we are going with this issue and what we want the end outcome to be.
The instructor was very in depth and provided relevant training to business users on how to create visualizations. They showed us how to alter settings and filter views, and provided resources for future questions. However, the instructor failed to cover data sources, connecting to data, etc. While it was helpful to see how users can use the data to create reports, they failed to properly instruct us on how to get the dataset in to begin with. We are still trying to figure out connections to certain databases (we have multiple different types).
The online training is good, provides a good base of knowledge. The video demonstrations were well-done and easy to follow along. Provided exercises are good as well, but I think there could be more challenging exercises. The training has also gone up in price significantly in the last 3 years (in USD, which hurts us even more in Canada), and I'm not sure it is worth the money it now costs (it is worth how much it cost 3 years ago, but not double that.)
Just like any other implementation: When designing the differing reports, get end users' input, make sure to design the reports so that they display the information that the company requires, in the best and clearest way possible.
Test, test, test, revise when needed, and, particularly, do sufficient training so users are comfortable using Crystal Reports!
The original architecture I created for our implementation had only a particular set of internal business units in mind. Over the years, Spotfire gained in popularity in our company and was being utilized across many more business units. Soon, its usage went beyond what the original architectural implementation could provide. We've since learned about how the product is used by the different teams and are currently in the middle of rolling out a new architecture. I suggest:
Have clearly defined service level agreements with all the teams that will use Spotfire. Your business intelligence group might only need availability during normal working hours, but your production support group might need 24/7 availability. If these groups share one Spotfire server, maintenance of that server might be a problem.
Know the different types of data you will be working with. One group might be working with "public" data while another group might work with sensitive data. Design your Library accordingly and with the proper permissions.
Know the roles of the users of Spotfire. Will there only be a small set of report writers or does everyone have write access to the Library?
ALWAYS add a timestamp prompt to your reports. You don't want multiple users opening a report that will try and pull down millions of rows of data to their local workstations. Another option, of course, is to just hard code a time range in the backing database view (i.e. where activity_date >= sysdate - 90, etc.), but I'd rather educate/train the user base if possible.
This probably goes without saying, but if possible, point to a separate reporting database or a logical standby database. You don't want the company pounding on your primaries and take down your order system.
Crystal reports is useful in case we want to import data from data base . We can write queries in it but Google Charts require to be implemented in our application using code so crystal reports is better than Google Charts.
Spotfire is significantly ahead of both products from an ETL and data ingestion capability. Spotfire also has substantially better visualizations than Power BI, and although the native visualizations aren't as flexible in Tableau, Spotfire enables users to create completely custom javascript visaualizations, which neither Tableau or Power BI has. Tableau and Power BI are likely only superior to Spotfire with respect to embedded analysis on a website.
In an enterprise architecture, if Spotfire Advanced Data services(Composite Studio),data marts can be managed optimally and scalability in a data perspective is great. As the web player/consumer is directly proportional to RAM, if the enterprise can handle RAM requirement accomodating fail over mechanisms appropraitely, it is definitely scalable,
It is a decent buy for specific departments in terms of reporting capabilities but updates and cost (frequent) demands are higher with the benefits offered.
So long as the requirements are not ever changing, with scheduling functionality, it's a handsome tool.