Overview
ProductRatingMost Used ByProduct SummaryStarting Price
Datadog
Score 8.8 out of 10
N/A
Datadog is a monitoring service for IT, Dev and Ops teams who write and run applications at scale, and want to turn the massive amounts of data produced by their apps, tools and services into actionable insight.
$18
per month per host
Retrace (legacy)
Score 8.0 out of 10
N/A
Stackify Retrace provides application performance management across the entire stack. Coupled with aggregated logs from common logging frameworks, find every exception in code. Retrace code with lightweight code profiling and track and monitor all key application and server metrics. The vendor states that with coverage for full lifecycle development, the Stackify Retrace software offering is tailored to be inclusive for multiple role types, and presents everything your team needs to know about…
$99
up to 3 servers, 500,000 traces, and 1,000,000 logs
Pricing
DatadogRetrace (legacy)
Editions & Modules
Log Management
$1.27
per month (billed annually) per host
Infrastructure
$15.00
per month (billed annually) per host
Standard
$18
per month per host
Enterprise
$27
per month per host
DevSecOps Pro
$27
per month per host
APM
$31.00
per month (billed annually) per host
DevSecOps Enterprise
$41
per month per host
Essentials
$99
up to 3 servers, 500,000 traces, and 1,000,000 logs
Standard
249+
2,000,000+ traces and 5,000,000+ logs
Enterprise
Custom
Customer number of traces and logs
Offerings
Pricing Offerings
DatadogRetrace (legacy)
Free Trial
YesYes
Free/Freemium Version
YesNo
Premium Consulting/Integration Services
NoNo
Entry-level Setup FeeOptionalNo setup fee
Additional DetailsDiscount available for annual pricing. Multi-Year/Volume discounts available (500+ hosts/mo).Pricing is based on trace and log usage.
More Pricing Information
Community Pulse
DatadogRetrace (legacy)
Features
DatadogRetrace (legacy)
Monitoring Tasks
Comparison of Monitoring Tasks features of Product A and Product B
Datadog
7.9
2 Ratings
7% below category average
Retrace (legacy)
-
Ratings
Remote monitoring8.22 Ratings00 Ratings
Network device monitoring7.72 Ratings00 Ratings
Multiple Server Monitoring7.72 Ratings00 Ratings
Multi-device monitoring7.72 Ratings00 Ratings
Automated alerts and notifications8.22 Ratings00 Ratings
Management Tasks
Comparison of Management Tasks features of Product A and Product B
Datadog
6.1
1 Ratings
12% below category average
Retrace (legacy)
-
Ratings
Patch Management7.31 Ratings00 Ratings
Service configuration management6.41 Ratings00 Ratings
Software and hardware inventory5.51 Ratings00 Ratings
Policy-based automation5.51 Ratings00 Ratings
Reporting
Comparison of Reporting features of Product A and Product B
Datadog
8.2
2 Ratings
3% above category average
Retrace (legacy)
-
Ratings
Performance data reports8.22 Ratings00 Ratings
Customizable reporting7.72 Ratings00 Ratings
Data visualization8.62 Ratings00 Ratings
Risk analysis8.22 Ratings00 Ratings
Security
Comparison of Security features of Product A and Product B
Datadog
6.7
1 Ratings
9% below category average
Retrace (legacy)
-
Ratings
Data backup and recovery6.41 Ratings00 Ratings
Antivirus and malware management7.31 Ratings00 Ratings
Administrator access control6.41 Ratings00 Ratings
Application Performance Management
Comparison of Application Performance Management features of Product A and Product B
Datadog
-
Ratings
Retrace (legacy)
6.4
1 Ratings
20% below category average
Application monitoring00 Ratings7.01 Ratings
Database monitoring00 Ratings6.01 Ratings
Out-of-the box templates to monitor applications00 Ratings6.01 Ratings
Application dependency mapping and thresholding00 Ratings7.01 Ratings
Server availability and performance monitoring00 Ratings6.01 Ratings
Best Alternatives
DatadogRetrace (legacy)
Small Businesses
Amazon CloudWatch
Amazon CloudWatch
Score 7.6 out of 10
GitLab
GitLab
Score 8.9 out of 10
Medium-sized Companies
ManageEngine Site24x7
Score 10.0 out of 10
ManageEngine Site24x7
Score 10.0 out of 10
Enterprises
ManageEngine Site24x7
Score 10.0 out of 10
ManageEngine Site24x7
Score 10.0 out of 10
All AlternativesView all alternativesView all alternatives
User Ratings
DatadogRetrace (legacy)
Likelihood to Recommend
8.9
(65 ratings)
8.0
(2 ratings)
Likelihood to Renew
4.3
(2 ratings)
-
(0 ratings)
Usability
8.7
(44 ratings)
-
(0 ratings)
Support Rating
5.0
(7 ratings)
-
(0 ratings)
Implementation Rating
1.0
(1 ratings)
-
(0 ratings)
User Testimonials
DatadogRetrace (legacy)
Likelihood to Recommend
Datadog
If I want to see what customers are doing wrong in their sessions, we can do that easily. On the other hand, if we want to know the payload in the API calls, that is the area where Datadog can improve.
Read full review
Discontinued Products
If I need to change a logo design on the invoice, the new logo is slightly larger or smaller so the type below the logo is in a different area than before. In this case, you would need to load the new version of the document into APM Plus and redo the mapping of the field areas to properly grab the information needed to process the document. Without doing this, the document could fail or go to the wrong archive based on the fields.
Read full review
Pros
Datadog
  • The thing which Datadog does really well, one of them are its broad range of services integrations and features which makes it one step observability solution for all. We can monitor all types of our application, infrastructure, hosts, databases etc with Datadog.
  • Its custom dashboard feature which helps us to visualize the data in a better way . It supports different types of charts through those charts we can create our dashboard more attractive.
  • Its AI powered alerting capability though that we can easily identify the root cause and also it has a low noise alerting capability which means it correlated the similar type of issues.
Read full review
Discontinued Products
  • Integration of performance management with log management so you get the parameters sent
  • In-line log and error data in trace
  • Integration of error and log data, so in one click you can see all the logs recorded when an error was thrown
  • Very reasonably priced
Read full review
Cons
Datadog
  • In my experience, .NET Tracing Agent caused severe and untraceable performance issues
  • In my opinion, usage and billing structures were opaque and surprising
  • In my experience, documentation was incomplete, contradicting or sometimes completely wrong, even for common infrastructure (AWS Fargate)
  • I feel support was unhelpful at times, and bounced us back and forth to other teams
  • In my opinion, multiple methods of sample rate control were ineffective, adding to excessive usage and cost
Read full review
Discontinued Products
  • To set up the fields that APM Plus monitors, you need to map each field area on each document.
  • APM Plus could use a way to link the documents back into the finance or business software so you can find the document under the PO, Sales Order, Invoice, etc.
  • APM Plus setup is only for the professionals. There are many areas that need tweaking on setup, having a better default setup would lessen the learning curve to set it up for use.
Read full review
Likelihood to Renew
Datadog
Its a one stop solution for most processes and does reduce cost overall. This does in turn help teams communicate in a much more efficient way, also RUM is a game changer for any quality product; we use RUM alot for debugging and reverse engineering issues. Reports and coverage has been a plus, it all has helped us a lot in our processes.
Read full review
Discontinued Products
No answers on this topic
Usability
Datadog
There are so many features that it can be hard to figure out where you need to go for your own use case. For example, RUM monitoring us buried in a "Digital Experience" sidebar setting when this is one of our key use cases that I sometimes struggle to find in the application. It appears that ECS + Fargate monitoring was recently released which is great because we had to build a lambda reporting solution for ephemeral task monitoring. But this new feature was never on my radar until I starting clicking around the application.
Read full review
Discontinued Products
No answers on this topic
Support Rating
Datadog
The support team usually gets it right. We did have a rather complicate issue setting up monitoring on a domain controller. However, they are usually responsive and helpful over chat. The downside would be I don’t think they have any phone support. If that is important to you this might not be a good fit.
Read full review
Discontinued Products
No answers on this topic
Implementation Rating
Datadog
Documentation was difficult to work through, rollout was catastrophic (completely outage)
Read full review
Discontinued Products
No answers on this topic
Alternatives Considered
Datadog
In terms of usability, I’ve found Datadog significantly more approachable and powerful compared to Elasticsearch, especially for day-to-day operational monitoring. Datadog offers a much more cohesive, user-friendly interface out of the box, with built-in support for metrics, logs, tracing, alerting, and dashboards—all tightly integrated. In contrast, Elasticsearch often felt barebones and required considerable setup and additional tooling (like Kibana or Logstash) to reach the same level of functionality.
While Elasticsearch is excellent for high-volume log ingestion and full-text search, it lacks the depth of features and real-time visualization capabilities that Datadog provides natively. The query language in Datadog is also quite usable and comparable for my needs—mainly filtering and aggregating logs and metrics—without needing to learn Elasticsearch's more complex DSL. Overall, Datadog saves our team time and effort, whereas Elasticsearch often felt like building a monitoring system from scratch. The all-in-one nature of Datadog, despite its complexity, is ultimately more efficient and scalable for our use case.
Read full review
Discontinued Products
It is a very impressive tool which doesn't overwhelm you with unnecessary data. They have combination of tools that haven't seen by any other company which makes it a very powerful tool
Read full review
Return on Investment
Datadog
  • Saved us (time & money) from developing our own monitoring utilities that would pale in comparison
  • Alerts allow us to remedy issues before our customers even know about them
  • Tracking resource usage over time allows us to better plan for future needs, before it becomes a pain-point.
Read full review
Discontinued Products
  • APM Plus has freed up users from having to manually attach documents to each place they are sending it. APM Plus will do it automatically.
  • APM Plus provides a searchable archive to re-visit sent documents with customers and vendors. Having to reprint a document you risk the potential that something has changed since it was last printed.
  • APM Plus does need IT staff for adjustments and to review sending problems. Not for an average user.
Read full review
ScreenShots

Datadog Screenshots

Screenshot of the out-of-the-box and customizable monitoring dashboards.Screenshot of Datadog's collaboration features, where users can discuss issues in-context with production data, annotate changes and notify their teams, see who responded to that alert before, and discover what was done to fix it.Screenshot of where Datadog unifies traces, metrics, and logs—the three pillars of observability.Screenshot of some of Datadog's 400+ built-in integrations.Screenshot of Datadog's Service Map, which decomposes an application into all its component services and draws the observed dependencies between these services in real timeScreenshot of centralized log data, pulled from any source.

Retrace (legacy) Screenshots

Screenshot of Detailed stack trace with inline error and logsScreenshot of Web Apps Dashboard:
The Apps Page gives you a high-level overview of all applications found and monitored across all servers in each environment. Click on any app to take you to the App Dashboard to view more information for a particular app.Screenshot of Apps Dashboard:
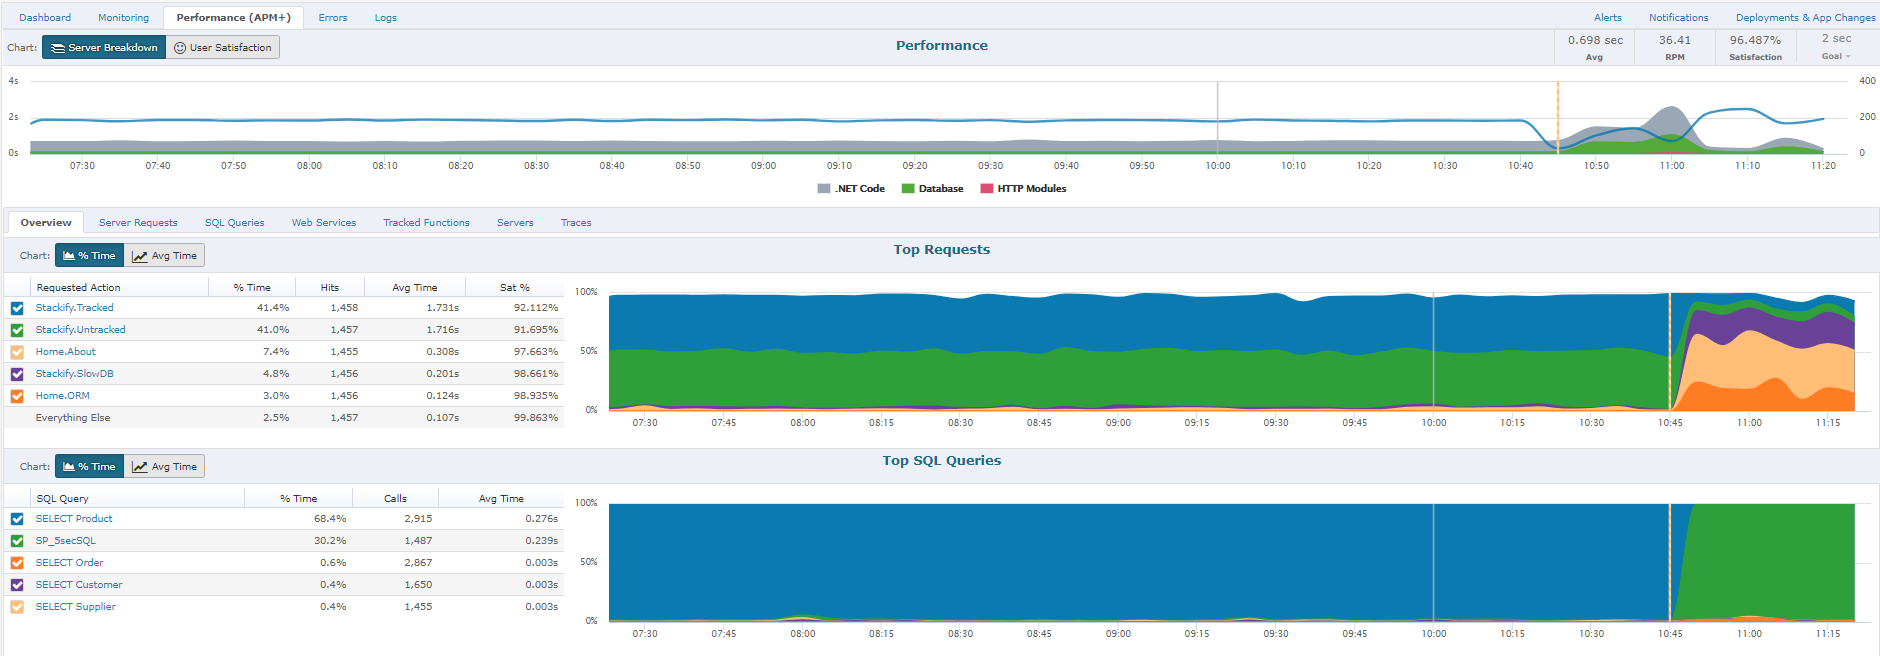
The App Dashboard is a powerful monitoring and troubleshooting perspective that gives you a view of application health across one or more environments.Screenshot of Performance (APM+) Dashboard:
The Performance section will give you a report of how well the application is performing overall, as perceived by your users.  A graph will allow you to view all requests by Satisfaction by viewing "Fast", "Sluggish", "Too Slow", or "Failed" types of requests.  Another report includes graphs of HTTP Error%, Satisfaction Score%, and Page Load Time.  Lastly, you will have the ability to sort each page request of your App by different categories: Satisfaction, Slowest page, Failed pages, pages hit, and total load time.  By clicking on an individual page a Performance Details page with further information about that specific page's health, performance, and errors will be displayed.Screenshot of Performance Traces:
One of the ways we strive to deliver relevant insights is to only collect traces around interesting requests. Some examples of these request types that are interesting would be faster than normal, slower than normal, new web requests, requests introducing new SQL, requests introducing new exceptions, or abnormal satisfaction scores. Under performing requests will be profiled more often than fast requests. As long as the app is getting steady traffic Retrace should be saving a trace every 5 to 15 minutes.Screenshot of Errors Dashboard:
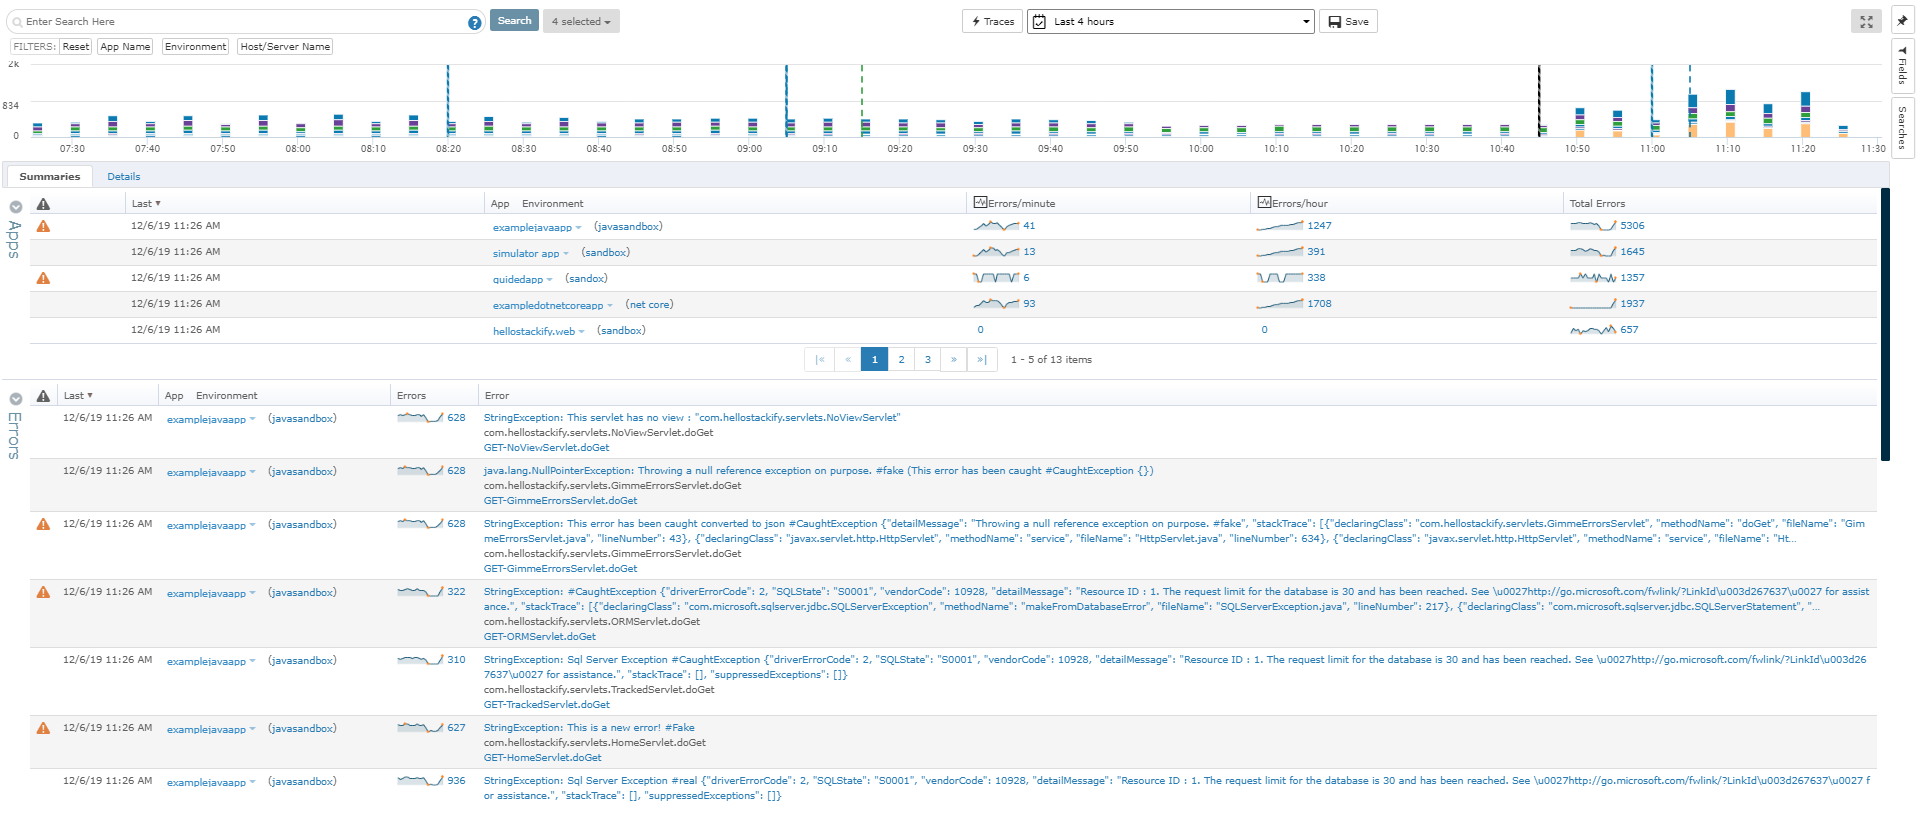
From the Errors Dashboard, you can get an overview of all the exceptions of all your applications across different environments. It gives you a central location to view details about your errors.