What is Data Point - Digital Balanced Scorecard Software?
LTS DataPoint is a digital Balanced Scorecard software designed to drive operational excellence across all levels of an organization. It provides a unified platform to track strategic goals, monitor KPI performance, and ensure alignment between strategy and execution. With built-in support for performance frameworks such as SQCDP, SQCPL, SQDCPS, ESQDCP, SQDCL, SQDCPSI, EQDCPS, SheQCPLDCPS, SQDCM, FCIL, and SQDC, Data Point enables standardized and data-driven performance management.
The solution also features digital huddle boards and Gemba Walk audit boards, empowering teams to collaborate, review performance, and drive continuous improvement in real time. By integrating strategy, operations, and analytics, LTS DataPoint helps organizations enhance transparency, streamline decision-making, and sustain a culture of continuous improvement and excellence across departments.
Categories & Use Cases
Media


1 / 18
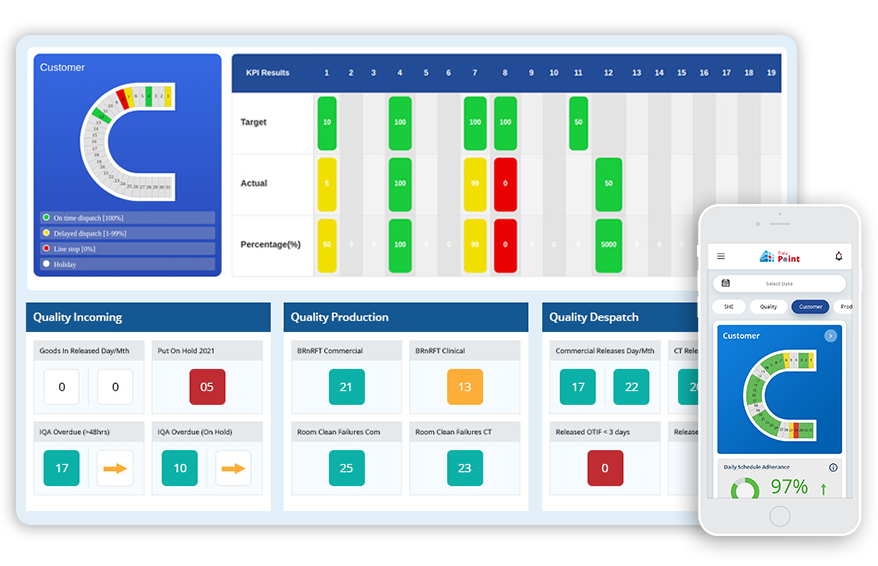
Screenshot of a view of Balanced Scorecard (BSC), a framework for organisational success.
