

NetCrunch
4 Reviews and Ratings
What is NetCrunch?
NetCrunch is commercial, self-hosted, agentless network and IT infrastructure monitoring software that runs on Windows Server. It monitors network devices, servers, virtualization platforms, cloud services, applications, websites, certificates, logs, traffic flows, and custom data using SNMP, WMI, SSH, REST APIs, scripts, and telemetry.
NetCrunch supports 680+ monitoring targets and includes 270+ ready-to-use Monitoring Packs for devices, applications, and operating systems. Monitoring Packs group predefined metrics, events, and alerting rules, while policy-based monitoring automatically applies monitoring settings, thresholds, alerts, and data collection rules to matching systems.
Distributed Monitoring Probes extend monitoring to remote and isolated sites and can continue collecting data during temporary connection loss. Network traffic analysis supports NetFlow, sFlow, IPFIX, and other flow technologies.
NetCrunch supports 40+ automated actions in response to alerts, such as running scripts, restarting services, killing processes, or rebooting devices. Alert noise is reduced through event correlation, dependency-aware suppression, filtering, delay rules, and escalation policies. Flexible escalation policies route alerts through email, SMS, and third-party integrations.
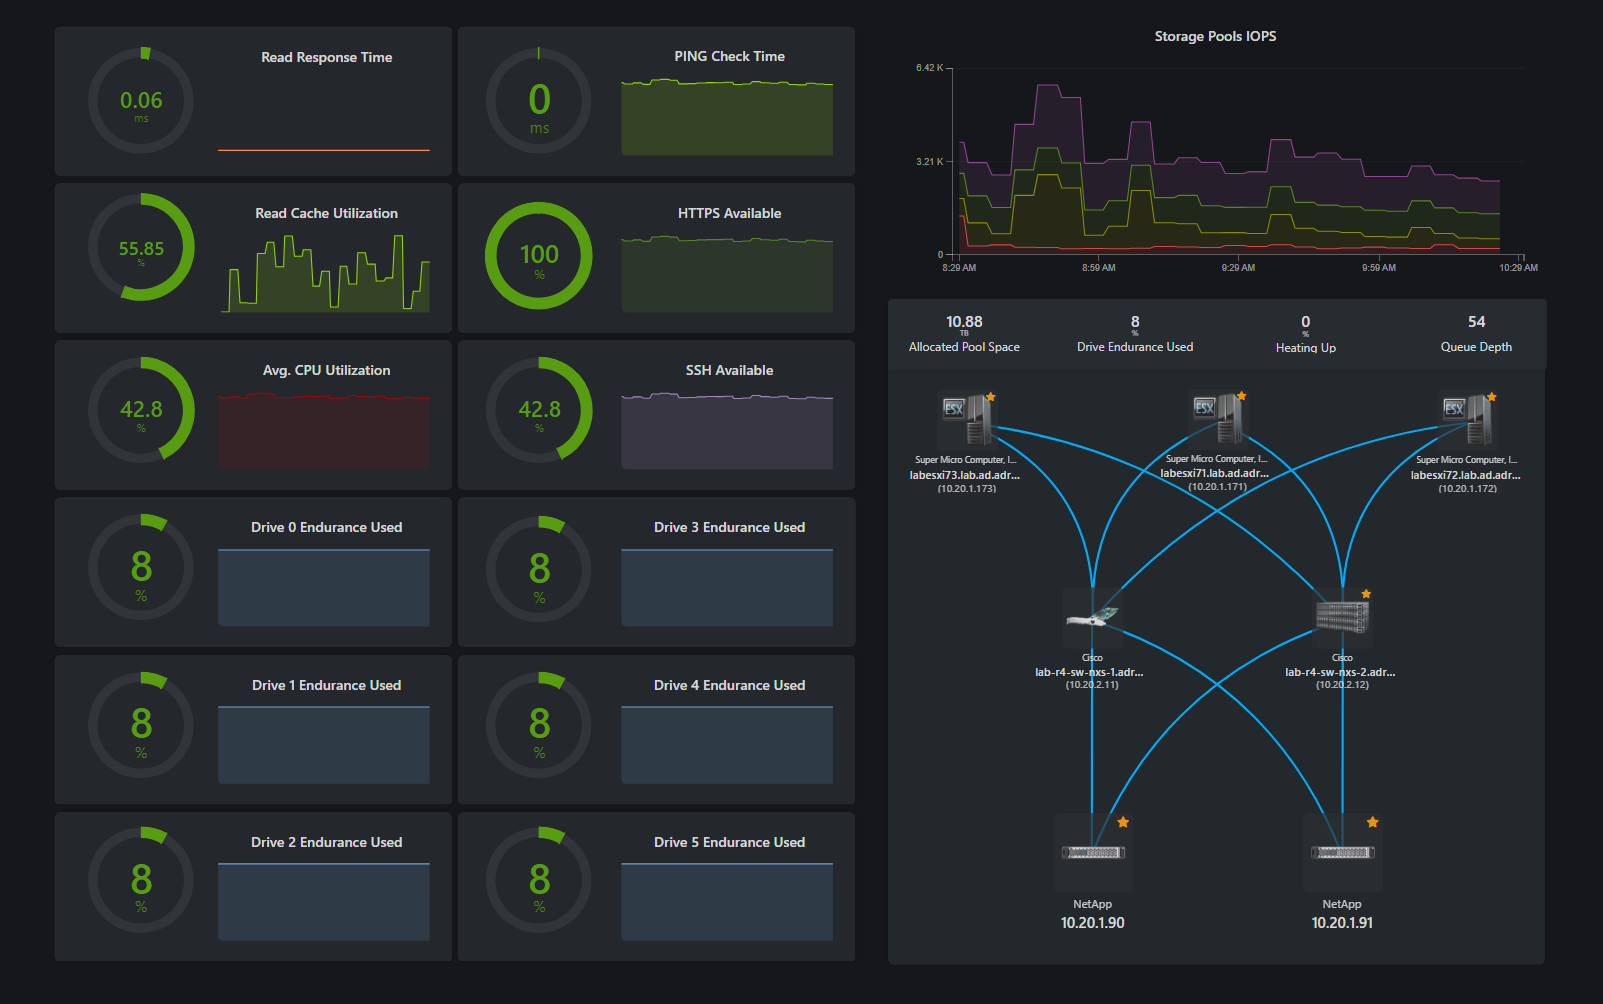
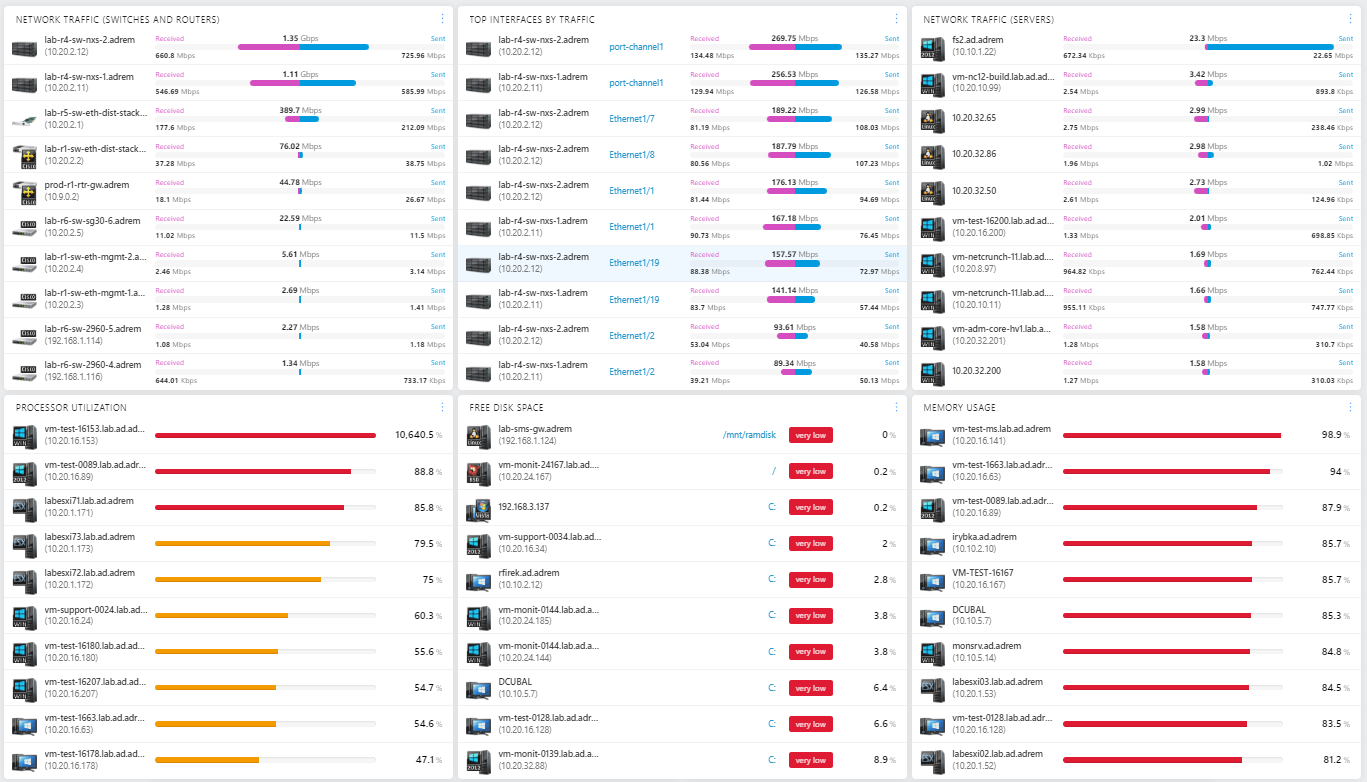
Live performance dashboards, dynamic status views, and automatic network topology maps provide real-time visibility into infrastructure health and relationships. Views update automatically as infrastructure, device states, and other monitored conditions change.
NetCrunch uses node- and interface-based licensing rather than licensing individual sensors, checks, or metrics. It is self-hosted on Windows Server and can monitor on-premises, cloud, and hybrid IT environments.
Categories & Use Cases
Media



1 / 8
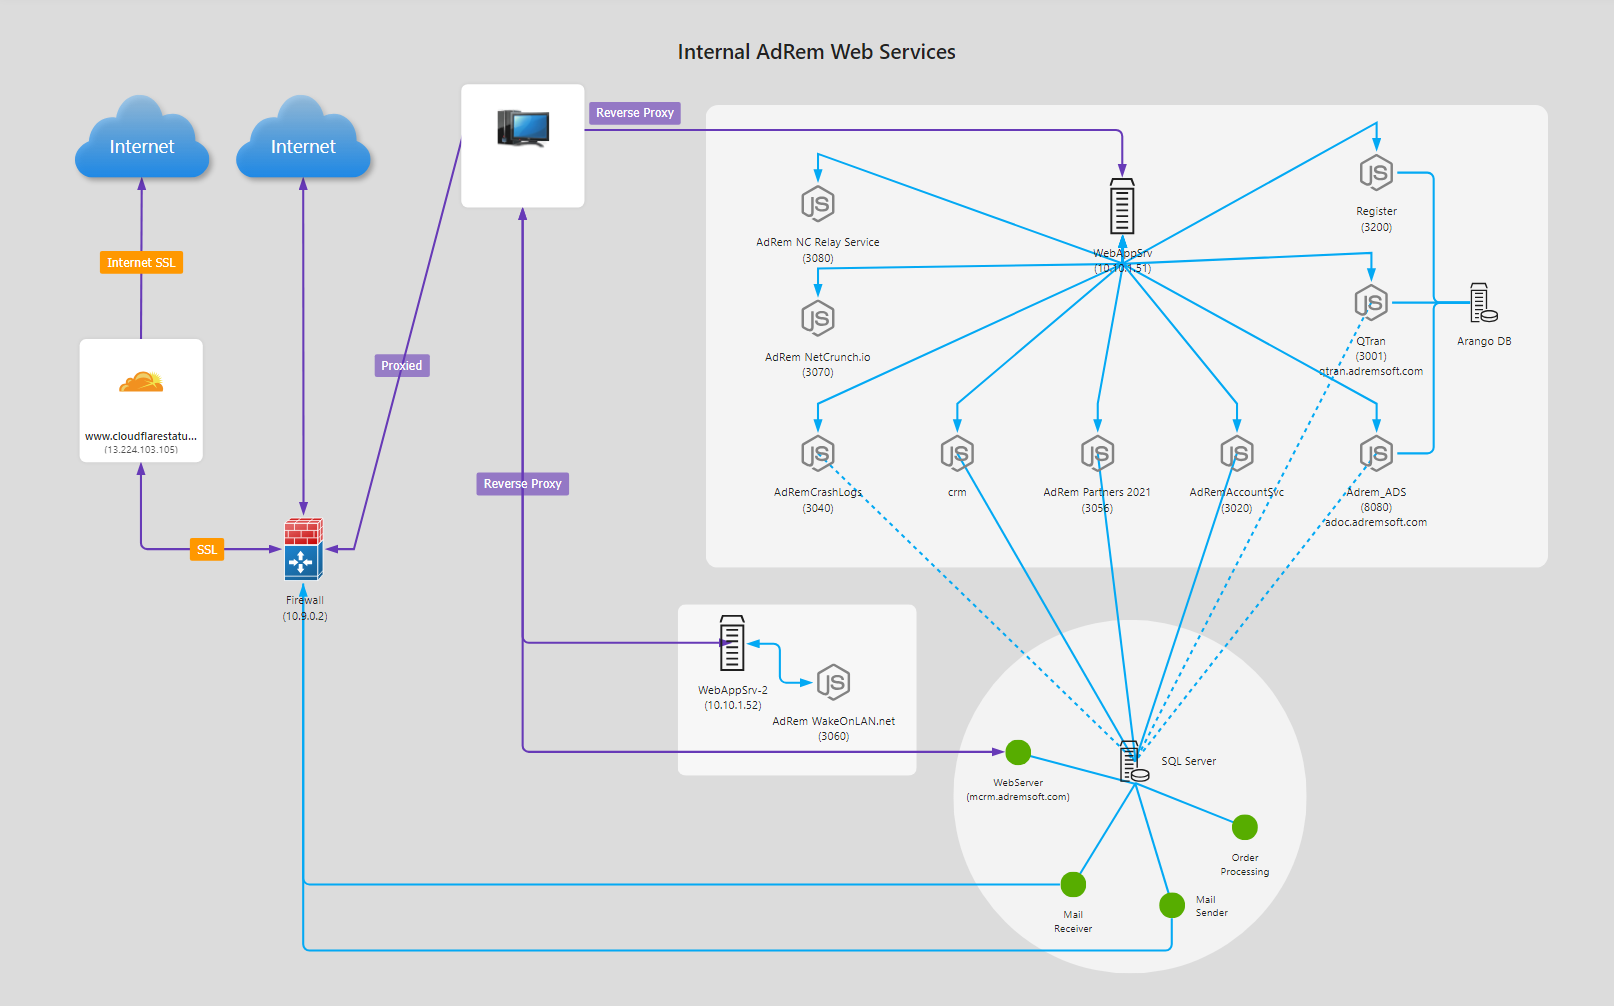
Screenshot of a network diagram with annotations


