Airbrake vs. Splunk Observability Cloud
Airbrake vs. Splunk Observability Cloud
| Product | Rating | Most Used By | Product Summary | Starting Price |
|---|---|---|---|---|
 Airbrake | N/A | Airbrake, now from LogicMonitor (acquired February 2021) is an error monitoring and performance insight tool. Airbrak offers real-time error alerts, rich contextual data about why errors are occurring, integration into an existing workflow, and application performance insights to enable users to identify, diagnose, and fix problems - before users get annoyed. | $0 per month | |
 Splunk Observability Cloud | N/A | Splunk Observability Cloud aims to enable operational agility and better customer experience through real-time AI-driven streaming analytics allowing accurate alerts in seconds. It is designed to shorten MTTD and MTTR by providing real-time visibility into cloud infrastructure and services. | $180 per year per host |
| Airbrake | Splunk Observability Cloud | |||||||||||||||
|---|---|---|---|---|---|---|---|---|---|---|---|---|---|---|---|---|
| Editions & Modules |
|
| ||||||||||||||
| Offerings |
| |||||||||||||||
| Entry-level Setup Fee | No setup fee | No setup fee | ||||||||||||||
| Additional Details | Airbrake offers plans that include up to 200M errors, plus unlimited on-demand errors. Start your free trial and find the plan that right for your needs. 10% discount available for annual pricing. | — | ||||||||||||||
| More Pricing Information | ||||||||||||||||
| Airbrake | Splunk Observability Cloud |
|---|
| Airbrake | Splunk Observability Cloud | |
|---|---|---|
| Small Businesses |  GitLab Score 8.7 out of 10 |  InfluxDB Score 8.8 out of 10 |
| Medium-sized Companies | GitLab Score 8.7 out of 10 |  Sumo Logic Score 8.8 out of 10 |
| Enterprises | GitLab Score 8.7 out of 10 |  NetBrain Technologies Score 9.2 out of 10 |
| All Alternatives | View all alternatives | View all alternatives |
| Airbrake | Splunk Observability Cloud | |
|---|---|---|
| Likelihood to Recommend | 7.9 (16 ratings) | 7.7 (57 ratings) |
| Likelihood to Renew | - (0 ratings) | 7.0 (2 ratings) |
| Usability | - (0 ratings) | 7.6 (16 ratings) |
| Support Rating | - (0 ratings) | 10.0 (1 ratings) |
| Implementation Rating | - (0 ratings) | 10.0 (1 ratings) |
| Airbrake | Splunk Observability Cloud | |
|---|---|---|
| Likelihood to Recommend | LogicMonitor
|  Cisco
|
| Pros | LogicMonitor
| Cisco
|
| Cons | LogicMonitor
 Tyler McWilliam Software Engineer | Cisco
|
| Likelihood to Renew | LogicMonitor No answers on this topic | Cisco
|
| Usability | LogicMonitor No answers on this topic | Cisco
|
| Support Rating | LogicMonitor No answers on this topic | Cisco
 Giuseppe Cusello GRC Director |
| Implementation Rating | LogicMonitor No answers on this topic | Cisco
Giuseppe Cusello GRC Director |
| Alternatives Considered | LogicMonitor | Cisco
 David Williams CIO (Chief Information Officer) |
| Return on Investment | LogicMonitor
| Cisco
|
| ScreenShots | Airbrake Screenshots   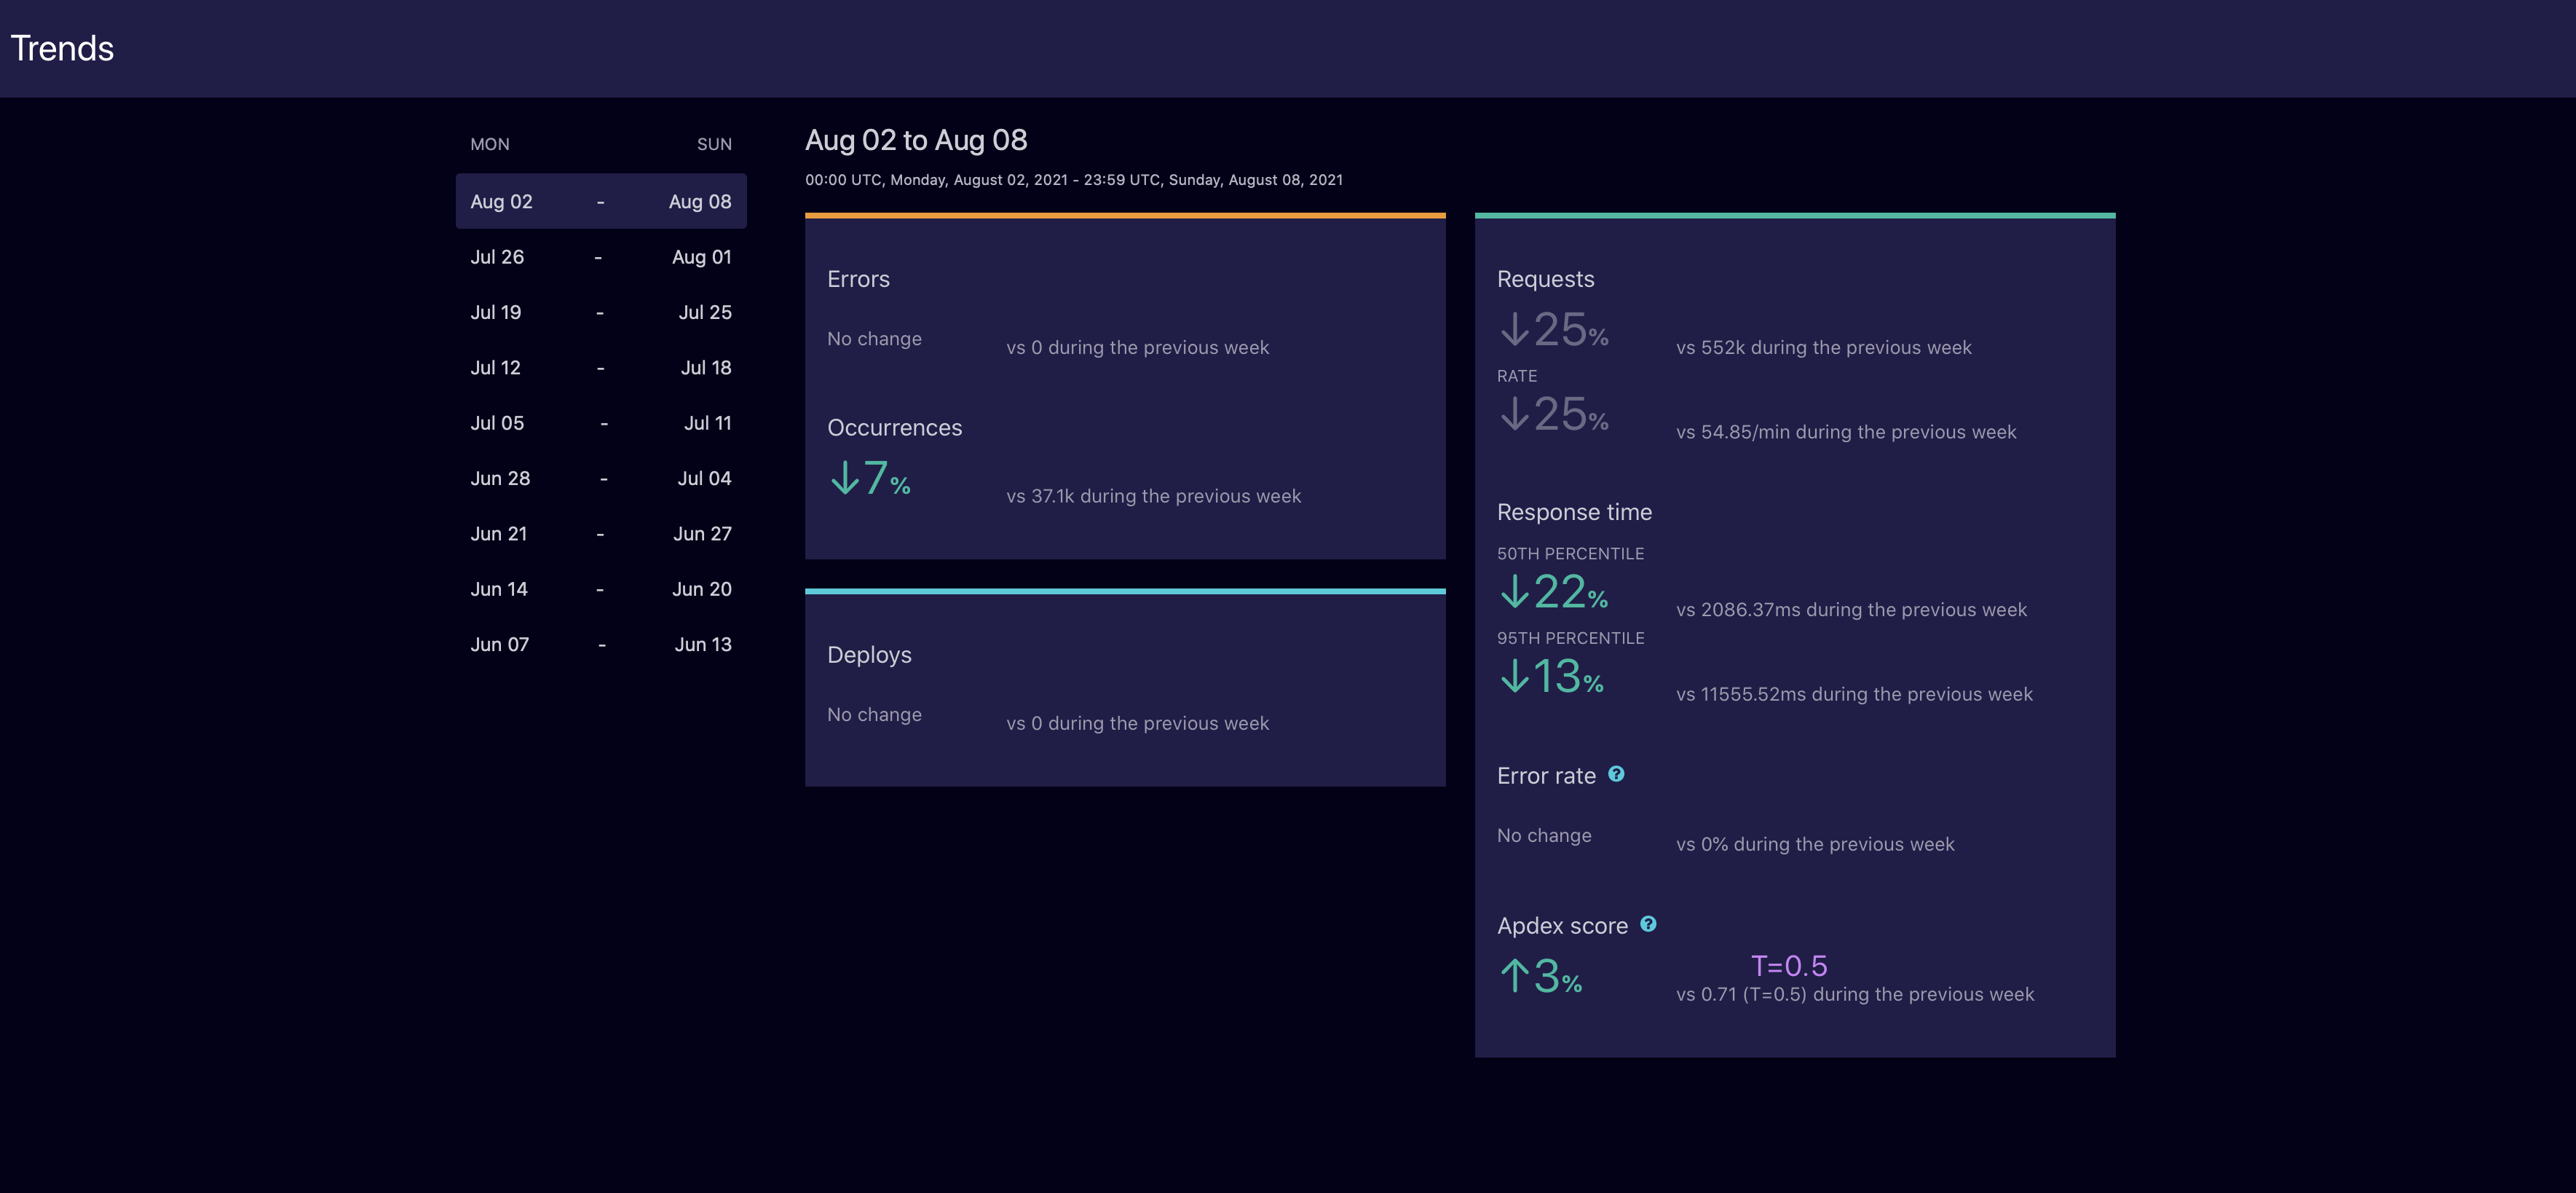  | Splunk Observability Cloud Screenshots |