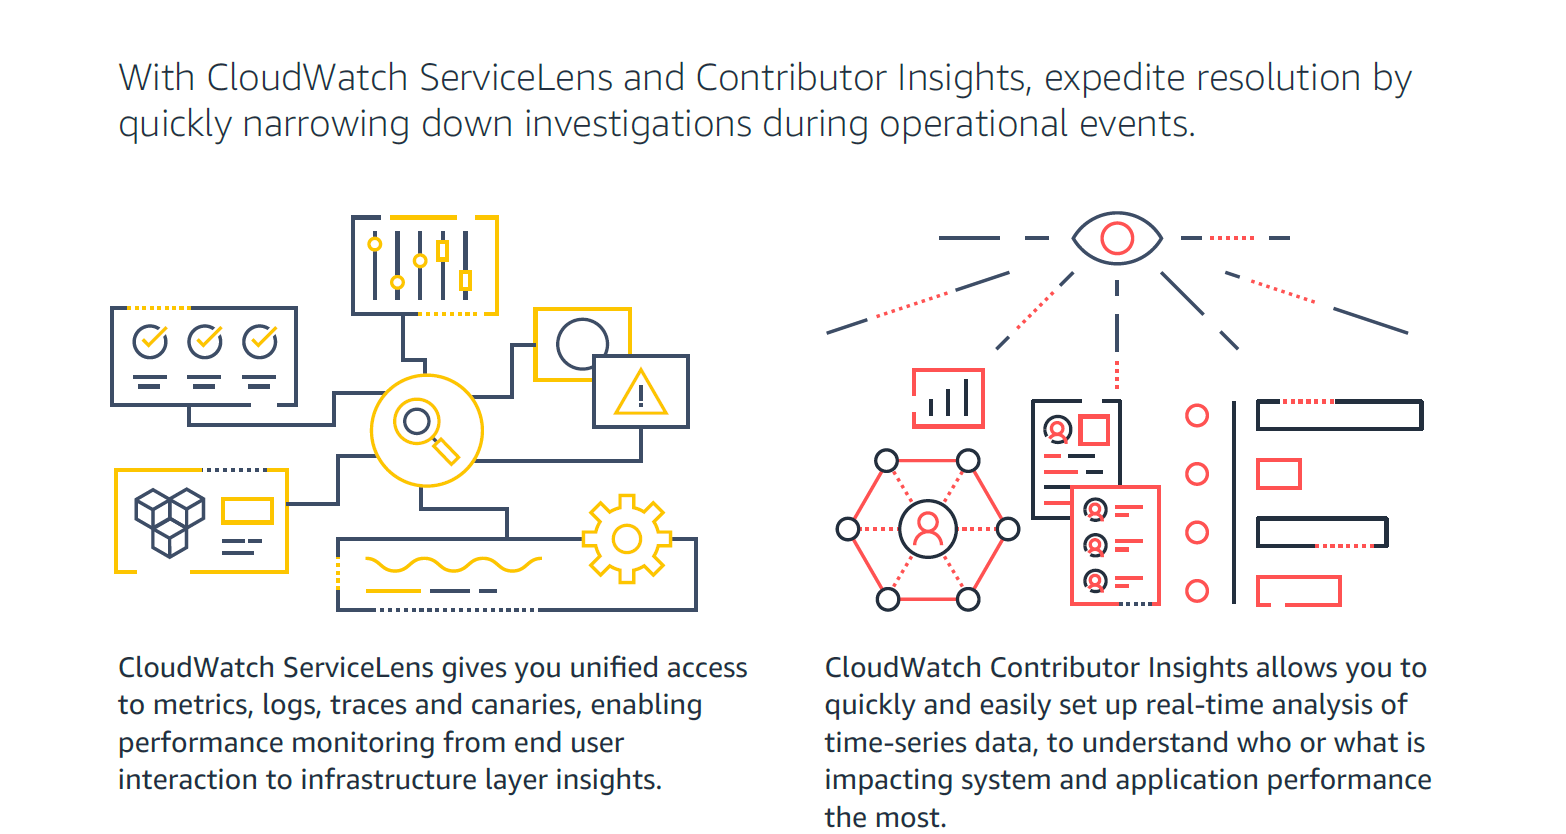
Amazon CloudWatch is a native AWS monitoring tool for AWS programs. It provides data collection and resource monitoring capabilities.
$0
per canary run
Webtrends Analytics
Score3 out of 10
N/A
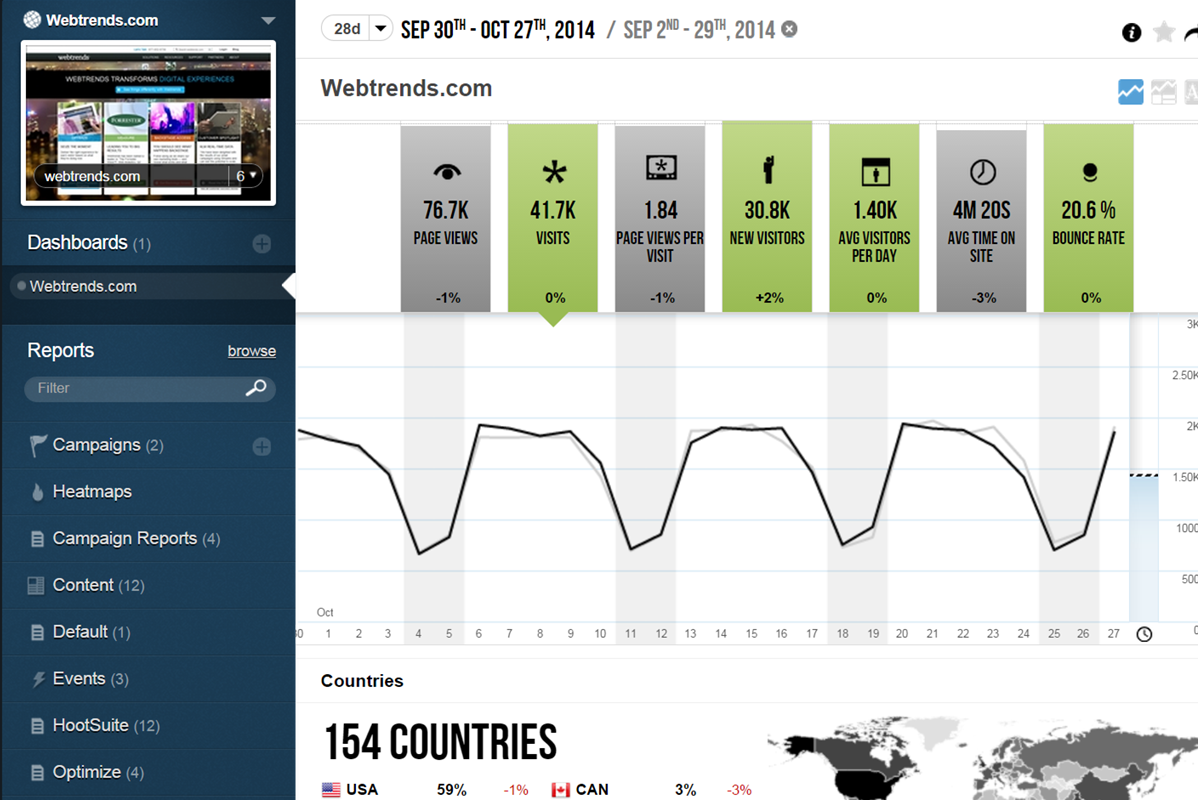
WebTrends provides an enterprise web analytics platform and, according to Forrester, has a strong focus on support for mobile and social channels and a very open platform. Webtrends competes directly with Adobe Site Catalyst, IBM Coremetrics. and comScore DigitalAnalytix.
N/A
Pricing
Amazon CloudWatch
Webtrends Analytics
Editions & Modules
Canaries
$0.0012
per canary run
Logs - Analyze (Logs Insights queries)
$0.005
per GB of data scanned
Over 1,000,000 Metrics
$0.02
per month
Contributor Insights - Matched Log Events
$0.02
per month per one million log events that match the rule
Logs - Store (Archival)
$0.03
per GB
Next 750,000 Metrics
$0.05
per month
Next 240,000 Metrics
$0.10
per month
Alarm - Standard Resolution (60 Sec)
$0.10
per month per alarm metric
First 10,000 Metrics
$0.30
per month
Alarm - High Resolution (10 Sec)
$0.30
per month per alarm metric
Alarm - Composite
$0.50
per month per alarm
Logs - Collect (Data Ingestion)
$0.50
per GB
Contributor Insights
$0.50
per month per rule
Events - Custom
$1.00
per million events
Events - Cross-account
$1.00
per million events
CloudWatch RUM
$1
per 100k events
Dashboard
$3.00
per month per dashboard
CloudWatch Evidently - Events
$5
per 1 million events
CloudWatch Evidently - Analysis Units
$7.50
per 1 million analysis units
No answers on this topic
Offerings
Pricing Offerings
Amazon CloudWatch
Webtrends Analytics
Free Trial
Yes
No
Free/Freemium Version
Yes
No
Premium Consulting/Integration Services
Yes
No
Entry-level Setup Fee
No setup fee
No setup fee
Additional Details
With Amazon CloudWatch, there is no up-front commitment or minimum fee; you simply pay for what you use. You will be charged at the end of the month for your usage.
For out business we find that AWS Cloudwatch is good at providing real-time metrics for monitoring and analysing the performance and usage of our platform by customers. It is possible to create custom metrics from log events, such people adding items to a basket, checking out or abandoning their orders.
A de minimis incentive was given to thank the reviewer for their time. The incentive was not used to bias or drive a particular response, nor was the incentive contingent on a positive endorsement. More Info
Scenarios 1. If you want to use web server log files as input to your web analytics, then Webtrends will provides a good product, with great ease of implementation. Don't even think about being cheap on hardware, and make sure Webtrends runs on real servers, not in a VM environment. 2. If you want to use Data Tagging, similar to Google Analytics or Site Catalyst, Webtrends has a powerful product, just be prepared to pay. 3. If you are new to Web Analytics, but it is the strategic direction, start with Webtrends on Premises. Questions to Ask 1. What are you trying to accomplish? 2. Can you place a dollar value on the benefit that you expect/need from Webtrends? 3.Can you live with Webtrends running SaaS?
It provides lot many out of the box dashboard to observe the health and usage of your cloud deployments. Few examples are CPU usage, Disk read/write, Network in/out etc.
It is possible to stream CloudWatch log data to Amazon Elasticsearch to process them almost real time.
If you have setup your code pipeline and wants to see the status, CloudWatch really helps. It can trigger lambda function when certain cloudWatch event happens and lambda can store the data to S3 or Athena which Quicksight can represent.
A de minimis incentive was given to thank the reviewer for their time. The incentive was not used to bias or drive a particular response, nor was the incentive contingent on a positive endorsement. More Info
Control privacy, data sharing and competitive industrial knowledge using Webtrends on premises
Great control over custom reports, custom dimensions and metrics
Flexible tool which allows multiple methods of data capture. To my knowledge it was the first tool with a Tag Builder / Tag Management function built in via a supporting website.
Memory metrics on EC2 are not available on CloudWatch. Depending on workloads if we need visibility on memory metrics we use Solarwinds Orion with the agent installed. For scalable workloads, this involves customization of images being used.
Visualization out of the box. But this can easily be addressed with other solutions such as Grafana.
By design, this is only used for AWS workloads so depending on your environment cannot be used as an all in one solution for your monitoring.
A de minimis incentive was given to thank the reviewer for their time. The incentive was not used to bias or drive a particular response, nor was the incentive contingent on a positive endorsement. More Info
The big downside, the elephant in the room, is that it does not (as of right now) have on-demand segmenting, drilldowns, etc. You have to think of what you want in advance and create those reports then analyze some data. This is huge. You can, of course, re-analyze old data after creating new reports but you still have to wait. (This deficiency may become obsolete with the release of Webtrends Explore later this month (May 2014).)
It has fewer mature integrations with other products and databases than competitors do, although I'm told it works with SharePoint better than anything else does.
Its attribution modeling capability is behind Google Analytics'. In my humble opinion, this could be changed quickly if Webtrends would make some tweaks to its standard visitor history files (i.e. preserve the order in which past visits were sourced beyond the single most recent one, rather than storing all those past sources as a randomized list).
It doesn't incorporate statistical tests, confidence intervals, or statistical associations. However, this same criticism can be applied to its competitors (other than A/B Testing products). It's a tabulation program, as they all are. In this respect, web analytics tools as a group are relatively primitive. Sorry to bring this up as a criticism of Webtrends but it's my pet peeve about the whole industry and I just have to say it. (p.s. take advantage of the heavy-duty Webtrends Scheduled Export functionality to get really granular data that you can feed to a stats program to get significances.)
Although the documentation, help screens, phone support and the knowledge base have improved tremendously in recent years, there is still a pretty steep learning curve because it is different from the tools that entry-level users may have already been exposed to. This can be a shock and many users are alienated at first because they just don't get some of the fundamentals at first. I'd like to see much better help screens that are thoroughly interlinked with the KB and documentation. Having superb online support would make a world of difference with the adoption of this basically powerful tool.
I would be willing to try Webtrends again AFTER some research from other users. I would need to see that users mention better and faster customer support on questions and issues that arise while using the software. The software is capable of vast and incredible things, but if it isnt properly set up and supported during use, it is just a big hassel and waste of everyones time and money.
It's excellent at collecting logs. It's easy to set up. The viewing & querying part could be much better, though. The query syntax takes some time to get used to, & the examples are not helpful. Also, while being great, Log Insights requires manual picking of log streams to query across every time.
A de minimis incentive was given to thank the reviewer for their time. The incentive was not used to bias or drive a particular response, nor was the incentive contingent on a positive endorsement. More Info
If I could give it a 0, I would. Not having an intuitive user interface made it impossible to convince non-analytic business users to use the tool on their own. Even as a seasoned analyst, frequent calls were needed to get what should be simple tasks done. Account managers don't understand the tool either, and have to refer you to technical support
The v9 admin interface and v10 reporting interface work as well as expected, but have a tendency to be pokey, especially for bulky reports and whenever you're connected to wifi. I much prefer using the REST API for all reporting for this reason, which simply dumps out the data and doesn't bother with the user interface.
Support is effective, and we were able to get any problems that we couldn't get solved through community discussion forums solved for us by the AWS support team. For example, we were assisted in one instance where we were not sure about the best metrics to use in order to optimize an auto-scaling group on EC2. The support team was able to look at our metrics and give a useful recommendation on which metrics to use.
A de minimis incentive was given to thank the reviewer for their time. The incentive was not used to bias or drive a particular response, nor was the incentive contingent on a positive endorsement. More Info
I once went on to Twitter to ask for help from my network of analytics people, and Webtrends themselves responded. They have been an excellent partner in making sure that their product is being used to the best of it's ability and I greatly appreciate that. Both Omniture and Google Analytics, do not have that level of support over social media
The in-person training was comprehensive enough to get you started, but I strongly recommend having a more experienced person when beginning with the tool.
Webtrends provides several free webinars over the course of the year, many of which I would expect to pay for. The people providing the webinars seem to have a good feel for real-world application of the product.
Careful planning and patience. Use a non-public test site to fine tune tags and reporting. Despite best laid plans, there will be surprises when you collect the data, run the analysis and begin generating reports using the tool. Perform a tag audit to ensure tags fire as desired.
Grafana is definitely a lot better and flexible in comparison with Amazon CloudWatch for visualisation, as it offers much more options and is versatile. VictoriaMetrics and Prometheus are time-series databases which can do almost everything cloudwatch can do in a better and cheaper way. Integrating Grafana with them will make it more capable Elasticsearch for log retention and querying will surpass cloudwatch log monitoring in both performance and speed
A de minimis incentive was given to thank the reviewer for their time. The incentive was not used to bias or drive a particular response, nor was the incentive contingent on a positive endorsement. More Info
Webtrends has its work cut out for itself considering you have the behemoth Google Analytics and Google Analytics Premium having a strong offering and brand recognition for the price of free. After reviewing the paid service I'd suggest you start off with GA as a cheaper alternative that is just as robust, if not much more flexible in regards to the reporting and goal tracking needs for our company.
A de minimis incentive was given to thank the reviewer for their time. The incentive was not used to bias or drive a particular response, nor was the incentive contingent on a positive endorsement. More Info
A de minimis incentive was given to thank the reviewer for their time. The incentive was not used to bias or drive a particular response, nor was the incentive contingent on a positive endorsement. More Info
Webtrends has had a positive impact on site visitation because it allowed us to understand the sources by domain for site traffic and find out ways to increase visits from those domains.
Webtrends has also allowed us to understand areas of optimization on the site, which has had a positive impact on the overall user journey on the site, likely leading to longer site duration and engagement.