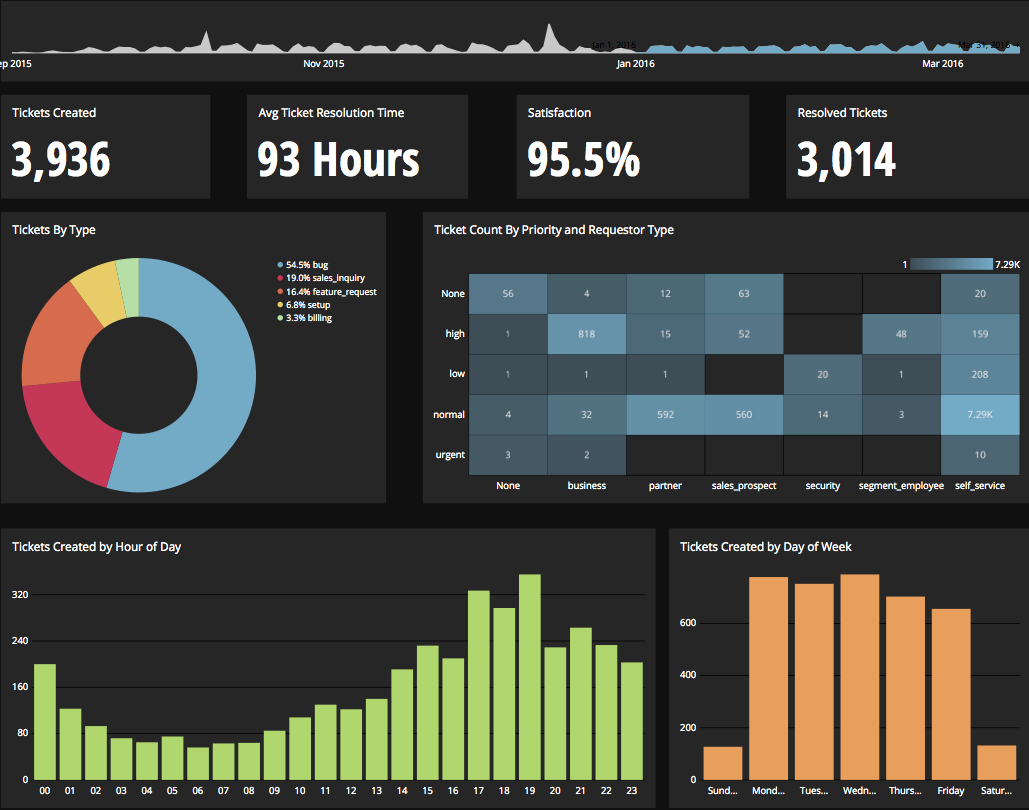
Chartio is a visualization tool designed to enable anyone to explore, transform and visualize data on the fly through a drag-and-drop interface. Chartio was acquired by Atlassian in February 2021 so that it's capabilities could be integrated into the Atlassian product portfolio's capabilities. Chartio is no longer available to new customers, standalone. Existing customers must migrate to alternatives by March 2022, when the service will be retired.
$40
per user/per month
Google Cloud Data Studio (formerly Looker Studio)
Score8.2 out of 10
N/A
Google Cloud Data Studio (formerly Looker Studio) is a data visualization platform that transforms data into meaningful presentations and dashboards with customized reporting tools.
Chartio is a great tool for building presentable dashboards. It can export, you can add read-only access, and it has permissions levels by dashboard for users. There are other data analysis tools that help to analyze the data, but few allow for such a nice presentation
Visualizing cross-channel campaign performance can blend data from a few different sources to compare performance metrics like spend, clicks, and conversions side-by-side in a single view, which helps in quick budget reallocation decisions. When dealing with massive volumes of data (millions of rows) or highly complex queries, Looker Studio dashboards can become slow, laggy, or even crash. Performance issues are a frequent complaint when working with large datasets, making it unsuitable for enterprise-level companies
A de minimis incentive was given to thank the reviewer for their time. The incentive was not used to bias or drive a particular response, nor was the incentive contingent on a positive endorsement. More Info
Direct linkage to our databases. Abstracts away the visualization layer so we can focus on the data and the queries.
Host of graphs and tools that permits all types of data visualizations.
Haven't quite used this yet, but there is a new embedding feature that will be very helpful so that we can embed the charts into a company central dash.
Breath of data - the number of ways to interrogate the data is endless, and the options to view metrics alongside each other make for comprehensive datasets.
Data visualisation and customisation - the options for presenting data and separating out across pages allow for clean visuals and segmented information.
Easy shareability/usability - a quick and simple tool to introduce colleagues to, and easy to grant access for them to be able to view the data, without having to understand the setup itself.
A de minimis incentive was given to thank the reviewer for their time. The incentive was not used to bias or drive a particular response, nor was the incentive contingent on a positive endorsement. More Info
There is not a last full month date range option. You can still get the range that you need, but the dashboards will have to be manually updated to exclusively display one whole month.
When building a chart, the area which displays your tables and fields is finite. You can't adjust the size to make it easier to see. They do allow a mouse-over to see the entire name of your table/field, but I would prefer to adjust the width.
Once you modify a query in the Custom Query tab, there doesn't seem to be a way to go back to using the U.I.
It needs better handling of complex logic. We often need workarounds to perform complex custom calculations, and it can be really unpleasant at times.
Felt it got slow with a larger data set, and in one minor report, we had to set up time filters so that calculations during spikes could be traced more quickly.
Compare to competition they need to improve with notification things.
A de minimis incentive was given to thank the reviewer for their time. The incentive was not used to bias or drive a particular response, nor was the incentive contingent on a positive endorsement. More Info
Great customer support: You will receive an answer by email usually within 20-30 minutes. Not only that but our CSMs for Chartio go out of their way to help, they have even created charts for some of the less experienced users that wanted an example to work from. We have had nothing but great experiences with this team.
A de minimis incentive was given to thank the reviewer for their time. The incentive was not used to bias or drive a particular response, nor was the incentive contingent on a positive endorsement. More Info
It is the simplest and least expensive way for us to automate our reporting at this time. I like the ability to customize literally everything about each report, and the ability to send out reports automatically in emails. The only issue we have been having recently is a technical glitch in the automatic email report. Sadly, there is almost no support for this tool from Google, but is also free, so that is important to take into consideration
A de minimis incentive was given to thank the reviewer for their time. The incentive was not used to bias or drive a particular response, nor was the incentive contingent on a positive endorsement. More Info
I really like using Chartio. I use it on a daily basis for pulling data from different sources and combining data (the explore tab was a great idea for this use). I think I would give it 8/10 because there needs to be more documentation or maybe blog posts about things people are doing with it. I only have my own ideas about what to do /how to graph things. I know there are some articles, but it would be awesome to have a section on the neat dashboards people are building or how they show data in different ways. Another complaint is how much time it takes to load. I know our databases aren't set up precisely for Chartio and I have been creating data stores. But the data stores have so many more limitations that adds a whole new layer of frustration. Love the product, keep up the good work and the fast fixes.
Looker Studio is easy to use, and it offers a sufficient variety of predefined visualizations to choose from. It's easy for us, and anyone can set up basic reporting without extensive data visualization skills. The interface layout is easy to understand, and it doesn't take long to get used to.
A de minimis incentive was given to thank the reviewer for their time. The incentive was not used to bias or drive a particular response, nor was the incentive contingent on a positive endorsement. More Info
I give it a lower support rating because it seems like our Dev team hasn't gotten the support they need to set up our database to connect. Seems like we hit a roadblock and the project got put on pause for dev. That sucks for me because it is harder to get the dev team to focus on it if they don't get the help they need to set it up.
A de minimis incentive was given to thank the reviewer for their time. The incentive was not used to bias or drive a particular response, nor was the incentive contingent on a positive endorsement. More Info
I use self learning materials. Pretty helpful. I find myself having to go back to the "drilldown" instructions though, and have a hard time finding hidden variables on a dashboard, so perhaps there is room for intuitive improvements (or maybe I'm just being lazy)
Chartio so far has been the easiest BI tool to setup and has also been the most affordable. There are some other, great, BI tools out there but they were a bit to heavy handed for what we needed. Also - despite the high cost per user in Chartio, the other tools were still more expensive.
A de minimis incentive was given to thank the reviewer for their time. The incentive was not used to bias or drive a particular response, nor was the incentive contingent on a positive endorsement. More Info
Looker Studio is far easier to implement, stand up, and learn. The interface is simpler and user-friendly for various levels of data visualization/analysis knowledge and experience. The biggest benefit of Looker Studio, however, is its ease of connection to GA data and speed. Furthermore, since it is an online program/tool, it requires less CPU/battery/storage on the user's device.
A de minimis incentive was given to thank the reviewer for their time. The incentive was not used to bias or drive a particular response, nor was the incentive contingent on a positive endorsement. More Info
Chartio has worked well as our datawarehouse has rapidly expanded, and the usability/performance hasn't seemed to have suffered. What we haven't yet realized is additional savings from additional users. We have some dashboard needs for users who truly just view of a few charts, and the licensing structure hasn't yet been structured in a way that would support that type of approach...having 50 "core" licenses, and then potentially several hundred view only licenses for partners that would use the application infrequently.
A de minimis incentive was given to thank the reviewer for their time. The incentive was not used to bias or drive a particular response, nor was the incentive contingent on a positive endorsement. More Info