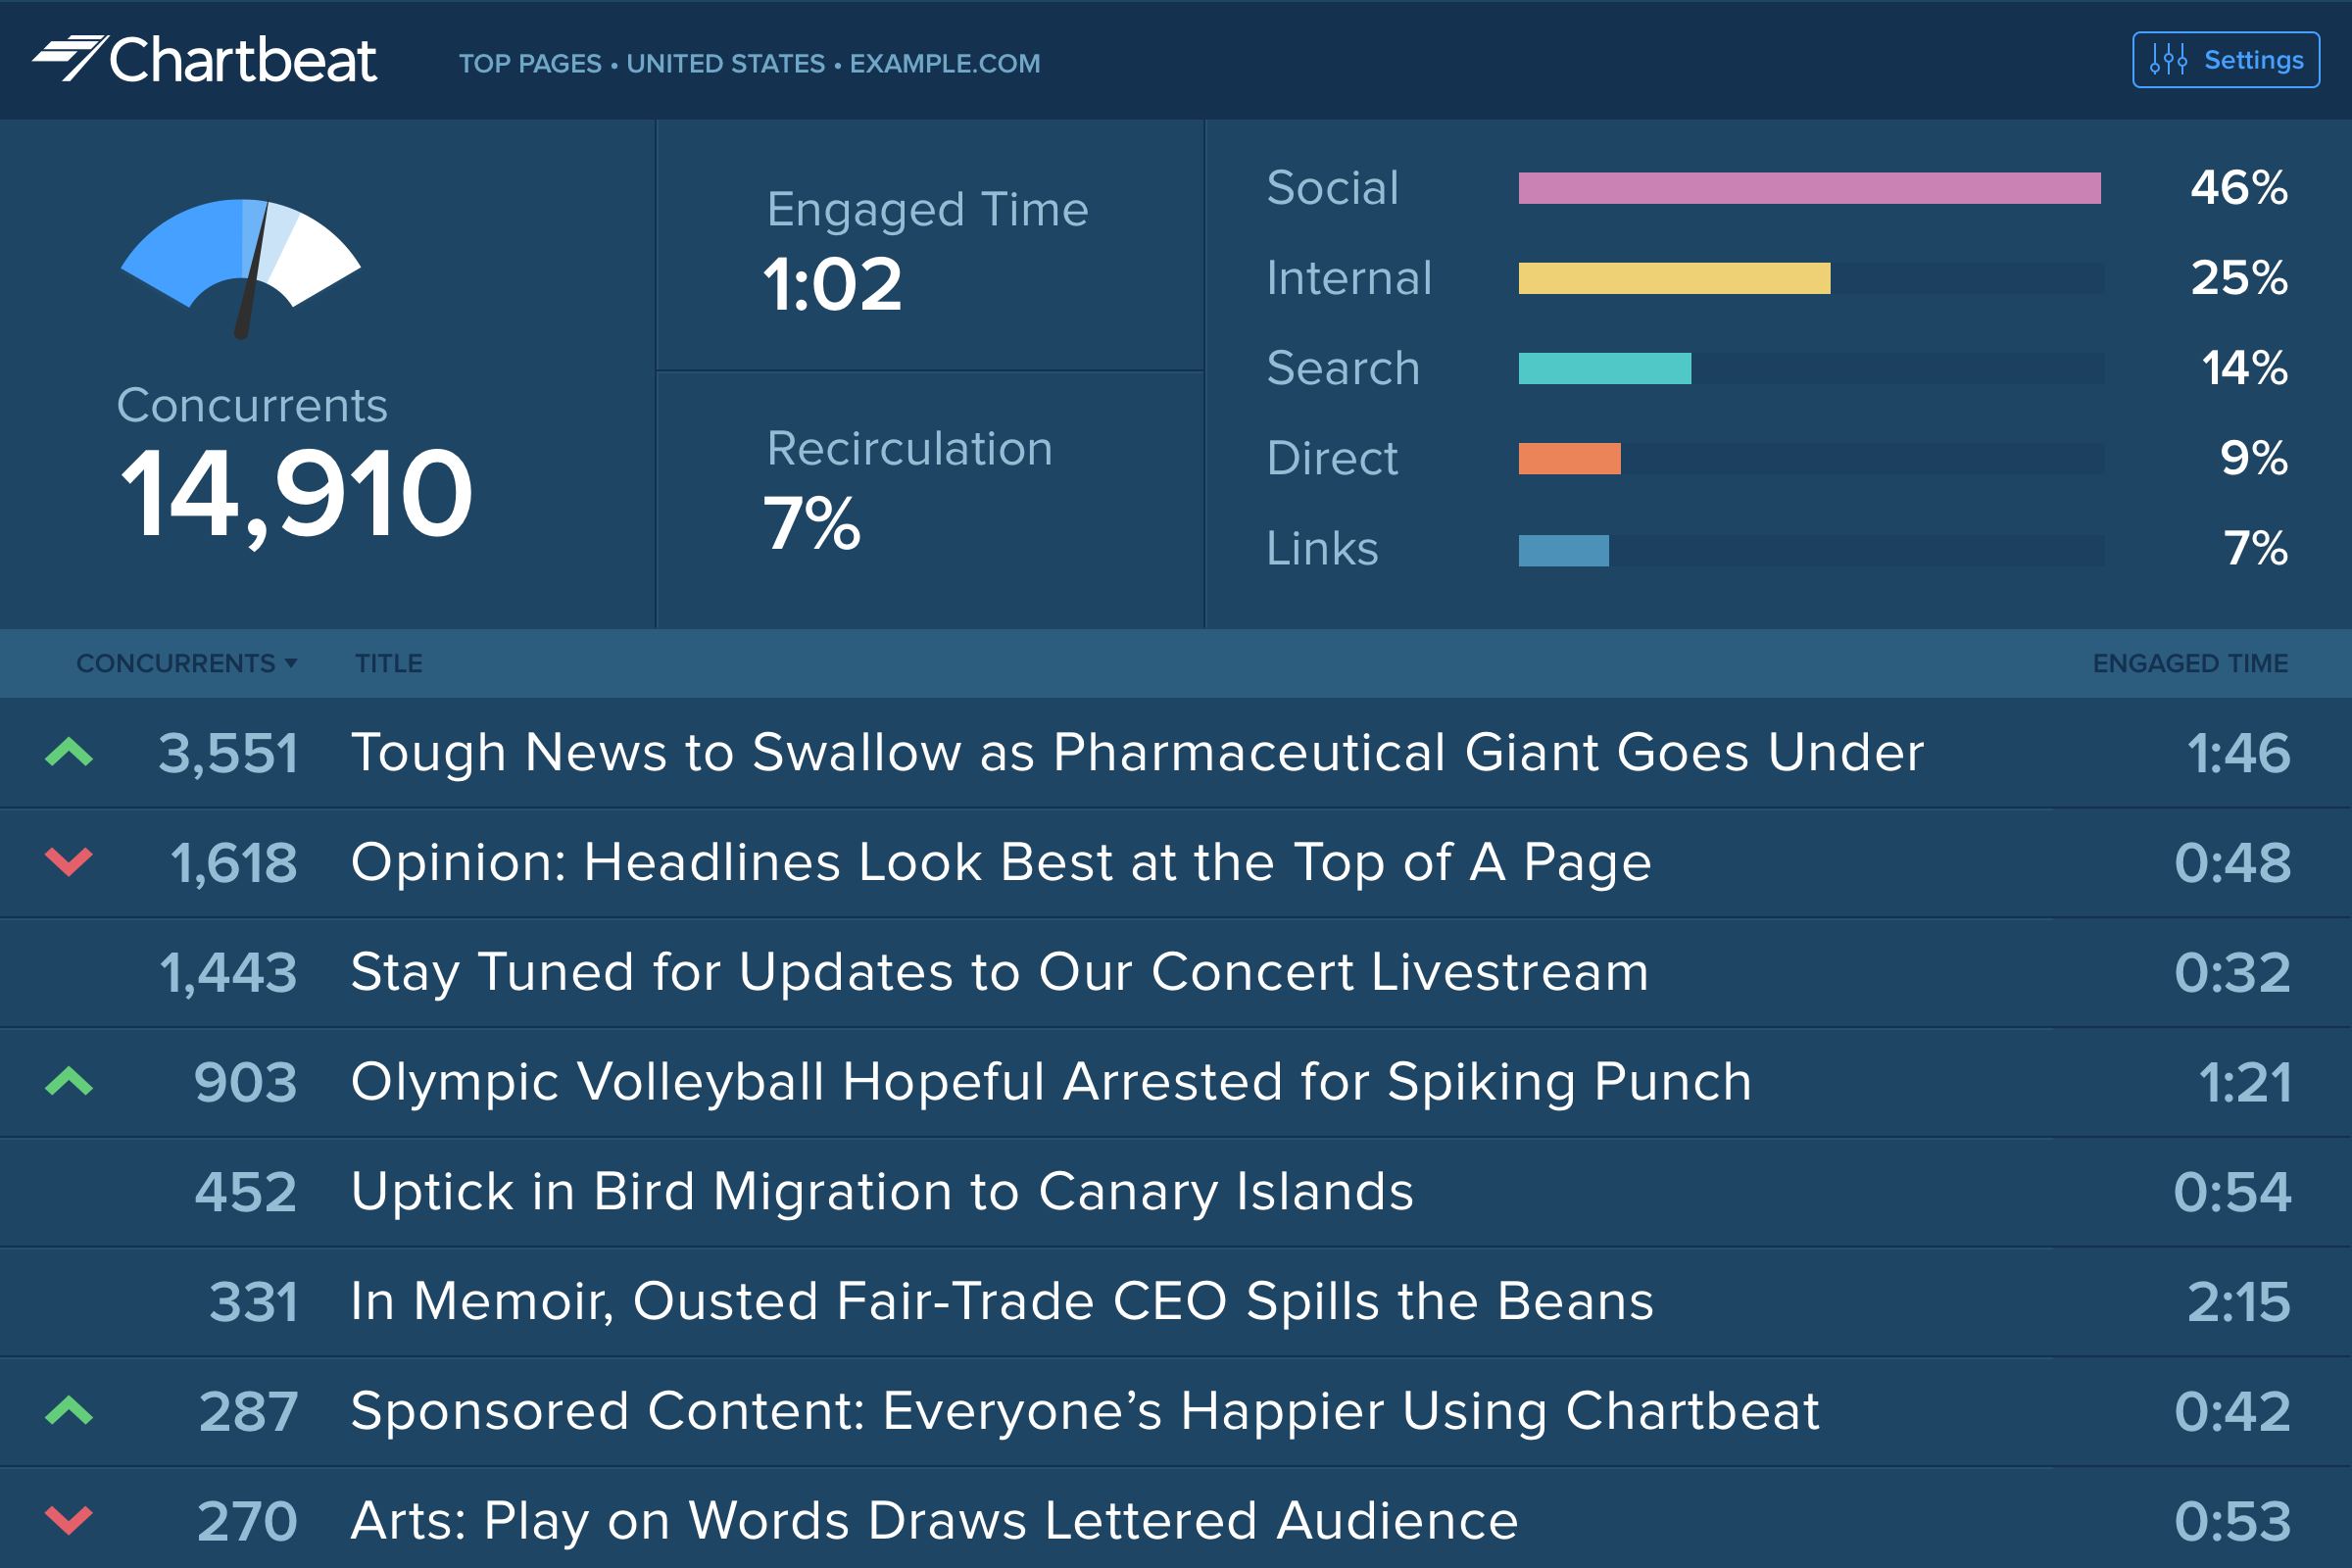
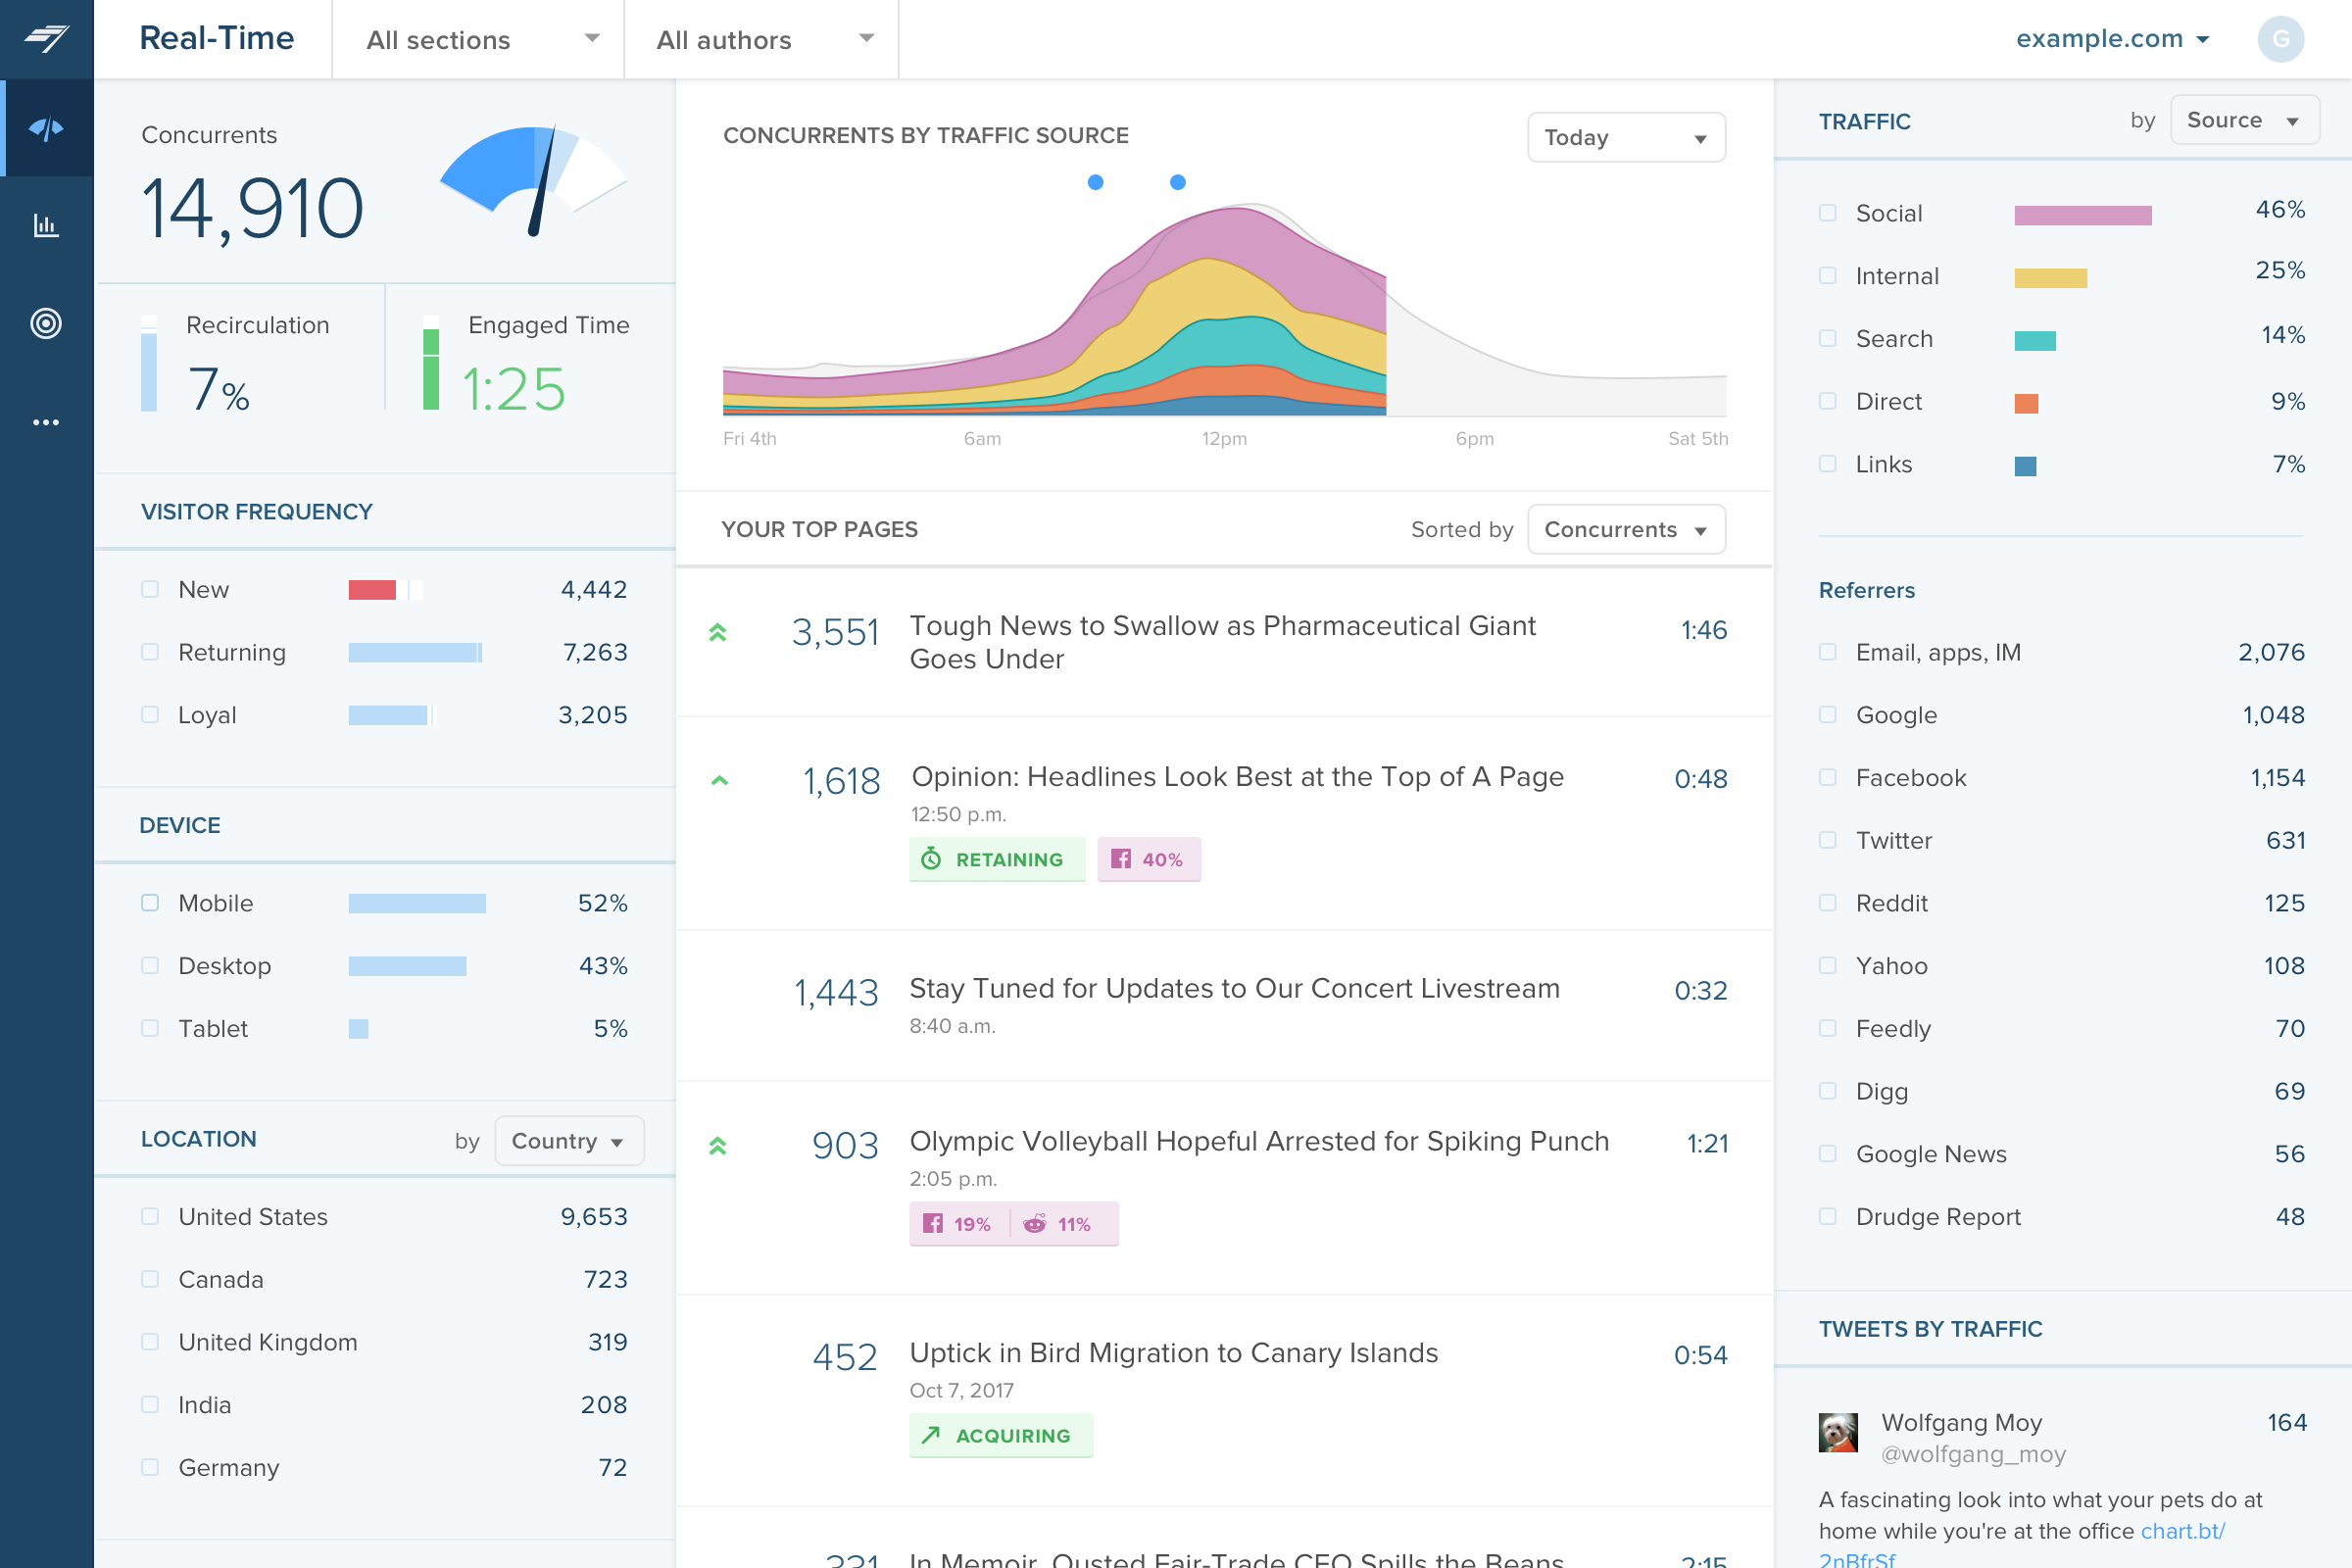
Chartbeat delivers real-time analytics, insights, and transformative tools for content teams around the world, to help improve audience engagement, inform editorial decisions, and increase loyalty.
N/A
Sprinklr Insights
Score7.5 out of 10
N/A
Sprinklr Insights is a Market Intelligence platform that provides enterprises with consumer, competitor, and market data across more than 30 channels. It centralizes Social Media Monitoring, Brand Intelligence, Voice of the Customer, crisis-management, and Competitive Intelligence workflows on one platform. Sprinklr Insights analyzes conversations from social, digital, news, review, and owned-data sources to help teams monitor audiences, reputation, market trends, and brand performance.…
N/A
Pricing
Chartbeat
Sprinklr Insights
Editions & Modules
No answers on this topic
Sprinklr Insights
Custom, quote-based pricing
per year
Offerings
Pricing Offerings
Chartbeat
Sprinklr Insights
Free Trial
Yes
No
Free/Freemium Version
No
No
Premium Consulting/Integration Services
Yes
Yes
Entry-level Setup Fee
No setup fee
Optional
Additional Details
Chartbeat pricing is based on monthly site page views. Discounts are applied to multi-year contracts. The Basic Plan includes the Real-time Dashboard, Historical Dashboard, Heads Up Display, Reports, Big Board, iOS and Android app, and Real-time API endpoints.
The Plus Plan includes all of the Basic Plan features, plus ONE of the following Premium features: Headline Testing, Advanced Queries, or Multi-Site View.
The Premium Plan includes all of the Basic Plan features, plus ALL Premium features: Headline Testing, Advanced Queries, Multi-Site View, and enterprise-level support and custom trainings.
The main point of benefit is the realtime data. This is vital to our team as we are publishing a lot of content per day, so we have a busy homepage to manage and it's important to know which content is performing well. We also like to get an understanding as quickly as possible - which Chartbeat offers - of where traffic is coming from. Often we will see an example where a page is getting high traffic from Google, for example, and we know that might not need to be placed so prominently on the homepage because the traffic is arriving to us externally anyway. Without that depth of understanding what is performing best and why - updated immediately, unlike in Google Analytics now - our homepage would not be as well optimised for users coming to us direct
A de minimis incentive was given to thank the reviewer for their time. The incentive was not used to bias or drive a particular response, nor was the incentive contingent on a positive endorsement. More Info
Sprinklr Modern Research offers us a good amount of coverage when we want to search for our chosen keywords or brand mentions across the wider social & news landscape. Certain platforms are of course harder to track than others, while others offer a huge amount of opportunity and Sprinklr does a fantastic job of visualising this. We find that image recognition is one area where there is room for improvement.
A de minimis incentive was given to thank the reviewer for their time. The incentive was not used to bias or drive a particular response, nor was the incentive contingent on a positive endorsement. More Info
A de minimis incentive was given to thank the reviewer for their time. The incentive was not used to bias or drive a particular response, nor was the incentive contingent on a positive endorsement. More Info
Source of traffic needs improvement. Search and social make sense, but "internal" and "links" is a grey area. It would be helpful to define those with an organization and provide an information icon so users can easily remember what each of those buckets is tracking.
More ways to customize the real-time board. For example, with video content, that's great that I can see a user has started a video, but what is the completion rate, was that only on O&O or can that track Facebook, too?
Would like to see demo (age) information included as a way to slice the data so I can see what's working with my older and younger demo.
A de minimis incentive was given to thank the reviewer for their time. The incentive was not used to bias or drive a particular response, nor was the incentive contingent on a positive endorsement. TR verified that a representative sample of customers was invited. More Info
Include more sources in listening, every time we share listening data with a wider team we also make them aware of listening limitations as our data is very often challenged
'Uncategorized' age category in demographics for listening - it's always a majority which doesn't look great
Overall the main feedback is that there is so much data available but it's very difficult to extract any insights from listening/benchmarking. Some inspiration/advice would be much appreciated.
A de minimis incentive was given to thank the reviewer for their time. The incentive was not used to bias or drive a particular response, nor was the incentive contingent on a positive endorsement. More Info
I gave Chartbeat a 5 for a renewal rating, because, while it delivers clear and understandable content, Google Analytics also provides many of the same features for free. For a small to medium website, I believe it would be more cost effective to use Google Analytics. A website with a high amount of traffic, however, could merit spending the money on Chartbeat to maximize their potential.
I am able to "set it and forget it," keeping it up on my monitor for either constant checking or just keeping an eye on the numbers during the day. I'm also able to keep track of what times are perfect to post a story and which stories rack up the most traffic.
A de minimis incentive was given to thank the reviewer for their time. The incentive was not used to bias or drive a particular response, nor was the incentive contingent on a positive endorsement. More Info
The interface is user-friendly and quite intuitive. However, the tool is very complete and the app can seem a bit dense at times with a lot of different places and categories. It just takes a bit of time to adjust before being a great tool
A de minimis incentive was given to thank the reviewer for their time. The incentive was not used to bias or drive a particular response, nor was the incentive contingent on a positive endorsement. More Info
I have had limited experience of support for Chartbeat but whenever I have needed help it has been there. Recently there was an issue of seeing different forms of data in real time - app and otherwise effectively, and the issue was being clearly dealt with and communicated back to us.
A de minimis incentive was given to thank the reviewer for their time. The incentive was not used to bias or drive a particular response, nor was the incentive contingent on a positive endorsement. More Info
We have had some good experiences, especially during renewal periods, but support has suddenly disappeared when the renewal is completed. Also, while we have multiple teams, those deemed more important or more likely to expand their purchase are given more attention. This decision comes from Sprinklr, not internally, so they are prioritizing support for teams which are actually not the teams paying the majority of the money for the service.
A de minimis incentive was given to thank the reviewer for their time. The incentive was not used to bias or drive a particular response, nor was the incentive contingent on a positive endorsement. More Info
Omnilytics is more robust, detailed, and catered for an intermediate media user, while I think Chartbeat is a more user-friendly and beginner-oriented piece of technology. That being said, there is an impressive amount of lift for Chartbeat, and it's evident that simplicity is the key to using a software daily (which is absolutely the point in the content world).
A de minimis incentive was given to thank the reviewer for their time. The incentive was not used to bias or drive a particular response, nor was the incentive contingent on a positive endorsement. More Info
They are not included in all the things. It is integrated with different AI technologies. I like working with the Sprinklr team and building my own dashboards for new initiatives. The insights presented about the market are unmatched. See what people say about my brand or category like the hashtag research function for Instagram and Twitter. It would even suggest hashtags. Ease of use—from bullion coding/keyword building to analytics dashboarding
A de minimis incentive was given to thank the reviewer for their time. The incentive was not used to bias or drive a particular response, nor was the incentive contingent on a positive endorsement. More Info
A de minimis incentive was given to thank the reviewer for their time. The incentive was not used to bias or drive a particular response, nor was the incentive contingent on a positive endorsement. More Info
It has definitely improved our analytical insights by making the platform flexible enough to be able to deep dive and pull up a report on any metric and drive it.
Real-time data is the boss of all. It helps us fix things with engagement team before the damage is done.
User friendly UI has made it easy to operate and increase productivity.
A de minimis incentive was given to thank the reviewer for their time. The incentive was not used to bias or drive a particular response, nor was the incentive contingent on a positive endorsement. More Info