Cisco Secure Cloud Analytics vs. Datadog vs. ManageEngine NetFlow Analyzer
Cisco Secure Cloud Analytics vs. Datadog vs. ManageEngine NetFlow Analyzer
| Product | Rating | Most Used By | Product Summary | Starting Price |
|---|---|---|---|---|
 Cisco Secure Cloud Analytics | N/A | Cisco Secure Cloud Analytics (Stealthwatch Cloud) aims to improve security and incident response across the distributed network, from the private network and branch office to the public cloud. This solution addresses the need for digital businesses to quickly identify threats posed by their network devices and cloud resources, and to do so with minimal management, oversight, and security manpower. | N/A | |
 Datadog | N/A | Datadog is a monitoring service for IT, Dev and Ops teams who write and run applications at scale, and want to turn the massive amounts of data produced by their apps, tools and services into actionable insight. | $18 per month per host | |
 ManageEngine NetFlow Analyzer | N/A | NetFlow Analyzer is a complete bandwidth monitoring tool that utilizes flow technology to monitor and analyze network bandwidth usage. It helps users identify and avoid bandwidth delays and bottlenecks with customized reports, and set threshold-based email and SMS alerts to help understand the severity of an issue. This analytics tool detects, diagnoses, and troubleshoots network anomalies and zero-day intrusions, and plans future bandwidth needs based on application growth to… | N/A |
| Cisco Secure Cloud Analytics | Datadog | ManageEngine NetFlow Analyzer | ||||||||||||||||||||||
|---|---|---|---|---|---|---|---|---|---|---|---|---|---|---|---|---|---|---|---|---|---|---|---|---|
| Editions & Modules | No answers on this topic |
| No answers on this topic | |||||||||||||||||||||
| Offerings |
| |||||||||||||||||||||||
| Entry-level Setup Fee | No setup fee | Optional | $595 per installation | |||||||||||||||||||||
| Additional Details | — | Discount available for annual pricing. Multi-Year/Volume discounts available (500+ hosts/mo). | — | |||||||||||||||||||||
| More Pricing Information | ||||||||||||||||||||||||
| Cisco Secure Cloud Analytics | Datadog | ManageEngine NetFlow Analyzer |
|---|
| Cisco Secure Cloud Analytics | Datadog | ManageEngine NetFlow Analyzer | |
|---|---|---|---|
| Small Businesses | No answers on this topic |  InfluxDB Score 8.8 out of 10 |  Auvik Score 8.5 out of 10 |
| Medium-sized Companies |  InsightIDR Score 8.7 out of 10 |  Sumo Logic Score 8.8 out of 10 |  SolarWinds NetFlow Traffic Analyzer (NTA) Score 9.4 out of 10 |
| Enterprises | InsightIDR Score 8.7 out of 10 |  NetBrain Technologies Score 9.2 out of 10 | SolarWinds NetFlow Traffic Analyzer (NTA) Score 9.4 out of 10 |
| All Alternatives | View all alternatives | View all alternatives | View all alternatives |
| Cisco Secure Cloud Analytics | Datadog | ManageEngine NetFlow Analyzer | |
|---|---|---|---|
| Likelihood to Recommend | 8.0 (2 ratings) | 9.4 (55 ratings) | 9.1 (4 ratings) |
| Usability | - (0 ratings) | 9.2 (34 ratings) | 8.0 (1 ratings) |
| Support Rating | - (0 ratings) | 8.9 (6 ratings) | 10.0 (1 ratings) |
| Cisco Secure Cloud Analytics | Datadog | ManageEngine NetFlow Analyzer | |
|---|---|---|---|
| Likelihood to Recommend | Cisco
|  Datadog
| ManageEngine, A Div of Zoho Corporation Pvt Ltd
|
| Pros | Cisco
 Arpit Singh Software Engineer | Datadog
| ManageEngine, A Div of Zoho Corporation Pvt Ltd
|
| Cons | Cisco
| Datadog
| ManageEngine, A Div of Zoho Corporation Pvt Ltd
|
| Likelihood to Renew | Cisco No answers on this topic | Datadog
| ManageEngine, A Div of Zoho Corporation Pvt Ltd No answers on this topic |
| Usability | Cisco
| Datadog
 Jeffrey van Santen Sr SWE | ManageEngine, A Div of Zoho Corporation Pvt Ltd
|
| Performance | Cisco
| Datadog No answers on this topic | ManageEngine, A Div of Zoho Corporation Pvt Ltd No answers on this topic |
| Support Rating | Cisco
| Datadog
| ManageEngine, A Div of Zoho Corporation Pvt Ltd
|
| Implementation Rating | Cisco No answers on this topic | Datadog
| ManageEngine, A Div of Zoho Corporation Pvt Ltd No answers on this topic |
| Alternatives Considered | Cisco
| Datadog
| ManageEngine, A Div of Zoho Corporation Pvt Ltd
|
| Scalability | Cisco
| Datadog No answers on this topic | ManageEngine, A Div of Zoho Corporation Pvt Ltd No answers on this topic |
| Return on Investment | Cisco
| Datadog
| ManageEngine, A Div of Zoho Corporation Pvt Ltd
|
| ScreenShots | Datadog Screenshots      | ManageEngine NetFlow Analyzer Screenshots  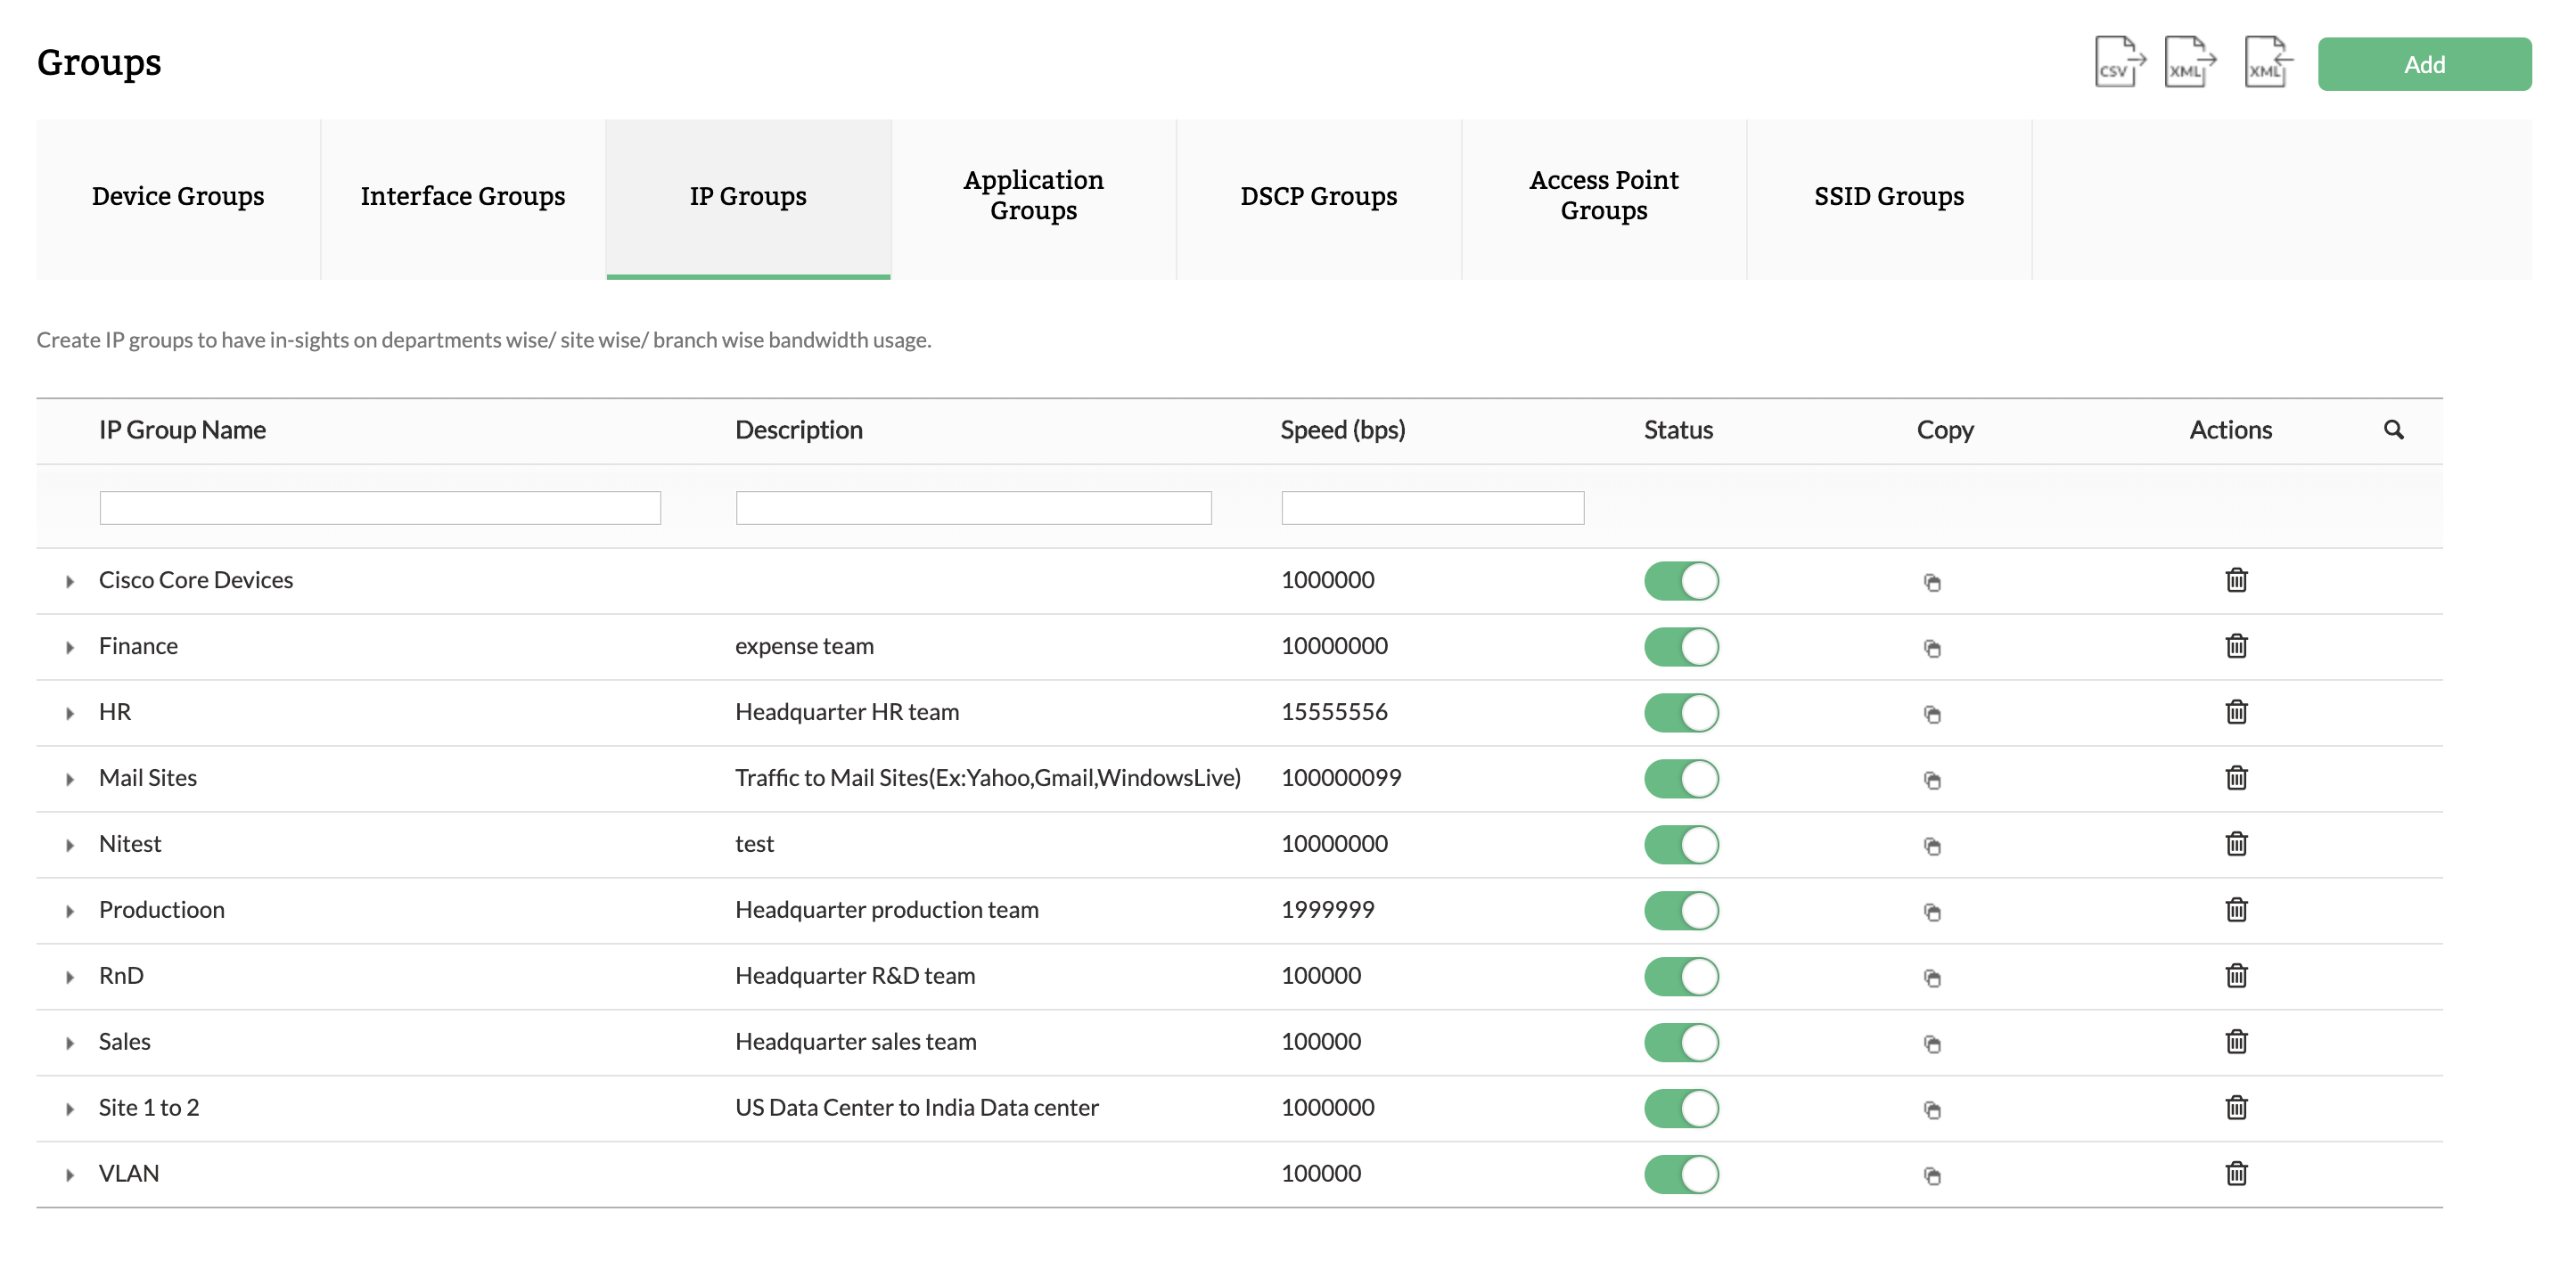  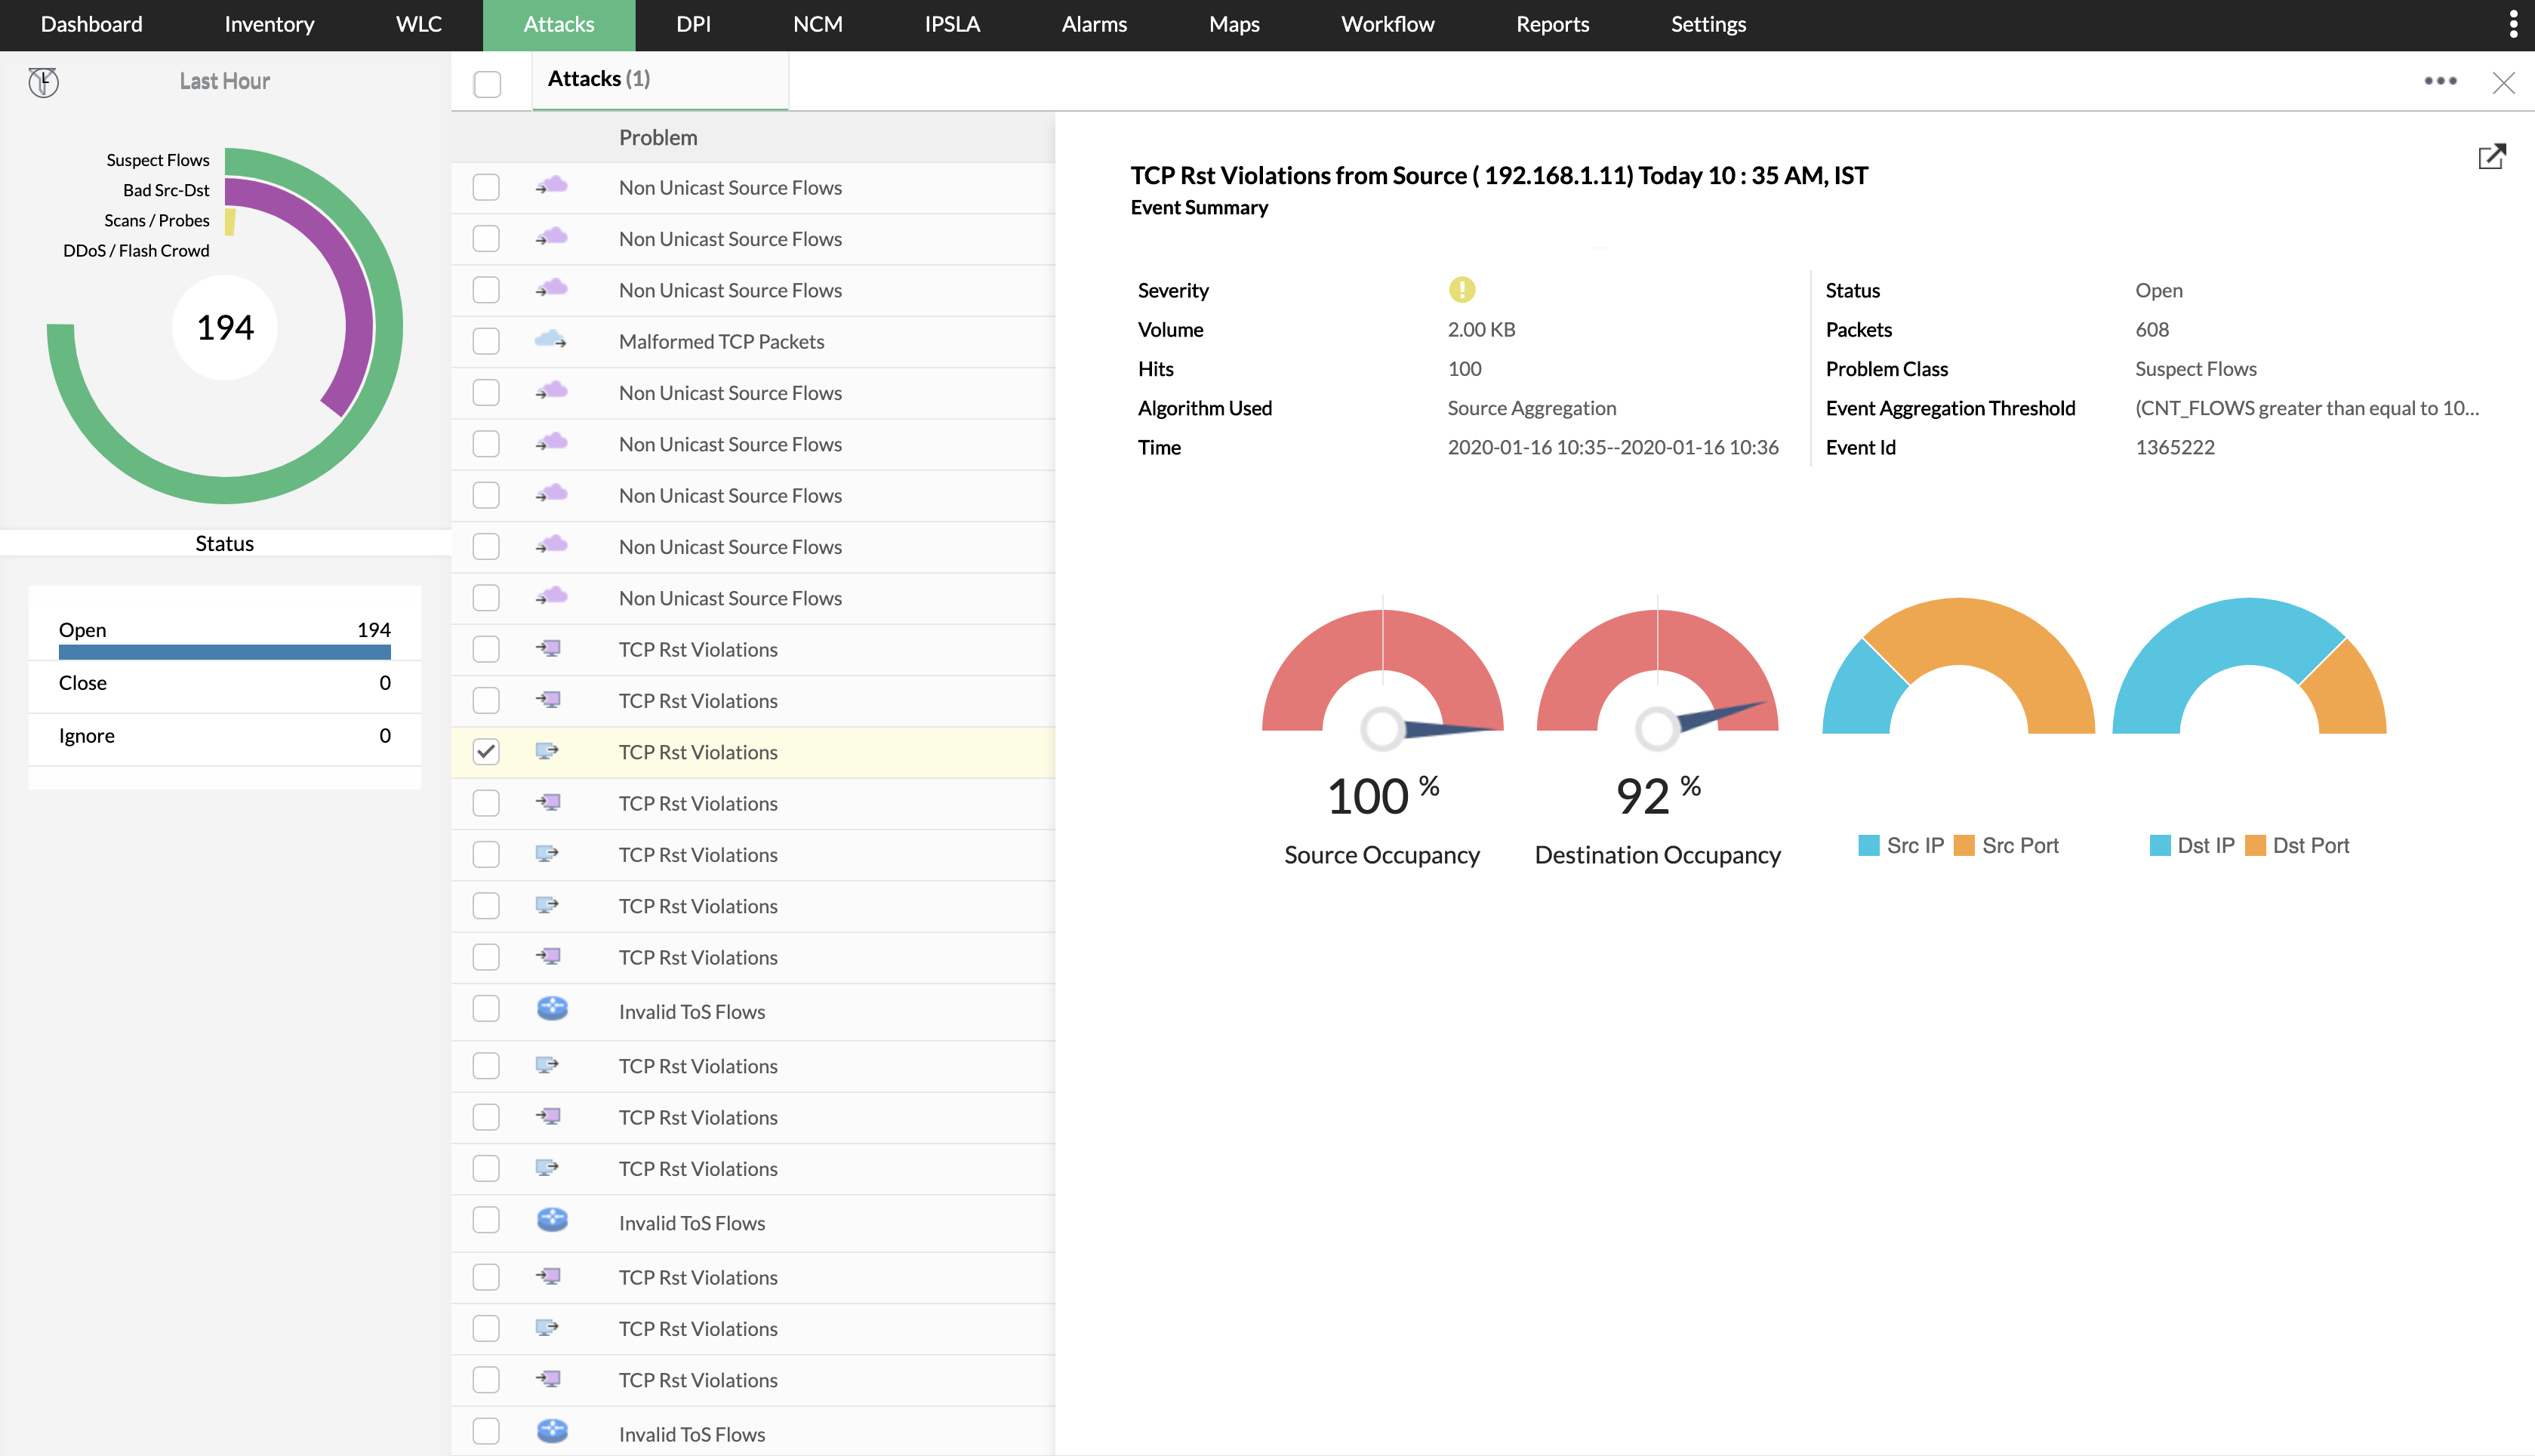  |