Overview
ProductRatingMost Used ByProduct SummaryStarting Price
Clear Analytics
Score 8.8 out of 10
Enterprise companies (1,001+ employees)
Clear Analytics is a business intelligence solution that enables non technical end users to perform analytics by leveraging existing knowledge of Excel coupled with a built in query builder. Some key features include: Dynamic Data Refresh, Data Share and In-Excel Collaboration.
$29
Per Seat per Month
Microsoft Power BI
Score 8.5 out of 10
N/A
Microsoft Power BI is a visualization and data discovery tool from Microsoft. It allows users to convert data into visuals and graphics, visually explore and analyze data, collaborate on interactive dashboards and reports, and scale across their organization with built-in governance and security.
$14
per month (billed annually) per user
Skyvia
Score 10.0 out of 10
Mid-Size Companies (51-1,000 employees)
Skyvia is a no-code cloud data integration platform for ETL, ELT, Reverse ETL, data migration, one-way and bi-directional data sync, workflow automation, and real-time connectivity. Benefits of Using Skyvia: • Cost efficiency: With flexible pricing plans for each product, Skyvia suites for businesses of any size. • Flexibility: Skyvia provides adaptable, no-code integration tools for both basic and advanced business…
$99
per month
Pricing
Clear AnalyticsMicrosoft Power BISkyvia
Editions & Modules
Personal
$29
Per Seat per Month
Team
$165
upto 10 Seat per Month
Department
$265
upto 25 Seat per month
Organization
$565
Upto 100 per seat per month
Power BI Pro
$14
per month (billed annually) per user
Power BI Premium
$24
per month (billed annually) per user
Basic
$99
per month
Standard
$199
per month
Professional
$249
per month
Offerings
Pricing Offerings
Clear AnalyticsMicrosoft Power BISkyvia
Free Trial
YesYesYes
Free/Freemium Version
NoYesYes
Premium Consulting/Integration Services
NoNoNo
Entry-level Setup Fee$800 Initial OnBoardingNo setup feeNo setup fee
Additional DetailsCertain Enterprise level features can be made available to Small Business edition at additional cost. Such services include Scheduler and OLAP connectivity. Custom adapters can also be created to connect to SaaS services.Power BI Desktop is the data exploration and report authoring experience for Power BI, and is available as a free download.20% discount for annual pricing.
More Pricing Information
Community Pulse
Clear AnalyticsMicrosoft Power BISkyvia
Considered Multiple Products
Clear Analytics
Chose Clear Analytics
I personally have not used other tools like this but Clear Analytics is a great one.
Chose Clear Analytics
Tableau something we use in previous with other clients. Heavy tool to use and customization is bit challenging. Also it's setup is bit complex when compare to Clear Analytics
Chose Clear Analytics
Clear Analytics provides a better organization of data that it gathers from different sources that can be utilized for various reporting purposes. Clear Analytics has better integration with different internal ERPs and needs lesser customization as such. Overall it's one of the …
Chose Clear Analytics
There are other great tools that are out there but Clear Analytics is reasonable for our business and provides a lot of features that we specifically needed.
Chose Clear Analytics
We didn’t choose this software because we found it didn’t adjust to what we really needed to do as a small business.
Microsoft Power BI
Chose Microsoft Power BI
Tableau having pure visuals, we can't make custom visuals. Power BI costs around $10 per month, but Tableau costs around $30-$40 per month, so comparing with Power BI it is costly. Using Power BI is very easy for everyone (technical/non-technical), but tableau is only can …
Chose Microsoft Power BI
Plotly has been used to create time-series charts that we are hosting internally. Sometimes, it hasn't been easy for us to set up a data gateway. (for security) To get an internal report, we used Plotly instead of Power BI. Plotly does require some JavaScript knowledge to …
Chose Microsoft Power BI
Microsoft Power BI has more templates and the control panel for modifying data visualizations is more powerful with more choices of line charts, bar charts, maps/scatter points than Google sheets, which is limited to simple bar charts and pie charts.
Chose Microsoft Power BI
We were able to bundle Power BI with other Microsoft products we rely on heavily. This and the customization options were the main sellers for us.
Chose Microsoft Power BI
All others apps are enablers and Microsoft Power BI is the visual that end user sees which often adds more value to the end user to make strategic decisions from this. All are equally great but Microsoft Power BI is the end result
Chose Microsoft Power BI
Microsoft Power BI vs. Tableau Power BI cheaper and works well with Microsoft tools. Tableau has better visuals but is costly. Microsoft Power BII vs. Looker Looker is good for big data, but Microsoft Power BI is easier to use. Microsoft Power BI vs. Qlik Qlik is fast for big …
Chose Microsoft Power BI
Microsoft Power BI provide a user friendly in many ways to analyse the data and visualization of the data .Stacking makes the works easier easily attach the table ,chart row and column through the various available tool ..it also reduces the work part and manpower mechanically …
Chose Microsoft Power BI
Microsoft Power BI is more flexible and it requires less effort in order to create a working environment. The results have an attractive and customizable display. The model is a star schema therefore it do not require specific database adaptation. Excel and csv files could be …
Chose Microsoft Power BI
Microsoft Power BI is free. If I didn't want to create a custom platform (i.e. my organization insisted on an existing platform that I *had* to use), I'd use Microsoft Power BI. For any start-up or SMB, I'd just use Claude & Grok to build it quickly, also for free. Would …
Chose Microsoft Power BI
Same need to be large scale.
Chose Microsoft Power BI
Microsoft Power BI is easier to learn, a lot of examples on YouTube, internet documentation books helps to the implementation and personalization of the dashboards easier to use than other platforms.
Chose Microsoft Power BI
While excel can be useful for a very quick data dump, Microsoft Power BI is able to bring that data to life, and show trends and the actual story of what is happening. Microsoft Power BI is the ultimate display tool, and allows us to share information quickly to the CORRECT …
Chose Microsoft Power BI
Compared to this tool, Microsoft Power BI doesn't involve heavy coding and provides user friendly interface to visualize data. Microsoft Power BI reports can be shared and published without exposing your source code. Also, the reports are interactive providing drill down …
Chose Microsoft Power BI
Power BI is much simple to use, and more modern than BusinessObjects, which has now been discontinued. It costs much less to license than Tableau which is perhaps more niche and designed better. It is also much more powerful for data analysis than excel, smartsheet, airtable, …
Chose Microsoft Power BI
Some of the strengths are 1. User-Friendliness 2. Self-Service BI (Caters to all levels of the employees 3. Cost-effective. 4. Easy integration with Microsoft Suits. 5. DAX Calculations 6. Familiar Interface like traditional Excel. 7. Easier Self-Service platform for …
Chose Microsoft Power BI
It's got a larger user base and seems better supported. Personally it feels like alot more work getting comparable results from Tableau. Microsoft Power BI will be WAY easier to work with all your various data sources, if you are working in an environment with M365 already. …
Chose Microsoft Power BI
After several years using Google Looker Studio and BigQuery, Microsoft Power BI is a step-up in terms of visualizations. It is also much more powerful, leading to less errors and has a more intuitive interface. Looker studio has a focus on google analytics whereas Microsoft …
Chose Microsoft Power BI
NA - did not use any other software, yet. Happy with the services and features provided by Microsoft Power BI which helps us navigate through the client requests on a daily basis while also providing actionable insights / solutions with maximum efficiency and that too in a …
Chose Microsoft Power BI
It's the most widely used tool in most organizations
Chose Microsoft Power BI
Each has a different function. I think Microsoft Power BI is easier to use than Tableau and cheaper but SQL and databricks have so much more versatility
Chose Microsoft Power BI
We use Microsoft Power BI in addition to other software.
Chose Microsoft Power BI
I prefer Power BI because of its affordability and fewer complicated tools than Tableau. It's easy to use and compatible with other Microsoft products, which are mostly used in the IT industry. It's not limited to only one platform like Looker Studio, which is mostly used in …
Skyvia
Chose Skyvia
Importing invoices into QuickBooks Online I was not able to do with SaasAnt.
Chose Skyvia
It's just a flexible, cost-effective tool for any budget, depending on the company's understanding of how to work with. That's our case.
Chose Skyvia
I see Skyvia is a great solution for those who want to migrate and transfer there data, especially sensitive and very important valuable data to data storage
Chose Skyvia
Compared to similar user-friendly data integration systems like Integrate.io, Stitch, or Azure, Skyvia still wins in the number of connectors and pricing policy. Skyvia is a tool for companies like ours, starving for simple but, at the same time, robust and cost-effective data …
Chose Skyvia
In comparison to Skyvia, the pricing for alternative solutions was exorbitant, despite offering similar functionality for our specific use case.
Chose Skyvia
This product is outstanding. Those who need to transfer data between different cloud platforms, apps, and databases would enjoy Skyvia.
Chose Skyvia
We'd recommend Skyvia as a pretty good solution for companies interested in optimal decision-making based on high-quality analysis.
Chose Skyvia
We have explored several solutions for data integration: SQL Server Integration Services by Microsoft and Snaplogic. Even though the latter has a free trial, we have realized that this solution is expensive and the same goes for the Microsoft tool. Skyvia is very …
Chose Skyvia
Some may only look for results, but it is very important how you do it, the reliability of the work including unexpected peaks, as well as the final cost. Skyvia allows the developer to integrate the how, having more scope and intervention in decision-making based on data …
Chose Skyvia
Skyvia is more cost effective and easy to set up for simple data transfers. It is also substantially faster and easier to set up on high volume data sets requiring incremental syncs. Because our use cases focus on supporting a range of clients who do not have the in-house …
Features
Clear AnalyticsMicrosoft Power BISkyvia
BI Standard Reporting
Comparison of BI Standard Reporting features of Product A and Product B
Clear Analytics
9.0
Ratings
10% above category average
Microsoft Power BI
8.2
Ratings
0% above category average
Skyvia
-
Ratings
Pixel Perfect reports9.00 Ratings8.10 Ratings00 Ratings
Customizable dashboards9.10 Ratings8.60 Ratings00 Ratings
Report Formatting Templates8.70 Ratings7.80 Ratings00 Ratings
Ad-hoc Reporting
Comparison of Ad-hoc Reporting features of Product A and Product B
Clear Analytics
8.9
Ratings
10% above category average
Microsoft Power BI
7.9
Ratings
1% below category average
Skyvia
-
Ratings
Drill-down analysis9.20 Ratings8.30 Ratings00 Ratings
Formatting capabilities8.70 Ratings7.70 Ratings00 Ratings
Report sharing and collaboration8.90 Ratings8.20 Ratings00 Ratings
Integration with R or other statistical packages00 Ratings7.40 Ratings00 Ratings
Report Output and Scheduling
Comparison of Report Output and Scheduling features of Product A and Product B
Clear Analytics
9.0
Ratings
10% above category average
Microsoft Power BI
8.0
Ratings
2% below category average
Skyvia
-
Ratings
Publish to Web9.00 Ratings8.10 Ratings00 Ratings
Publish to PDF9.10 Ratings7.80 Ratings00 Ratings
Report Versioning8.90 Ratings7.70 Ratings00 Ratings
Report Delivery Scheduling8.80 Ratings8.30 Ratings00 Ratings
Delivery to Remote Servers00 Ratings7.90 Ratings00 Ratings
Data Discovery and Visualization
Comparison of Data Discovery and Visualization features of Product A and Product B
Clear Analytics
9.0
Ratings
12% above category average
Microsoft Power BI
7.7
Ratings
4% below category average
Skyvia
-
Ratings
Pre-built visualization formats (heatmaps, scatter plots etc.)8.90 Ratings8.30 Ratings00 Ratings
Location Analytics / Geographic Visualization9.10 Ratings8.10 Ratings00 Ratings
Predictive Analytics00 Ratings7.20 Ratings00 Ratings
Pattern Recognition and Data Mining00 Ratings7.30 Ratings00 Ratings
Access Control and Security
Comparison of Access Control and Security features of Product A and Product B
Clear Analytics
9.3
Ratings
9% above category average
Microsoft Power BI
8.4
Ratings
1% below category average
Skyvia
-
Ratings
Multi-User Support (named login)9.40 Ratings8.70 Ratings00 Ratings
Role-Based Security Model9.00 Ratings8.20 Ratings00 Ratings
Multiple Access Permission Levels (Create, Read, Delete)9.40 Ratings8.20 Ratings00 Ratings
Report-Level Access Control00 Ratings8.20 Ratings00 Ratings
Single Sign-On (SSO)00 Ratings8.60 Ratings00 Ratings
Mobile Capabilities
Comparison of Mobile Capabilities features of Product A and Product B
Clear Analytics
8.6
Ratings
11% above category average
Microsoft Power BI
7.9
Ratings
2% above category average
Skyvia
-
Ratings
Mobile Application8.50 Ratings7.50 Ratings00 Ratings
Dashboard / Report / Visualization Interactivity on Mobile8.70 Ratings7.90 Ratings00 Ratings
Responsive Design for Web Access00 Ratings7.60 Ratings00 Ratings
Application Program Interfaces (APIs) / Embedding
Comparison of Application Program Interfaces (APIs) / Embedding features of Product A and Product B
Clear Analytics
-
Ratings
Microsoft Power BI
7.6
Ratings
2% below category average
Skyvia
-
Ratings
REST API00 Ratings7.80 Ratings00 Ratings
Javascript API00 Ratings7.40 Ratings00 Ratings
iFrames00 Ratings8.00 Ratings00 Ratings
Java API00 Ratings6.70 Ratings00 Ratings
Themeable User Interface (UI)00 Ratings7.30 Ratings00 Ratings
Customizable Platform (Open Source)00 Ratings8.40 Ratings00 Ratings
Data Source Connection
Comparison of Data Source Connection features of Product A and Product B
Clear Analytics
-
Ratings
Microsoft Power BI
-
Ratings
Skyvia
9.6
Ratings
15% above category average
Connect to traditional data sources00 Ratings00 Ratings9.60 Ratings
Data Transformations
Comparison of Data Transformations features of Product A and Product B
Clear Analytics
-
Ratings
Microsoft Power BI
-
Ratings
Skyvia
9.3
Ratings
14% above category average
Simple transformations00 Ratings00 Ratings9.30 Ratings
Data Modeling
Comparison of Data Modeling features of Product A and Product B
Clear Analytics
-
Ratings
Microsoft Power BI
-
Ratings
Skyvia
9.4
Ratings
18% above category average
Data model creation00 Ratings00 Ratings8.80 Ratings
Business rules and workflow00 Ratings00 Ratings10.00 Ratings
Best Alternatives
Clear AnalyticsMicrosoft Power BISkyvia
Small Businesses
Yellowfin
Yellowfin
Score 8.6 out of 10
Yellowfin
Yellowfin
Score 8.6 out of 10
InterSystems IRIS
InterSystems IRIS
Score 8.1 out of 10
Medium-sized Companies
Reveal
Reveal
Score 10.0 out of 10
Reveal
Reveal
Score 10.0 out of 10
IBM InfoSphere Information Server
Score 8.0 out of 10
Enterprises
Kyvos Semantic Layer
Score 9.5 out of 10
Kyvos Semantic Layer
Score 9.5 out of 10
IBM InfoSphere Information Server
Score 8.0 out of 10
All AlternativesView all alternativesView all alternativesView all alternatives
User Ratings
Clear AnalyticsMicrosoft Power BISkyvia
Likelihood to Recommend
9.0
(0 ratings)
8.5
(0 ratings)
10.0
(0 ratings)
Likelihood to Renew
-
(0 ratings)
9.6
(0 ratings)
-
(0 ratings)
Usability
9.1
(0 ratings)
8.3
(0 ratings)
9.4
(0 ratings)
Support Rating
9.5
(0 ratings)
10.0
(0 ratings)
9.9
(0 ratings)
Implementation Rating
-
(0 ratings)
9.0
(0 ratings)
-
(0 ratings)
User Testimonials
Clear AnalyticsMicrosoft Power BISkyvia
Likelihood to Recommend
Clear Analytics has almost all the features which are mostly required by the organizations for their data analytics and transformation activities. Clear Analytics is built on the support of a parallel query engine which makes it handle large volume requests and also provides optimized results. However, every solution has some limitations, Clear Analytics lacks advanced features such as Predictive Analytics which is a very demanding feature in the market as most organizations are adopting AI/ML automation for their businesses. Also, it needs to add a lot of advanced visualizations so that the user has the choice of selection. Overall a good solution to be recommended.
Read full review
Microsoft Power BI is great for sales tracking, financial reporting, and real-time operations monitoring. It integrates data from multiple sources, creating interactive dashboards for better decision-making. However, it's less ideal for real-time big data processing, offline access, or when deep customization is needed. It works best for structured reporting but struggles with highly complex data models.
Read full review
A great tool for both prototyping and developing models to extract or query of data. When you don't have a specialised developer for pulling data, Skyvia is great solution. Very affordable for us. We did not find any areas where Skyvia let us down so very happy to recommend it to other users.
Read full review
Pros
  • Integrates directly with Power BI and Excel
  • Helps wrangle, filter and visualize data
  • Presentation of large data in a summarized manner
Read full review
  • It is great at taking in large amounts of data and housing it all.
  • Microsoft Power BI is so user friendly and it's dashboards are very easy on the eye.
  • The ease of sharing dashboards makes it great for use across a large company.
Read full review
  • Skyvia is good at scheduled bidirectional data integration to/from multiple sources
  • The mapping is done automatically which saves a lot of time
  • I like that all connectors are included in the price, so I don't have to pay for using some new ones additionally
Read full review
Cons
  • For Charts and Graphs , getting the Power Point Deck would be helpful. As of now we use the data from Excel Reports
Read full review
  • It would be easier for users could Microsoft Power BI and Excel used the same programming languages.
  • Would like to see the online version of Microsoft Power BI be as powerful as the desktop version.
  • Publishing a Microsoft Power BI file online and then having to save the file is somewhat redundant.
  • Would like to export each page or chart as an image.
Read full review
  • If there's something they can improve could be cheaper prices for LaTam
  • They can market their services in a larger scale, globally.
  • They can market their services in a larger scale, globally.
Read full review
Likelihood to Renew
No answers on this topic
Microsoft Power BI is an excellent and scalable tool. It has a learning curve, but once you get past that, the sky is the limit and you can build from the most simple to the most complex dashboards. I have built everything from simple reports with only a few data points to complex reports with many pages and advanced filtering.
Read full review
No answers on this topic
Usability
I have really enjoyed working with Clear Analytics. This platform has contributed to increased production and reliable data control processes. It has flexible user interface that can be operated by any organization member. Reports are shared on simple and transparent way in the dashboard for easy access. Data analytics from all departments have created manageable working environment that have increased production.
Read full review
Takes a little bit to get used to it. Not natively intuitive but fairly straight forward to pick up. Also docking it a few points because you can create a really clean, simple UI in Claude very quickly that's faster than building all of this yourself in Microsoft Power BI.
Read full review
Loved using Skyvia for our projects, it saved time, allowed us to reach the desired outcome quickly and was easy to maintain. When we first used it we weren't sure we would be able achieve the outcome desired but during the trial it was quickly obvious we would be able to achieve what we needed for data connection and reporting.
Read full review
Support Rating
Clear Analytics has very good team members in Consulting as well as in Customer Support. The support agents are capable of providing the required resolution of your queries in a timeline provides. They have a clear understanding of the product and its features, and they are friendly in nature. However, for some advanced or level 2/3-based queries, they required some more time to respond, which is ok.
Read full review
It is a fantastic tool, you can do almost everything related with data and reports, it is a perfect substitutive of Power Point and Excel with a high evolution and flexibility, and also it is very friendly and easy to share. I think all companies should have Power BI (or other BI tool) in their software package and if they are in the MS Suite, for sure Power BI should be the one due to all the benefits of the MS ecosystem.
Read full review
I think guys have a really good support team, and even from different time zones we managed to get worthy support.
Read full review
Implementation Rating
No answers on this topic
It was integrated with our erp easily and was accessible on cloud.
Read full review
No answers on this topic
Alternatives Considered
We didn’t choose this software because we found it didn’t adjust to what we really needed to do as a small business.
Read full review
All others apps are enablers and Microsoft Power BI is the visual that end user sees which often adds more value to the end user to make strategic decisions from this. All are equally great but Microsoft Power BI is the end result
Read full review
Compared to similar user-friendly data integration systems like Integrate.io, Stitch, or Azure, Skyvia still wins in the number of connectors and pricing policy. Skyvia is a tool for companies like ours, starving for simple but, at the same time, robust and cost-effective data transfer solutions. It doesn't require additional knowledge for implementation and usage because it's no code. We'd recommend Skyvia as the best solution for non-technical staff.
Read full review
Return on Investment
  • Super useful to get started immediately
  • Didn't have to rely on migrating data
  • Easy to add members
  • Easy to learn and build charts
Read full review
  • We're still early in the adoption process at this company, but we've illustrated how bad data keeps us from being more productive. ~25% of a team's work week was dedicated to effectively cleaning up entries, but it was always seen as a normal to them.
Read full review
  • The core of our business lies in analyzing data from various sources, and while ETL itself is not our primary focus, it is a necessary process to achieve our goals. Thanks to Skyvia, we are able to streamline the ETL process at a reasonable price, allowing us to dedicate our efforts to data analysis without the burden of ETL complexities.
Read full review
ScreenShots

Clear Analytics Screenshots

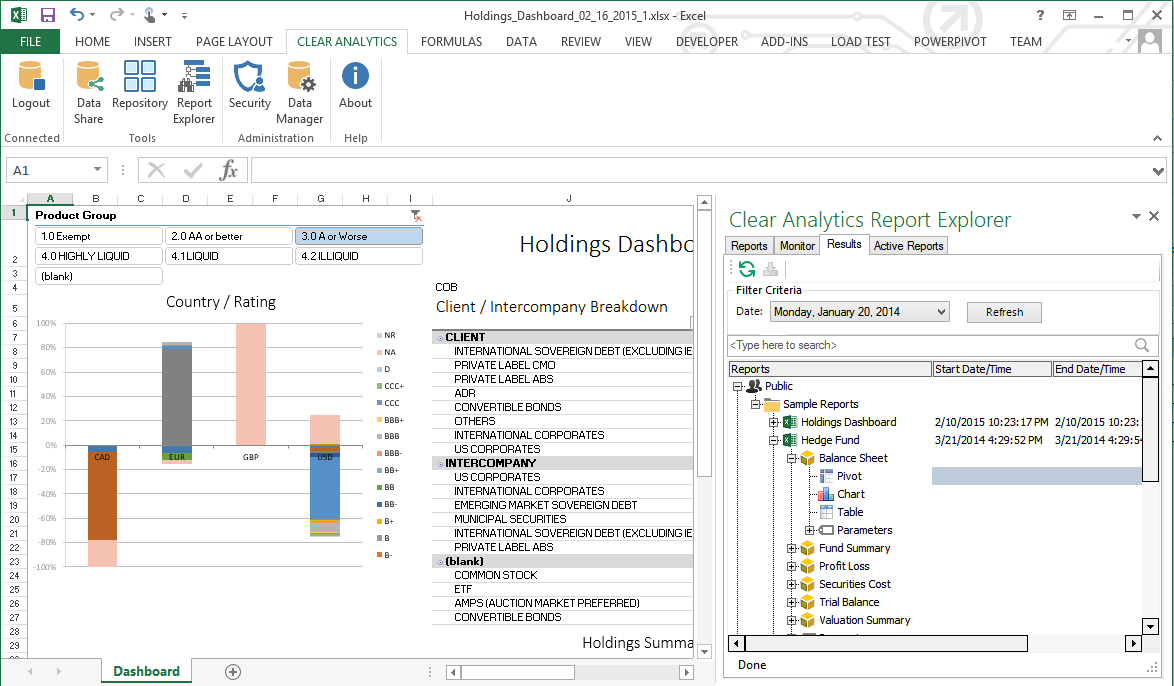
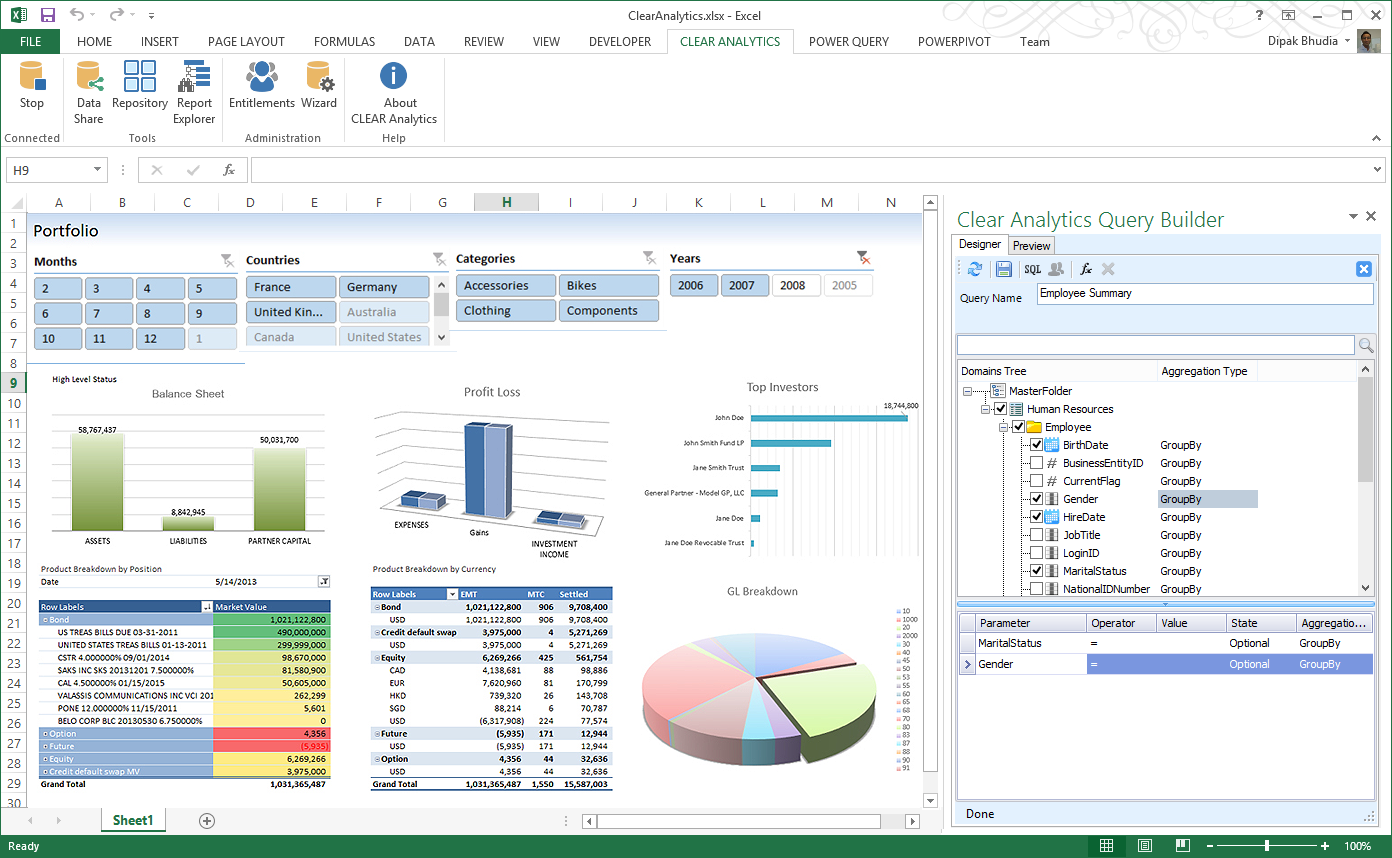
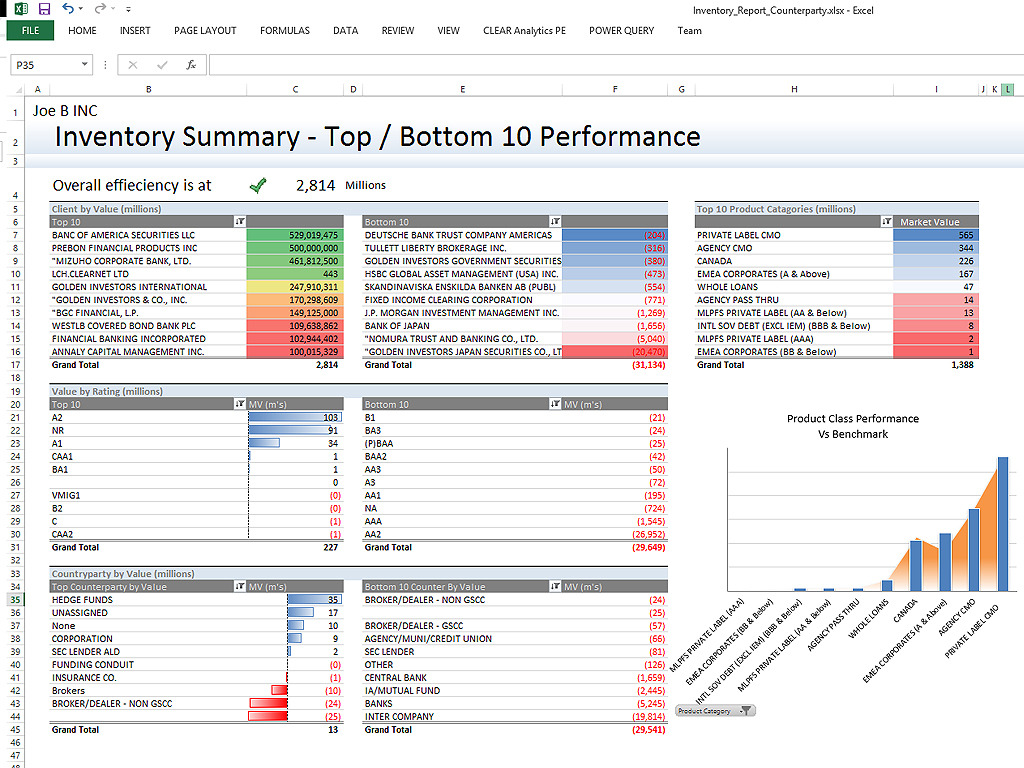
Screenshot of Clear Analytics integrated Excel panel essentially transforms standalone Excel into an enterprise strength, fully auditable, collaborative and centralized business intelligence platform.Screenshot of Users have the ability to dynamically query systems and render that data in any way they like.  No more waiting on IT to create reports.Screenshot of Your firms existing knowledge of Excel enables the firm to be product from day 1. Use the skills already present in your organization and don't pay for outside reporting consultants to create reports for you.Screenshot of Leverage the integration capability of Microsoft's Power BI to extend the reach of your data to web and mobile devices.Screenshot of Leverage all of Excels capabilities, from it's slicers to miniature spark-line charts to create incredibly informative and responsive dashboards.

Microsoft Power BI Screenshots

Screenshot of Microsoft Power BI - Turns insights into impact for business usersScreenshot of Power BI integrates easily with Microsoft 365Screenshot of Microsoft Power BI - AI-Powered CapabilitiesScreenshot of Microsoft Power BI - Copilot can be used to create reportsScreenshot of Microsoft Power BI - Data HubScreenshot of Microsoft Power BI - Scales as organizational needs grow

Skyvia Screenshots

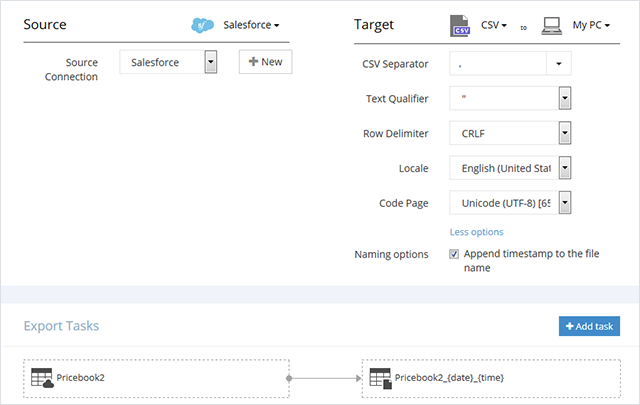
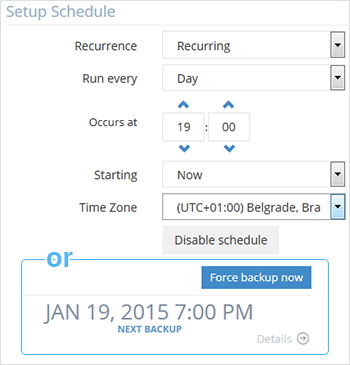
Screenshot of ExportScreenshot of QueryScreenshot of Backup ScheduleScreenshot of Integration