Dynatrace is an APM scaled for enterprises with cloud, on-premise, and hybrid application and SaaS monitoring. Dynatrace uses AI-supported algorithms to provide continual APM self-learning and predictive alerts for proactive issue resolution.
$0
per synthetic request
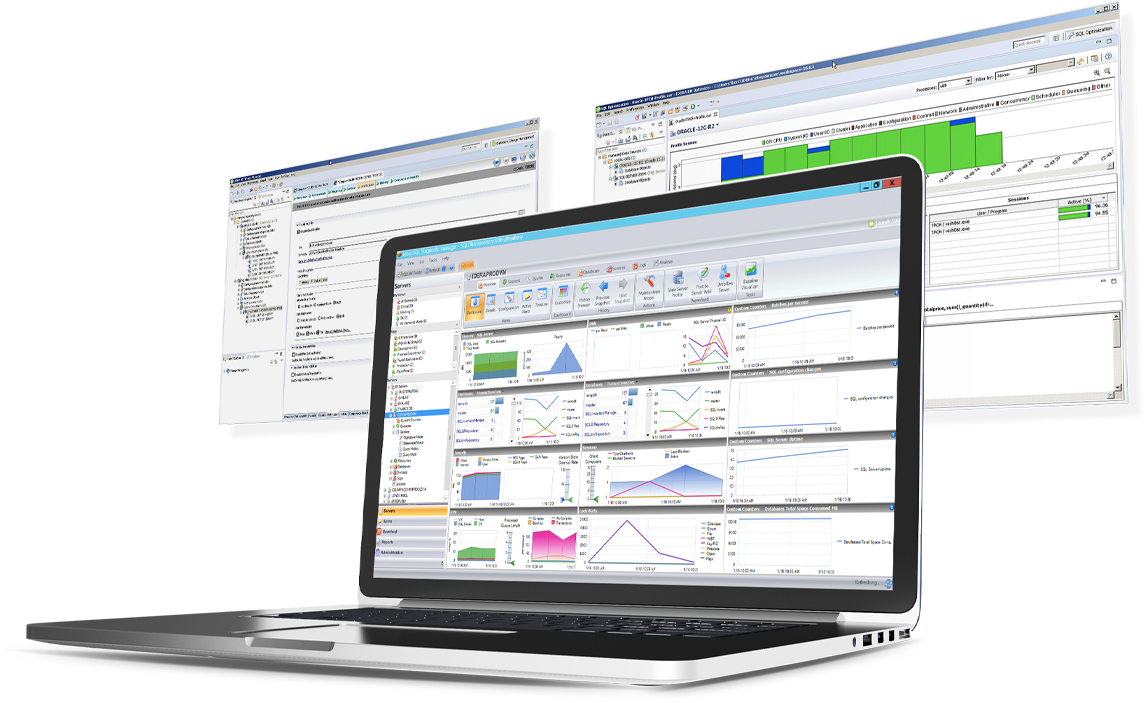
IDERA SQL Diagnostic Manager
Score 8.0 out of 10
N/A
SQL Diagnostic Manager for Microsoft SQL Server helps database administrators to find and fix Microsoft SQL Server performance problems in physical, virtual, and cloud environments. Unlike its competition, it provides effective scalability, advanced SQL query analysis and optimization, prescriptive analysis with corrective SQL scripts, powerful automated alert responses, broad PowerShell integration, complete customization, and extensive support for current and legacy Microsoft SQL Server and…
$1,996
per instance with first year maintenance included
Pricing
Dynatrace
IDERA SQL Diagnostic Manager
Editions & Modules
Synthetic Monitoring
$0.001
per synthetic request
Kubernetes Platform Monitoring
$0.002
per hour for any size pod
Real User Monitoring
$0.00225
per session
Application Security
$0.018
per hour for 8 GIB host
Infrastructure Monitoring
$0.04
per hour for any size host
Full-Stack Monitoring
$0.08
per hour for 8 GIB host
Standard via eCommerce
1,996.00
per instance with first year maintenance included
Offerings
Pricing Offerings
Dynatrace
IDERA SQL Diagnostic Manager
Free Trial
No
Yes
Free/Freemium Version
No
No
Premium Consulting/Integration Services
No
No
Entry-level Setup Fee
No setup fee
No setup fee
Additional Details
—
—
More Pricing Information
Community Pulse
Dynatrace
IDERA SQL Diagnostic Manager
Considered Both Products
Dynatrace
Verified User
Anonymous
Chose Dynatrace
Single Agent deployment AI analysis that provides insight discovery and pure path Able to analyst performance data quickly and next hop.
New relic was mostly like readonly dashboard and restricted how we slice and dice the data presented to us. Ability to drill down was seriously limited.
Dynatrace UI seems better compared to splunk also DT gives better flexibility in terms of plans and costs. For logging monitoring we are using splunk and splunk is better for that purpose. But hosts and server monitoring and alerting perspective Dynatrace is better. Dynatrace …
Dynatrace gives the overall picture of the application usage and performance by default with minimal configurations whereas in Datadog a lot of manual intervention is required to analyze the application performance and troubleshooting the issues. Dynatrace is user-friendly when …
Dynatrace has three key points: ease of deployment, ease of access and a very low learning curve. Also the info provided by the DT agents are easy to understand and relate to root cause. Also the user interface is very simple and can be configured/shared to provide the data to …
We selected Dynatrace because it is much more modern and depends on AI, on auto-discovery, and other features, making it really a next-gen monitoring solution. It is not easy to on-board to Dynatrace, as it has an extremely steep learning curve. It is also possible that other …
Some of these tools we use alongside Dynatrace, and others we chose Dynatrace over. Since Ruby is not a Dynatrace supported language, we use New Relic to monitor those applications. We are an AWS shop so naturally, we use CloudWatch metrics for things like auto-scaling where it …
I have used a plethora of Application Performance Management (APM) tools, all have their niche. Dynatrace provides the best-in-class experience for support, operations, and platform engineering teams. In addition, access for my Enterprise Development teams has been critical. …
BMC was only a basic APM with not much detail or drilling into the issue. It only showed there was a problem with the host. Before Dynatrace, to troubleshoot an issue we had to log into different consoles for different applications and review logs. Now with a quick visual and a …
The Dynatrace product was much more feature-rich than New Relic. We went through multiple proofs of concepts with each vendor using our actual system. We found that both did some things the same but in other areas, the Dynatrace product was much better. There was a black box …
Dynatrace is much more expensive than Pingdom, but it does a better job of doing synthetic monitors and the credential store is much better. When it comes to availability it does a better job of creating of synthetic monitors and it can create a credential store which is a big …
I have not evaluated any other monitoring products. Our company has evaluated other products that have not stacked up against Dynatrace. Dynatrace has deeper monitoring than others and provides excellent alerting capabilities. Dynatrace was selected for those features as well …
Dynatrace provides the best insights into our environment from end to end. It provides user sessions throughout the application so, we can see exactly what users are doing and potentially not only fix problems but provide improvements before any issues arise. There is no …
IDERA SQL Diagnostic Manager for SQL Server is an excellent tool, however I think Solarwinds Database Perfromance Analyzer is a slightly stronger more well rounded product
IDERA SQL Diagnostic Manager for SQL, Redgate SQL, and MonitorLogicMonitor are similar products to each other. We decided on IDERA SQL Diagnostic Manager for SQL because our experience with locating heavy queries has been very good and it provides real-time monitoring of all …
SQL Server [Business Intelligence] Manager works well with Microsoft products. It has several advanced features along with dashboards and alerts that can be configured to user's need.
All the toolsets we looked at have the same basic feature sets. We felt like IDERA SQL Diagnostic Manager for SQL Server had more features (SQL Doctor features) and better historical features. More toolsets now have a lot of these features, but for eight years, IDERA SQL …
SQL Server Business Intelligence Manager does what SQL Server Management Studio should already do natively. So it actually fills up important gaps Microsoft left in its product.
We compared SQL Server Business Intelligence Manager to our current tool Solarwinds Database Performance Analyzer. Where Solarwinds was deficient, SQL BI manager filled the gap. At the end of the day they were both different tools with different purposes so we concluded it was …
Dynatrace is well suited to a number of tasks. It is important to determine who the end users are and gather good information to tailor their experience accordingly. For instance, business/marketing should not have access to some of the more technical data, and business metrics can be a distraction for IT operations personnel.
If you have several SQL servers and don't have a lot of time or resources to constantly monitor them, SQLdm will be very helpful. For one or two servers, it might be overkill. All of our servers are virtual, so having a tool that can monitor host metrics as well as guest metrics is a plus as well.
We loved Dynatrace's ability to show the data flow - from the front end points through the back end points straight to the database and various API's. It was advanced in its data visualization. This is useful for debugging - showing when/where the errors are. It can even enable non-technical individuals in the corporation to help debug
Dynatrace has some great highly customizable integration options as well as monitoring. You can configure your layout & integration options to create custom monitoring alerts for your applications performance. Further you can increase the extensibility of using a REST API on your architecture.
Some advanced dev-ops systems are utilizing Kubernetes/docker aswell as Node.JS - Dynatrace was able to log and help understand all of our dev-ops needs. It gave us native alerts based off of deviations from the baseline that we set during initial configuration. These metrics are priceless.
SQLdm does a good job of providing information at a high level, but also allows me to drill down to specific queries and events if needed. I don't always need to sift through tons of details to get the information I need. It also gives a very wide range of information from SQL specific metrics, to OS metrics, to VM metrics, all the way up to host server metrics.
I like how the alert and notification system can be customized. For example, if you know a certain server regularly has long-running queries, you can adjust the alert to not fire unless a query has been running for 30 minutes while the rest of the servers fire after 30 seconds. That is very helpful in not being bombarded at dinner with alerts from a server similar to, "I've been at 90% cpu for 26 milliseconds!!!!!!!...and now it's back down to 30%" Good information to know, but not something you need to literally lose sleep over.
I like how you can configure different servers to be monitored differently. For example, you can have a group of servers called DEVELOPMENT that you can turn on heavier monitoring on so you can test how changes in applications might affect the SQL environment, but in the PRODUCTION group, you may only want to enable the heavier analysis and logging when performance issues are actively being reported.
Dynatrace does not monitor easily on a C-based application.
The way DPGR is addressed by Dynatrace is not very complete, and not clear. One thing is to mask the IP and request attributes but is not enough, the replay session feature is great but raises serious questions about user tracking.
Windows client has some issues. When you have small time intervals for your data collection, it can cause the client to become unresponsive and require you to restart it.
It takes more time to get the web client running than it does to get the windows client running.
The visualizations have been the same for the last eight years--could use a little bit of a refresh.
We have got tremendous support and response from the dynatrace support team as well as the larger community. We still have issues like the lack of role based administration, but we are told that it may be coming in a future release. The team is very supportive and has assisted us in several tough situations.
Dynatrace is great to use once you understand how to use it correctly and get used to the layout of it. While I do not actively use it every day, whenever I do use it, I do have to get refamiliarized with it. However, once you have your dashboards setup correctly with the data that you want to see when you first login to Dynatrace, it's amazing.
I wish I could have given the ten points but based on my experience in past I am reducing by two points as the penalty. But I am sure that it will have improved in the past few months. They need some improvement on ticket handling. Overall I appreciate some of the support folks who responded quickly and also were ready to jump on the Webex and get the problem understood to fix it.
Like I mentioned earlier, Dynatrace is a great tool but comes with a heavy price tag. On the other hand, Foglight offers a slightly lower level of expertise in application monitoring but fulfils almost all the requirements you would commonly have. The only major feature lacking in Foglight is the predictive monitoring feature. If you are an SME struggling with budgets, then predictive monitoring is something you can certainly live without.
SQL Server [Business Intelligence] Manager works well with Microsoft products. It has several advanced features along with dashboards and alerts that can be configured to user's need.