Grow, from Epicor since the March 2022 acquisition, is a business intelligence software that is designed to empower businesses to become data-driven and accelerate growth by aligning team objectives and inspiring strategic decisions.
N/A
ThoughtSpot
Score 8.5 out of 10
N/A
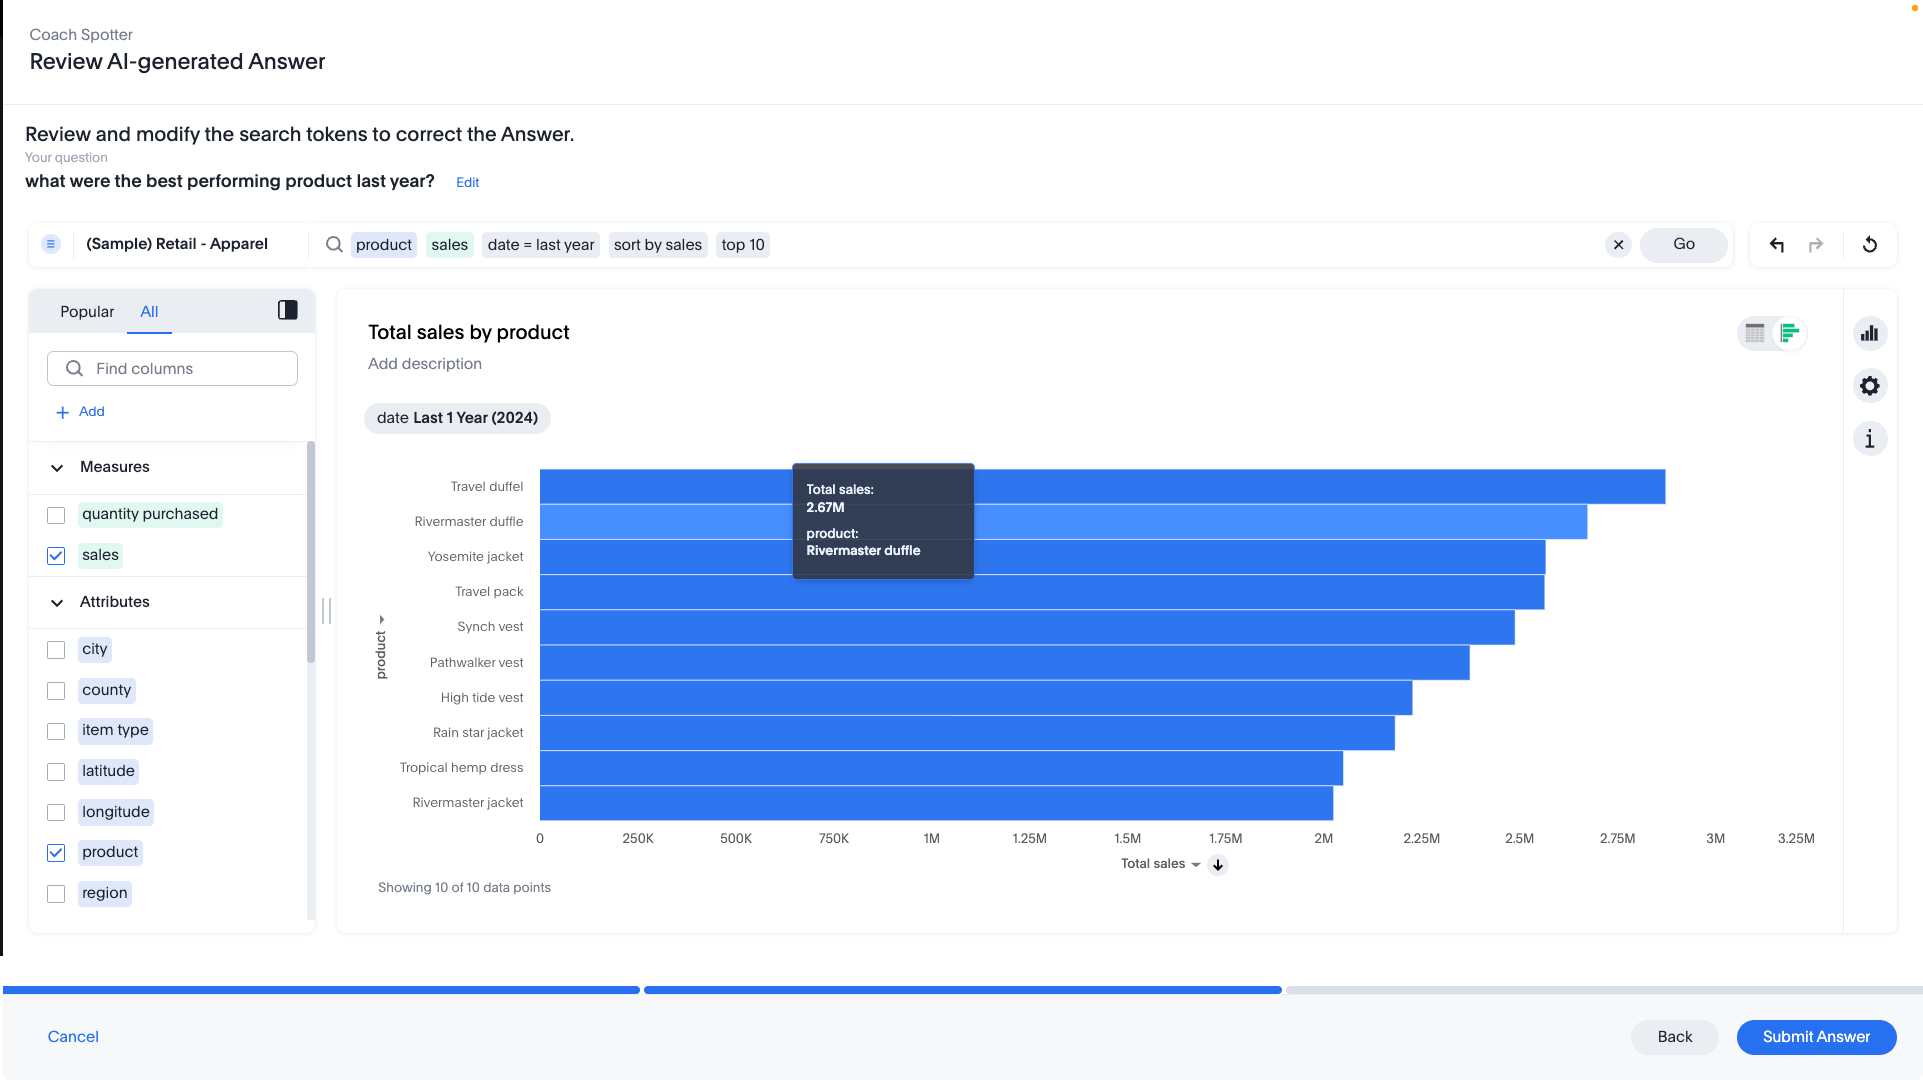
ThoughtSpot is an Agentic Analytics Platform for enterprises where users ask data questions using natural language and get answers with AI. Code-first for data teams and code-free for business users, ThoughtSpot can handle large, complex cloud data at scale.
$1,500
per year (5 users)
Pricing
Epicor Grow
ThoughtSpot
Editions & Modules
No answers on this topic
Thoughtspot Analytics - Pro
$50
per month (billed annually) per user (25-1000 users)
Thoughtspot Analytics - Enterprise
Custom
Offerings
Pricing Offerings
Epicor Grow
ThoughtSpot
Free Trial
Yes
Yes
Free/Freemium Version
No
Yes
Premium Consulting/Integration Services
Yes
Yes
Entry-level Setup Fee
Required
Optional
Additional Details
—
—
More Pricing Information
Community Pulse
Epicor Grow
ThoughtSpot
Features
Epicor Grow
ThoughtSpot
BI Standard Reporting
Comparison of BI Standard Reporting features of Product A and Product B
Epicor Grow
8.0
32 Ratings
2% below category average
ThoughtSpot
7.3
89 Ratings
11% below category average
Customizable dashboards
9.032 Ratings
8.289 Ratings
Report Formatting Templates
7.025 Ratings
7.725 Ratings
Pixel Perfect reports
00 Ratings
6.021 Ratings
Ad-hoc Reporting
Comparison of Ad-hoc Reporting features of Product A and Product B
Epicor Grow
7.7
31 Ratings
4% below category average
ThoughtSpot
7.5
91 Ratings
7% below category average
Drill-down analysis
7.027 Ratings
8.590 Ratings
Formatting capabilities
7.028 Ratings
7.290 Ratings
Report sharing and collaboration
9.030 Ratings
8.788 Ratings
Integration with R or other statistical packages
00 Ratings
5.849 Ratings
Report Output and Scheduling
Comparison of Report Output and Scheduling features of Product A and Product B
Epicor Grow
6.7
29 Ratings
20% below category average
ThoughtSpot
8.3
84 Ratings
1% above category average
Publish to Web
7.025 Ratings
8.255 Ratings
Publish to PDF
7.025 Ratings
8.678 Ratings
Report Delivery Scheduling
6.025 Ratings
8.464 Ratings
Report Versioning
00 Ratings
7.918 Ratings
Delivery to Remote Servers
00 Ratings
8.135 Ratings
Data Discovery and Visualization
Comparison of Data Discovery and Visualization features of Product A and Product B
Grow.com is well suited if you have a lot of data or client data to manage. If you do not have tons of data, there are other options out there that are a bit more simple and easy to use and a better price.
It is well suited when the same data is consumed by many different people with different analytics and visualization requirements because, if you have the data available in ThoughtSpot, every user can prepare different views. Also, it is a good reporting tool, you can get rid of slides if you have a good dashboard prepared, gaining flexibility and agility.
I love the fact that you have a team of developers who can help me build metrics or fix metrics that I do not create properly. I had to learn SQL in order to really build the metrics that mattered, which was a lot of fun, but resulted in many broken metrics. The vendor's team was great in responding to me requests for help!
Really, really appreciate the fact that Grow has SQL formulas to reference when building metrics. Again, as a novice, this accelerated my ability to learn and not have to leave your site and resources and stay within the Grow web properties.
Great account managers who check in regularly and are willing to help out whenever needed.
Beautiful visualizations. The visuals are distinct, clean, and easy to discern from one another.
Intelligent querying functionality. When looking to manipulate the data, the search function makes it easy to manipulate the features in the data, along with aggregating them in the way you'd like.
Embedding! It has been a smooth process thus far for our product & technical teams to work with ThoughtSpot and bring it into our product.
It would be great if ThoughtSpot can add the feature to filter by clicking on visualizations. i.e if I click on a particular data point in the chart if the full dashboard can filter just for that particular data point.
Color coding the heatmap with different colors like green to orange to red.
I give it just waiting because passport is brilliant and it has helped our organisation In advancing to the next stage in the age of AI. It has allowed or non-tech people to better service and clients in a cost-effective way. George port has allowed us to create new products for us and for our clients increasing our revenue streams and reducing clients churn
This tool is definitely a little bit difficult to be able to figure out at first, but after some time of learning you can definitely pick it up. I do wish there were more resources online that would be able to help speed up the learning process
The rating is because of the ease of use of the interface as it has a no code interface that makes it easy to setup data pipelines without extensive programming. Cloud native integration: It integrates seamlessly with cloud based data warehouses. Automated data loading, Scalability, Cost Effective, Transformations, Data Governance and security.
The support team is very helpful and in every situation we have needed help in, they have been able to assist. So I have had a good experience with them
I give it this meeting because the team is not only help able to help us in the current solutions but also amazing and taking feedback and feeding it back to their development team which includes more products and features into ThoughtSpot
Grow doesn't have as many advanced analytics features and other capabilities as some other 'dashboard' platforms on the market. Simply, if you want a tool for internal use only that has high-level analytics capabilities (regressions, completely custom visualizations, modeling), Grow probably isn't the platform for you. To put it another way, if you have a team of data engineers and scientists doing complex analysis, Grow might not make the most sense. However, if you understand the value of data/visualization/dashboards, but lack some of those skillsets in your company, Grow might be the perfect fit. Not only is it incredibly scalable and reasonably priced compared to other market solutions, but their transform capabilities really stand out. They have many native data transformations that mimic SQL coding of a dataset, without requiring any knowledge of SQL. They've converted these transformations to easy-to-use tools in the platform, which are perfect for the less-technical user.
We also explored Tableau Ask Data. Tableau is our standard for BI in our organization. We want to use the smallest amount of tools in our company to have the best adaption. ThoughSpot will fill a few gaps that we have with our current set up and will also enhance out offering for our employees in the transition of being more data driven within in near future
Because it is very reliable, inside the situation, we need strong internet connection to access a lot of data but easily never had any downtime except during the upgrades
Time to market ROI is massive vs hiring the full-time dedicated team to build and maintain a frontend multi-tenant SaaS data viz product.
It will be interesting to see over time how the advanced features play out in terms of usability and end value, such as Natural Search, which we are very excited about, and the machine learning tools.