Instana, an IBM company since the December 2020 acquisition, provides APM services for SOA, microservices, containerized applications and Kubernetes, and cloud native applications, as well as discovery and monitoring for IT assets.
$75
per month per Managed Virtual Server (MVS)
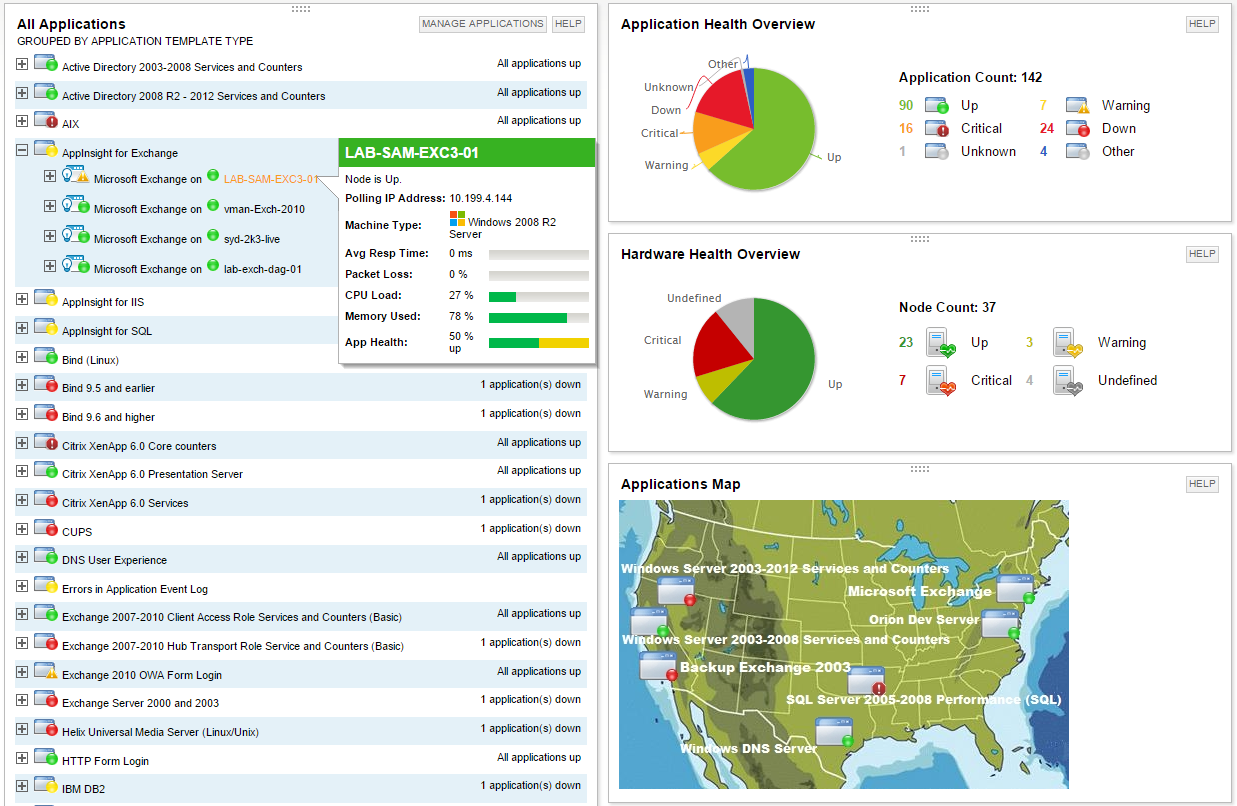
SolarWinds Server & Application Monitor
Score 7.7 out of 10
N/A
SolarWinds Server & Application Monitor (SAM) delivers application and server monitoring capabilities. SAM allows for self-service for easy setup, 1200+ monitoring templates, and customization options, as well as integrate with other SolarWinds products.
With enterprise IT assets in a multitude of ecosystems, cloud infrastructures and sometimes still left stuck in a legacy on prem architecture, IBM Instana makes it easy to get the right data to drive development and / or DevSecOps processes with tangible input from the target environment itself.
It is a well-suited software for monitoring and surveillance of your deployed nodes. The error-readability and filter options for filtering out logs and errors could be improved. But overall, it has a good UI design, is user-friendly, and is very easy to learn and access for new users.
Can monitor application(s) and system(s) with very large throughput of transactions by the second ( it gets everything !!!)
Provide strong drill down for your applications and will tell you where the points of failure of an application's is ( servers , network , Databases , etc you name it )
Very easy to set up and have it up and running when using the SaaS solution. There's an on premise solution which works just as well but requires more effort and preparation from an infrastructure point of view for your teams to implement.
Continuously improve their features and their agents auto-update and keep up. All while not interfering with your applications.
Let's you create your own dashboards and visualizations that can be tailored for different kind of users with the data collected.
Create your own events and smart alerts so you can know on the spot if something is happening or is likely to happen that needs addressing on your applications / systems
It's very difficult to create custom dashboards, only a handful of scenarios can be visualized to dashboards.
Extracting information from Instana to further analysis into excel for example is something that can be improved. Using an API to get data is very limiting.
Open telemetry features which allow to send application data to Instana is not working as documented.
Instana has been able to fulfill our all requirement and provide out of box solution for multiple component like AWS RDS Monitoring and real time alerting setup on basis of that. it is also easy to integrate with other open-source alerting and monitoring tools which makes it easier to incorporate into our solutions
We are heavily invested in Solarwinds products for a reason. They are generally easy to setup and run with, requiring only some interfacing with support or help articles on rare occasions. They do what we bought them to do and we can't ask for more.
IBM Instana totally alters our monitoring approach since it increases the stability of the system and simplifies the process of problem solving. And since it helps to lower the degree of alert exhaustion that we experience, it is a total game changer for us.
SolarWinds Server & Application Monitor is quite easy to use and super versatile. It allows you to do just about anything you can through premade templates or through scripting. You can use an agent on the servers if you want to, or you can monitor through WMI or SNMP credentials. You can customize thresholds for alerting quickly, and you can configure alerts to be as complex or as simple as you want.
The graphical interface and the performance of the database leave a little to be desired, they could be better explored.Some functionality and screens do not work well depending on the browser used. The integrations never had any problems or caused crashes in other systems.
I think there was only a couple times I had to open a support case for SAM and one time they got multiple engineers on the phone to get a better idea what I was trying to monitor and was able to point me in the best direction to monitor that system.
As a DevOps engineer, I've explored various Application Performance Monitoring (APM) tools, including New Relic for real-time insights, AppDynamics for code-level visibility, Dynatrace for AI-driven monitoring, Datadog for comprehensive observability, Splunk for log management, Stackify Retrace for error tracking, and Raygun for crash reporting. Each tool offers distinct features, and the choice depends on specific use cases, technology stacks, and organizational needs. Thorough evaluations, considering factors like ease of use, integration capabilities, and scalability, help in selecting the most suitable APM solution for effective application monitoring in a DevOps environment.
Nagios requires far more manual work to configure than SolarWinds does, though that also encourages customization and perfect-fit solutions. Nagios also requires far, far fewer resources to run than SolarWinds: SolarWinds wants great gobs of memory and disk, while Nagios is refreshingly humble. Nagios starts working from the first minute, too, whereas SolarWinds needs lots of set-up time.