SPSS Statistics is a software package used for statistical analysis. It is now officially named "IBM SPSS Statistics". Companion products in the same family are used for survey authoring and deployment (IBM SPSS Data Collection), data mining (IBM SPSS Modeler), text analytics, and collaboration and deployment (batch and automated scoring services).
$105
per month per user
MicroStrategy Analytics
Score 8.4 out of 10
N/A
MicroStrategy Analytics is an enterprise business analytics and mobility platform. Key features include automatic big data analysis and reporting, data discovery and visualization, digital security credentials, and support for mobile devices.
N/A
SAP Crystal
Score 7.4 out of 10
N/A
SAP Crystal is an analytics and reporting software solution for SMBs. SAP Crystal comprises Crystal Reports for pixel-perfect reporting, and SAP Crystal Server for automated distribution and self-service access to reports, dashboards and data exploration.
$295
per single user license
Pricing
IBM SPSS Statistics
MicroStrategy Analytics
SAP Crystal
Editions & Modules
Base
USD 3,830
one-time fee per user
Standard
USD 8,440
one-time fee per user
Professional
USD 16,900
one-time fee per user
Premium
USD 25,200
one-time fee per user
Monthly subscription
USD 105
per month per user
Annual subscription
USD 1,188.00
per year per user
No answers on this topic
Upgrade Version to SAP Crystal Reports 2020
$295
per single user license
SAP Crystal Reports 2020 64-Bit
$495
per single user license
SAP Crystal Reports 2016 32-Bit
$495
per single user license
SAP Crystal Server 2020 1 NUL
$869
per user license + first year maintenance to be added
SAP Crystal Server 2020 5 CAL
$8,744
5 concurrent users + first year maintenance to be added
Offerings
Pricing Offerings
IBM SPSS Statistics
MicroStrategy Analytics
SAP Crystal
Free Trial
Yes
No
Yes
Free/Freemium Version
No
No
Yes
Premium Consulting/Integration Services
No
No
Yes
Entry-level Setup Fee
No setup fee
No setup fee
Optional
Additional Details
—
Must contact sales team for pricing information.
* SAP Crystal Reports 2020 Viewer allows you to view static data within a SAP Crystal Reports file.
* SAP Crystal Reports 2020 - Full version allows you to create powerful, richly formatted, and dynamic reports from virtually any data source, delivered in dozens of formats, in up to 28 languages. If you already have an older version of Crystal Reports, buy a license for SAP Crystal Reports 2020 - Upgrade at a discounted, upgrade price.
* SAP Crystal Server 2020, 1 NUL includes 1 license of: SAP Crystal Reports 2020 - SAP Crystal Server 2020.
* As an add-on to SAP Crystal Server 2020 1 NUL, SAP Crystal Server 2020 5 CAL allows you to support a wider, intermittent audience of end users, up to five logged on at the same time.
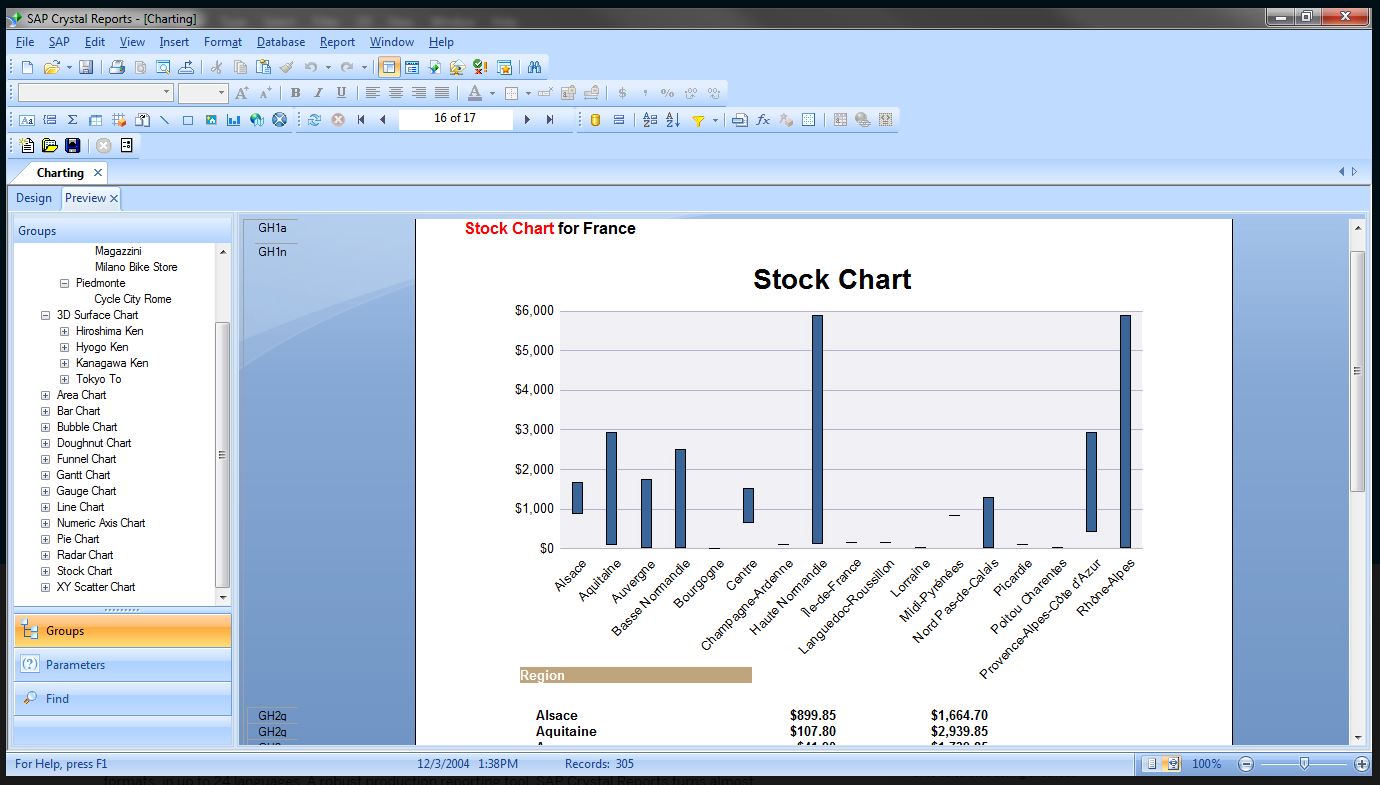
SAP Crystal Reports contains all the reporting capabilities of the above peer technologies. There is not a single capability of the above tools which is not available in Crystal report. But Crystal being an offering SAP fares and performs best for SAP integrated source systems. …
Features
IBM SPSS Statistics
MicroStrategy Analytics
SAP Crystal
BI Standard Reporting
Comparison of BI Standard Reporting features of Product A and Product B
IBM SPSS Statistics
-
Ratings
MicroStrategy Analytics
10.0
26 Ratings
20% above category average
SAP Crystal
7.8
124 Ratings
5% below category average
Pixel Perfect reports
00 Ratings
10.023 Ratings
8.0113 Ratings
Customizable dashboards
00 Ratings
10.023 Ratings
7.0100 Ratings
Report Formatting Templates
00 Ratings
10.024 Ratings
8.4117 Ratings
Ad-hoc Reporting
Comparison of Ad-hoc Reporting features of Product A and Product B
IBM SPSS Statistics
-
Ratings
MicroStrategy Analytics
10.0
24 Ratings
22% above category average
SAP Crystal
8.3
136 Ratings
3% above category average
Drill-down analysis
00 Ratings
10.022 Ratings
9.0117 Ratings
Formatting capabilities
00 Ratings
10.024 Ratings
8.7135 Ratings
Integration with R or other statistical packages
00 Ratings
10.016 Ratings
7.064 Ratings
Report sharing and collaboration
00 Ratings
10.023 Ratings
8.7120 Ratings
Report Output and Scheduling
Comparison of Report Output and Scheduling features of Product A and Product B
IBM SPSS Statistics
-
Ratings
MicroStrategy Analytics
10.0
23 Ratings
19% above category average
SAP Crystal
8.8
136 Ratings
7% above category average
Publish to Web
00 Ratings
10.022 Ratings
9.091 Ratings
Publish to PDF
00 Ratings
10.023 Ratings
9.3133 Ratings
Report Versioning
00 Ratings
10.020 Ratings
8.094 Ratings
Report Delivery Scheduling
00 Ratings
10.022 Ratings
9.097 Ratings
Delivery to Remote Servers
00 Ratings
10.05 Ratings
8.554 Ratings
Data Discovery and Visualization
Comparison of Data Discovery and Visualization features of Product A and Product B
SPSS's ability to deal with things like survey verbatims is a significant competitive disadvantage. The ability to do most of what researchers do without having to learn to program (think R or Python) is the primary advantage SPSS brings to bear.
MSTR is great for any organization that is looking for a way to deliver complicated data in an uncomplicated way. From business teams to marketing and finance, several departments benefit from using MSTR to keep track of KPIs enabling teams to make optimizations along the way. MSTR provides great visual representations of data enabling team members to distill thousands of data points into easily digestible charts and graphs
Generation of templated reports is the strong suit of SAP Crystal. Allows users to change formats in templates bases on requirement with minimal effort. Automated report delivery requires the user to be aware of sql which cannot be expected from all users. Should support more document export formats and improve the UI for SAP B1 Users
SPSS has been around for quite a while and has amassed a large suite of functionality. One of its longest-running features is the ability to automate SPSS via scripting, AKA "syntax." There is a very large community of practice on the internet who can help newbies to quickly scale up their automation abilities with SPSS. And SPSS allows users to save syntax scripting directly from GUI wizards and configuration windows, which can be a real life-saver if one is not an experienced coder.
Many statistics package users are doing scientific research with an eye to publish reproducible results. SPSS allows you to save datasets and syntax scripting in a common format, facilitating attempts by peer reviewers and other researchers to quickly and easily attempt to reproduce your results. It's very portable!
SPSS has both legacy and modern visualization suites baked into the base software, giving users an easily mountable learning curve when it comes to outputting charts and graphs. It's very easy to start with a canned look and feel of an exported chart, and then you can tweak a saved copy to change just about everything, from colors, legends, and axis scaling, to orientation, labels, and grid lines. And when you've got a chart or graph set up the way you like, you can export it as an image file, or create a template syntax to apply to new visualizations going forward.
SPSS makes it easy for even beginner-level users to create statistical coding fields to support multidimensional analysis, ensuring that you never need to destructively modify your dataset.
In closing, SPSS's long and successful tenure ensures that just about any question a new user may have about it can be answered with a modicum of Google-fu. There are even several fully-fledged tutorial websites out there for newbie perusal.
They sell the product well, and make promises you will actually believe
"checks the box" for most features a company would need. Doesn't actually deliver them though
They answer the phone in a timely manner. Can't answer your questions or provide support, but the queue time isn't bad
They have online documentation. It's not up to date, and likely doesn't reflect the version of software you are using, but hey... they can point to it.
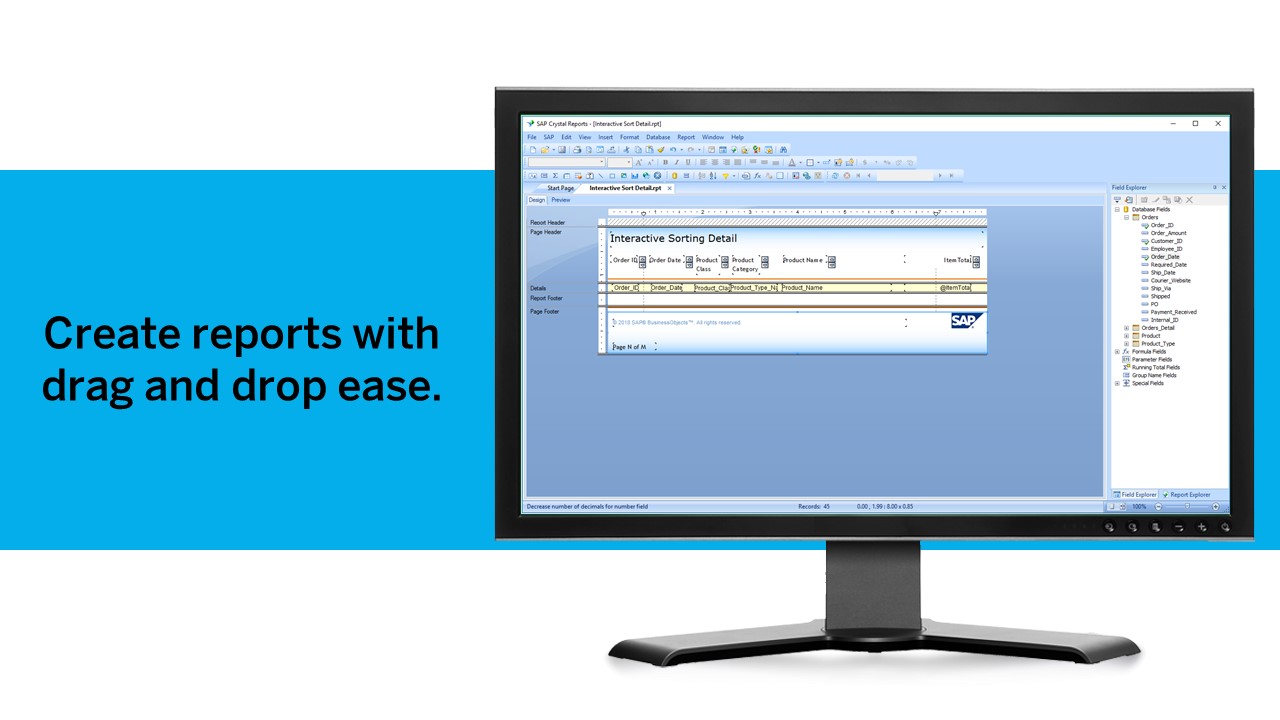
Crystal Reports allows us to create a consistent template for all of our reports.
Crystal Reports and Server allows us to house a repository for all of our reports to make them easy to find and update when necessary.
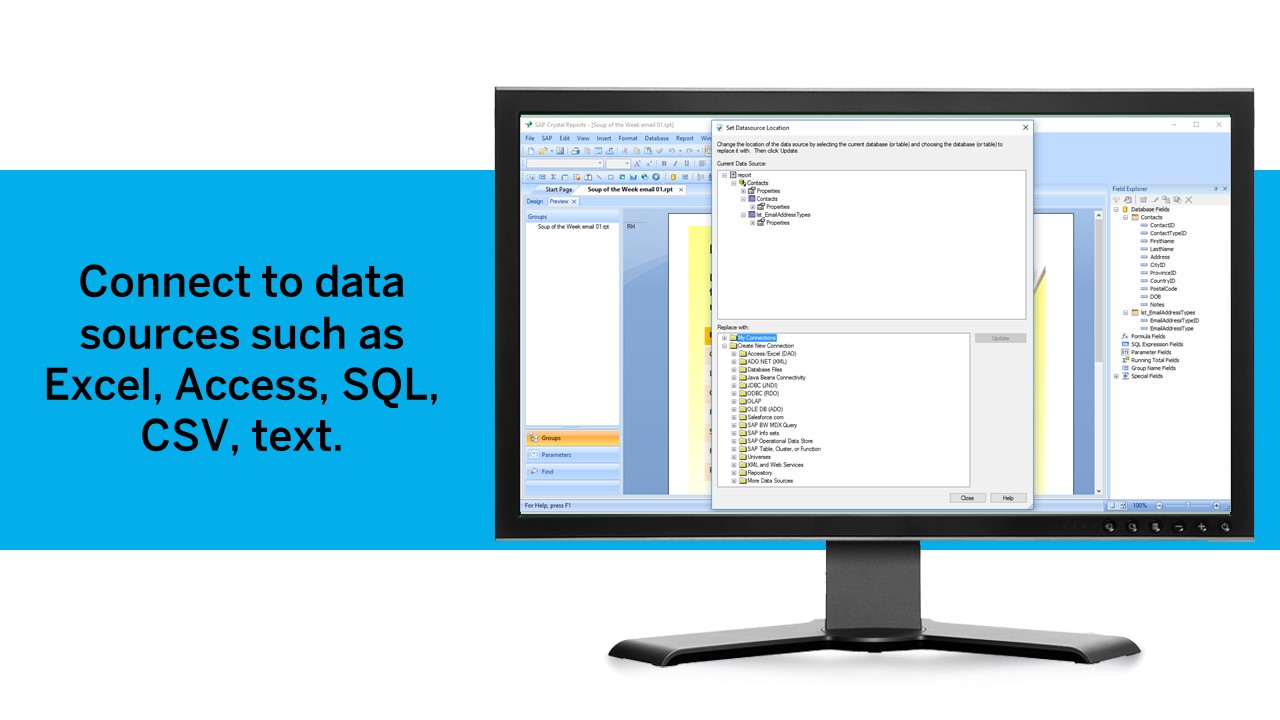
Crystal Reports can connect to a wide variety of data sources.
Crystal Reports can be a little daunting when first implementing. There are a lot of nuances in learning how to truly master this software and it can be frustrating at times.
collaboration - SPSS lacks collaboration features which makes it near impossible to collaborate with my team on analysis. We have to send files back and forth, which is tedious.
integration - I wish SPSS had integration capabilities with some of the other tools that I use (e.g., Airtable, Figma, etc.)
user interface - this could definitely be modernized. In my experience, the UI is clunky and feels dated, which can negatively impact my experience using the tool.
Both money and time are essential for success in terms of return on investment for any kind of research based project work. Using a Likert-scale questionnaire is very easy for data entry and analysis using IBM SPSS. With the help of IBM SPSS, I found very fast and reliable data entry and data analysis for my research. Output from SPSS is very easy to interpret for data analysis and findings
I would always choose to renew MicroStrategy as long as they lead the market in features, functionality and price. The support of MicroStrategy is timely and professional, I frequently get answers to my questions within 24 hours and normally have solutions within 48 hours. Training available for MicroStrategy completely covers everything required to be able to expertly use MicroStrategy and understand data warehousing.
We have been using this product for so many years and it has truly become a cornerstone to our business processes when it comes to developing and distributing information via reports. We currently have over 500 reports developed to date over about 30 systems and that will continue to grow as user needs change.
Probably because I have been using it for so long that I have used all of the modules, or at least almost all of the modules, and the way SPSS works is second nature to me, like fish to swimming.
The standard grid reporting could look more like the styling and object used for the Import and Visual Insight products. In addition, object properties almost seem to be hidden when first using the product. It's as if they are asking the engineers to only use the presets we make available...and, these presets are 10+ years old. On the positive side, Microstrategy seems to be the only product, not named Cognos, which can scale to Big Data. The product is "hackable" via the SDK or tricking the Intelligence Server to do uncommon things. The Microstrategy development team also seems to be very involved with their OEM partners; especially when it comes to features and enhancements. A large majority of the improvements we suggested have made it into the product or on the roadmap for future enhancements. Only suckas fall for the shiny objects from most other vendors; Microstrategy is really the only choice for Enterprise BI.
Crystal is very robust, but not always easy to use. It create wonderful looking reports, and so deserves a high rating. However, I have to take a couple of points off for the simple fact that I cannot hand it to a user and expect them to be able to do development with it.
I've never had an issue with MicroStrategy not being available due to MicroStrategy application malfunction. It is very robust and only failures I've seen were due to user error or the platform the machine running the service failed some how.
Being able to customize the performance based on the business need is extremely powerful. Proper configuration and understanding of the usage pattern is key, if the technical ability of the architect is not at top level, then the product will not be configured correctly which will lead to poor performance.
I have not contacted IBM SPSS for support myself. However, our IT staff has for trying to get SPSS Text Analytics Module to work. The issue was never resolved, but I'm not sure if it was on the IT's end or on SPSS's end
Good user community. Support team is available if you are under AMC. You get decent support after raising the support ticket. If it is product bug they will inform you and let you know which patch will resolve the same.
The support community can be difficult to navigate. I've also run into issues with my login. The SAP system has a bizarre mechanism for validating users that requires users to have what is called an S-ID. A basic ID may not give you access to all the features in the portal. The limitation may include not being able to perform a simple task like downloading patches and updates. This isn't a big deal for single user license but for teams it can be a pain.
I have attended many trainings offered by MicroStrategy; both distance and in-person training. I earned my CRD (Certified Report Developer) certification via the online training. I found the training to be well organized and concise. Overall I will definitely continue to increase my knowledge with MicroStrategy via the online training offering.
Have a plan for managing the yearly upgrade cycle. Most users work in the desktop version, so there needs to be a mechanism for either pushing out new versions of the software or a key manager to deal with updated licensing keys. If you have a lot of users this needs to be planned for in advance.
Just like any other implementation: When designing the differing reports, get end users' input, make sure to design the reports so that they display the information that the company requires, in the best and clearest way possible.
Test, test, test, revise when needed, and, particularly, do sufficient training so users are comfortable using Crystal Reports!
If you have made it this far, you should have a very good idea of how SPSS stacks up the competition (data processing and analytics tools). Even the free ones, such as r Studio or Stata, are leaps and bounds ahead of SPSS. IBM is resting on a reputation developed nearly 30 years ago and has shown no desire to improve.
Tableau is probably MicroStrategy Analytic's biggest competitor I've noticed over time, and I'm not sure why. Tableau only covers visualizations independently for each business user, which then creates the issues of every employee creating their own version of the data, and then you have 20 versions of the truth. A enterprise data warehouse and MicroStrategy's Visual Insight is a better method.
Crystal reports is useful in case we want to import data from data base . We can write queries in it but Google Charts require to be implemented in our application using code so crystal reports is better than Google Charts.
This software is extremely scaleable, one can add more core servers which performs as a load balancing. The configurations available to manage usage patterns and daily activity are as high a caliber as any other enterprise level software. This product can be installed on both a windows and unix platform allow for integration on a budget.
I found SPSS easier to use than SAS as it's more intuitive to me.
The learning curve to use SPSS is less compared to SAS.
I used SAS, to a much lesser extent than SPSS. However, it seems that SAS may be more suitable for users who understand programming. With SPSS, users can perform many statistical tests without the need to know programming.
MicroStrategy was helpful for reducing the amount of time we needed to spend number crunching large data sets, and in doing so, allowed me as the primary users to spend more time gleaning insights from the data that in turn informed our leadership team to make strategic decisions.
By creating numerous canned reports available to all members of the team through email distribution or basic access to the platform, we were able to reduce the time I spent showing people how to pull the data in Microsoft Excel by nearly 40% .
We ended up needing to make many changes to the way our DMP was feeding data into MicroStrategy due to incorrect reporting that caused complications in accounting and finance.
It is a decent buy for specific departments in terms of reporting capabilities but updates and cost (frequent) demands are higher with the benefits offered.
So long as the requirements are not ever changing, with scheduling functionality, it's a handsome tool.