Chose iCharts
I haven't experience any other alternative product of this.
| Product | Rating | Most Used By | Product Summary | Starting Price |
|---|---|---|---|---|
 iCharts | Mid-Size Companies (51-1,000 employees) | iCharts is a Business Intelligence and Analytics solution for NetSuite. With this solution, users can transform their NetSuite data into interactive, real-time analytics without leaving their NetSuite dashboard. iCharts includes drag-and-drop chart creation and best-practice templates. The vendor’s value proposition is that iCharts accelerates an organization’s analytics strategy by empowering their team with the critical data-driven tools they need. | $10,000 per installation | |
 Cyfe | N/A | Cyfe is all-in-one dashboard software for analyzing data from online services like Google Analytics, Salesforce, AdSense, MailChimp, Amazon, Facebook, etc, from Traject. | $29 per month |
| iCharts | Cyfe, by Traject | |||||||||||||||
|---|---|---|---|---|---|---|---|---|---|---|---|---|---|---|---|---|
| Editions & Modules |
|
| ||||||||||||||
| Offerings |
| |||||||||||||||
| Entry-level Setup Fee | $3,000 per installation | No setup fee | ||||||||||||||
| Additional Details | Based on number of NetSuite licenses | — | ||||||||||||||
| More Pricing Information | ||||||||||||||||
| iCharts | Cyfe, by Traject | |
|---|---|---|
| Considered Both Products | iCharts |  Cyfe  Javier Velazquez Head of Marketing | Co Founder Chose Cyfe These other reporting tools are much better for an agency that is under the scrutiny of cleaner reports with more in-depth analytics and specific KPI's. However, you can use both and provide a Cyfe board as a live additional to the weekly static reporting that many agencies …  Mitchell Terpstra Writer/Strategist Chose Cyfe My company already subscribed to Cyfe when I began, so for me there wasn't any shopping around. While Cyfe does pull straight from the "back end" side of many social media platforms, or from Google Analytics for websites, the benefit is that you can see all the stats in one …  Tobias Walter COO & CFO Chose Cyfe Cyfe is cheaper than Geckoboard; and I believe (??) has more integrations you can pull data from. I liked Geckoboard a tad better visually.  Zach Zook Account Manager Chose Cyfe I did not look into alternatives. That was my superior's job.  Sharon A. Dawson, DTM Marketing Manager Chose Cyfe We used RavenTools in the past as our monthly reporting tool. At the time there wasn't a one-page dashboard available in RavenTools, every single element we incorporate in our reports was included on a separate page. It became very unwieldy for our clients and led to a lot of … Chose Cyfe Compared to other tools like Jasper Reports, Cyfe has ZERO impact on the server since it is a totally hosted solution, plus it has several connectors that allow for interacting with no coding at all. It gives the user total freedom on which language to use to provide custom … Chose Cyfe We were using different tools to do pieces of what Cyfe does. I was never keen on the idea of spending $150, $200, or even $500+ for an analytics tool so we were pulling analytics directly from each source and creating our own reports. It was a beast of a project to manage and …  David J. Mumford Director of Business Insights & Research Chose Cyfe Cyfe more than holds its own vs the competition. The capabilities are strong - especially for the price.  Rob Maxwell Graphic Designer / Marketing Director Chose Cyfe Hootsuite is good for tracking online activity. Cyfe has the same capabilities and more.  Jamie Lin Founder and CEO Chose Cyfe Remember that Cyfe is not a true Business Intelligence tool it is a data visualization tool. It is great because it let's you change the time series. It will not let you drill down on the data. You cannot map different data sets together. It is a great tool to pull basic data …  Julian Castañeda Director Chose Cyfe It´s very cheap and easy to use.  Brent Wildman Director of Marketing Chose Cyfe Cyfe really shines by pulling in only the relevant data you want to see while being logged in to multiple accounts.  Tony Huidor Vice President, Digital Operations Chose Cyfe The price was a big selling point but more importantly the third-party integrations that are offered were the deciding factor. Offering support for services that we use regularly like Google Analytics, Apple's iTunes Connect, Facebook, etc., allow us to get real time access to …  John Dykstra Owner Chose Cyfe Cyfe's pricing model makes it affordable for a small company like mine.  Jeff Wysocki Digital Content Marketing Specialist Chose Cyfe Have not tried other products.  Shane Hayes CIO (Chief Information Officer) Chose Cyfe Domo was vastly overpriced compared Cyfe and it was far less friendly to use and get used to. I was able to jump right in with Cyfe and get the data I wanted setup right away. When I had a question I was able to get an immediate response directly from Deven without hesitation. … |
| iCharts | Cyfe, by Traject | |||||||||||||||||||||
|---|---|---|---|---|---|---|---|---|---|---|---|---|---|---|---|---|---|---|---|---|---|---|
| BI Standard Reporting |
| |||||||||||||||||||||
| Ad-hoc Reporting |
| |||||||||||||||||||||
| Report Output and Scheduling |
| |||||||||||||||||||||
| Data Discovery and Visualization |
| |||||||||||||||||||||
| Access Control and Security |
| |||||||||||||||||||||
| Mobile Capabilities |
| |||||||||||||||||||||
| Application Program Interfaces (APIs) / Embedding |
|
| iCharts | Cyfe, by Traject | |
|---|---|---|
| Small Businesses |  Yellowfin Score 8.6 out of 10 | Yellowfin Score 8.6 out of 10 |
| Medium-sized Companies |  Reveal Score 10.0 out of 10 | Reveal Score 10.0 out of 10 |
| Enterprises |  Kyvos Semantic Layer Score 9.5 out of 10 | Kyvos Semantic Layer Score 9.5 out of 10 |
| All Alternatives | View all alternatives | View all alternatives |
| iCharts | Cyfe, by Traject | |
|---|---|---|
| Likelihood to Recommend | 8.0 (0 ratings) | 8.0 (0 ratings) |
| Likelihood to Renew | - (0 ratings) | 9.4 (0 ratings) |
| Usability | - (0 ratings) | 7.0 (0 ratings) |
| Support Rating | - (0 ratings) | 10.0 (0 ratings) |
| Implementation Rating | - (0 ratings) | 10.0 (0 ratings) |
| iCharts | Cyfe, by Traject | |
|---|---|---|
| Likelihood to Recommend |
|
|
| Pros |
|
 Kim Towne Digital Analytics Manager | Risk Management Coordinator |
| Cons |
|
Sharon A. Dawson, DTM Marketing Manager |
| Likelihood to Renew | No answers on this topic |
Tony Huidor Vice President, Digital Operations |
| Usability | No answers on this topic |
|
| Support Rating | No answers on this topic |
Shane Hayes CIO (Chief Information Officer) |
| Implementation Rating | No answers on this topic |
Shane Hayes CIO (Chief Information Officer) |
| Alternatives Considered |
|
Mitchell Terpstra Writer/Strategist |
| Return on Investment | No answers on this topic |
Shane Hayes CIO (Chief Information Officer) |
| ScreenShots | iCharts Screenshots 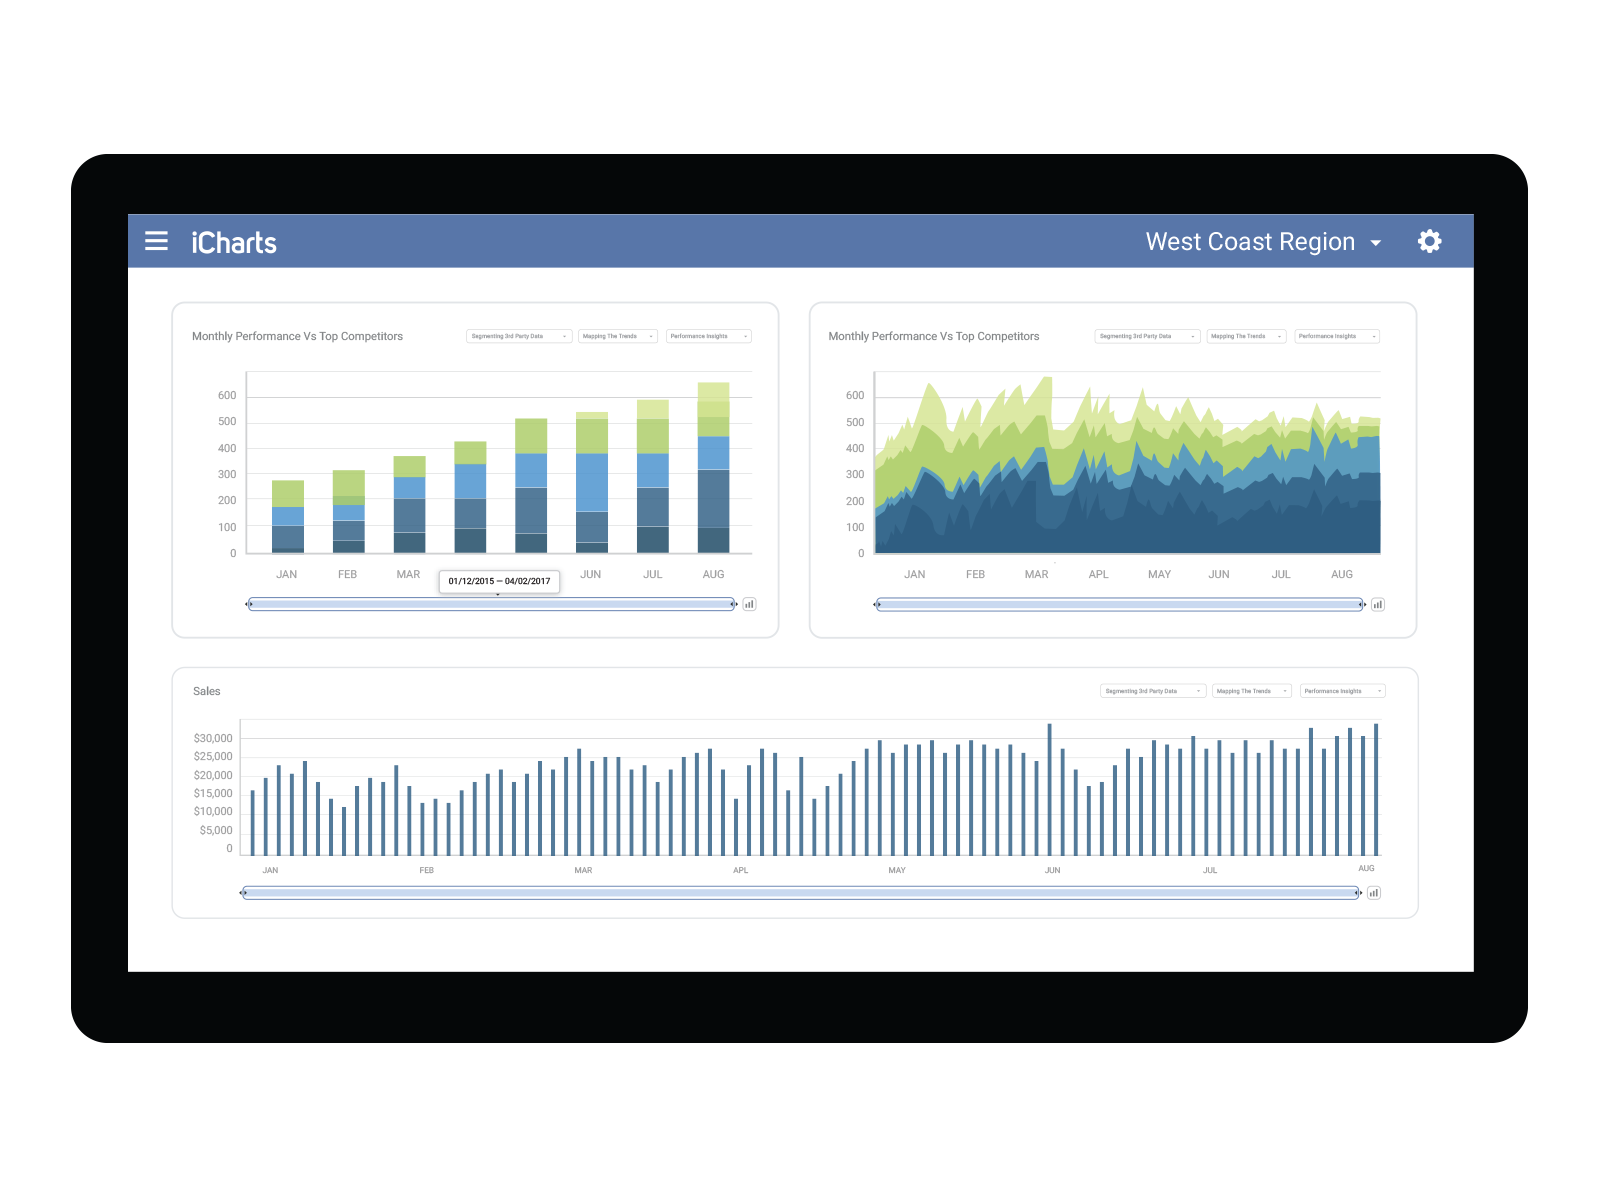 |

