iCharts vs. Zoho Analytics

Overview
ProductRatingMost Used ByProduct SummaryStarting Price
iCharts
Score 8.0 out of 10
Mid-Size Companies (51-1,000 employees)
iCharts is a Business Intelligence and Analytics solution for NetSuite. With this solution, users can transform their NetSuite data into interactive, real-time analytics without leaving their NetSuite dashboard. iCharts includes drag-and-drop chart creation and best-practice templates. The vendor’s value proposition is that iCharts accelerates an organization’s analytics strategy by empowering their team with the critical data-driven tools they need.
$10,000
per installation
Zoho Analytics
Score 8.5 out of 10
Small Businesses (1-50 employees)
Zoho Analytics (formerly Zoho Reports) is a self-service BI and analytics platform that allows users to analyze their business data and create reports and dashboards. It is designed to help users create and share reports quickly, without IT assistance.
$30
per month 2 users
Pricing
iChartsZoho Analytics
Editions & Modules
Professional
$10,000
per installation
Business
15,000
per installation
Elite
$25,000
per installation
Basic
$30
0.5M rows, 2 users
Professional
$30
per user per month billed annually
Standard
$60
1M rows, 5 users
Premium
$145
5M rows, 15 users
Enterprise
$575
50M rows, 50 users
Offerings
Pricing Offerings
iChartsZoho Analytics
Free Trial
YesYes
Free/Freemium Version
NoYes
Premium Consulting/Integration Services
YesYes
Entry-level Setup Fee$3,000 per installationNo setup fee
Additional DetailsBased on number of NetSuite licensesThere is a 20% discount for all plans if subscribed yearly. Customers can buy add-on rows and users, in addition to the plans listed above.
More Pricing Information
Community Pulse
iChartsZoho Analytics
Features
iChartsZoho Analytics
BI Standard Reporting
Comparison of BI Standard Reporting features of Product A and Product B
iCharts
9.0
2 Ratings
9% above category average
Zoho Analytics
8.8
135 Ratings
7% above category average
Customizable dashboards10.02 Ratings8.6135 Ratings
Report Formatting Templates8.01 Ratings00 Ratings
Pixel Perfect reports00 Ratings8.9106 Ratings
Ad-hoc Reporting
Comparison of Ad-hoc Reporting features of Product A and Product B
iCharts
9.0
2 Ratings
11% above category average
Zoho Analytics
8.2
137 Ratings
2% above category average
Drill-down analysis9.02 Ratings8.2131 Ratings
Report sharing and collaboration9.02 Ratings8.8137 Ratings
Formatting capabilities00 Ratings7.7136 Ratings
Report Output and Scheduling
Comparison of Report Output and Scheduling features of Product A and Product B
iCharts
10.0
1 Ratings
19% above category average
Zoho Analytics
8.6
129 Ratings
4% above category average
Publish to Web10.01 Ratings8.6108 Ratings
Publish to PDF00 Ratings8.6127 Ratings
Report Delivery Scheduling00 Ratings8.7112 Ratings
Data Discovery and Visualization
Comparison of Data Discovery and Visualization features of Product A and Product B
iCharts
8.0
1 Ratings
0% below category average
Zoho Analytics
8.2
84 Ratings
2% above category average
Pre-built visualization formats (heatmaps, scatter plots etc.)8.01 Ratings8.480 Ratings
Location Analytics / Geographic Visualization00 Ratings8.772 Ratings
Predictive Analytics00 Ratings7.466 Ratings
Access Control and Security
Comparison of Access Control and Security features of Product A and Product B
iCharts
8.7
2 Ratings
2% above category average
Zoho Analytics
8.6
129 Ratings
1% above category average
Multi-User Support (named login)9.02 Ratings8.8127 Ratings
Role-Based Security Model8.02 Ratings8.972 Ratings
Multiple Access Permission Levels (Create, Read, Delete)9.02 Ratings8.7122 Ratings
Report-Level Access Control00 Ratings7.830 Ratings
Single Sign-On (SSO)00 Ratings8.674 Ratings
Mobile Capabilities
Comparison of Mobile Capabilities features of Product A and Product B
iCharts
10.0
2 Ratings
25% above category average
Zoho Analytics
7.1
97 Ratings
10% below category average
Responsive Design for Web Access10.01 Ratings7.871 Ratings
Dashboard / Report / Visualization Interactivity on Mobile10.02 Ratings6.886 Ratings
Mobile Application00 Ratings5.673 Ratings
Application Program Interfaces (APIs) / Embedding
Comparison of Application Program Interfaces (APIs) / Embedding features of Product A and Product B
iCharts
-
Ratings
Zoho Analytics
8.4
65 Ratings
8% above category average
REST API00 Ratings8.261 Ratings
iFrames00 Ratings8.653 Ratings
Best Alternatives
iChartsZoho Analytics
Small Businesses
Yellowfin
Yellowfin
Score 8.8 out of 10
Yellowfin
Yellowfin
Score 8.8 out of 10
Medium-sized Companies
Reveal
Reveal
Score 10.0 out of 10
Reveal
Reveal
Score 10.0 out of 10
Enterprises
Kyvos Semantic Layer
Score 9.5 out of 10
Kyvos Semantic Layer
Score 9.5 out of 10
All AlternativesView all alternativesView all alternatives
User Ratings
iChartsZoho Analytics
Likelihood to Recommend
8.0
(2 ratings)
7.9
(139 ratings)
Likelihood to Renew
-
(0 ratings)
9.0
(9 ratings)
Usability
-
(0 ratings)
8.1
(83 ratings)
Availability
-
(0 ratings)
9.1
(1 ratings)
Performance
-
(0 ratings)
9.1
(2 ratings)
Support Rating
-
(0 ratings)
5.3
(18 ratings)
Implementation Rating
-
(0 ratings)
5.5
(3 ratings)
Ease of integration
-
(0 ratings)
7.3
(1 ratings)
Product Scalability
-
(0 ratings)
7.7
(71 ratings)
Vendor post-sale
-
(0 ratings)
7.3
(1 ratings)
Vendor pre-sale
-
(0 ratings)
8.2
(1 ratings)
User Testimonials
iChartsZoho Analytics
Likelihood to Recommend
iCharts, Inc.
The iCharts has suited our organization work as it has helped us a lot in our internal and external works. As we use iCharts for the internal team in representing the working reports and data of the business in an accurate manner. It helps in representing the presentation to the client to showcase our work and present him the data and work flow through the iCharts. As I don't found anything missing in this software.
Read full review
Zoho
Zoho Analytics is the best way to consume data created by Zoho products . It's robust and quick build formula libraries and auto generated reports. A data source can be integrated and be ready for consumption within minutes. This gives a well developed baseline for organizing to develop advance analytics. It's mobile dashboards are very intuitive and useful for leaders who are on the move.
Read full review
Pros
iCharts, Inc.
  • Their new platform is easy to navigate
  • We had a dedicated support person to help set up searches and train in the use of iCharts
  • Separate Dashboards for each group
Read full review
Zoho
  • Zoho Analytics’ predictive analytics capabilities can help forecast future trends, allowing for proactive planning and risk management.
  • Performance Monitoring: We can track key performance indicators (KPIs) across departments, such as sales, marketing, finance, and HR. This aids in identifying bottlenecks and areas for improvement.
  • Decision making regarding resource allocation.
Read full review
Cons
iCharts, Inc.
  • The new platform has limitations on colors and sizing
  • iCharts seem to have closed its doors without notification and now we have a product with no support
Read full review
Zoho
  • I'm guessing it's out there somewhere but I really could have used a 'quick start guide' or guided start.
  • Once I figured it out, it makes sense how to make sure the right data is provided in order to make dashboards quite flexible--- but without examples, I found it quite a challenge
  • The initial organization of Analytics is NOT intuitive. Once in context, the organizational features make sense, but (at least initially) it would have been most useful if the organization of Analytics reports in Zoho Analytics had saved me a lot of time.
Read full review
Likelihood to Renew
iCharts, Inc.
No answers on this topic
Zoho
I'd give this an 11 if I could! As our business moves forward we hope to use Zoho Analytics more then we do now. Creating better reports and dashboards for our management team to evaluate the health of our business and to provide more insightful reports for our customers. The possibilities are endless with this tool
Read full review
Usability
iCharts, Inc.
No answers on this topic
Zoho
For an end user, Zoho Analytics is pretty easy to use and very easy to access the dashboard. Linking data from multiple sources is very convenient. Multiple people can work on preparing and publishing the dashboards simultaneously, which helps delegate tasks.
Read full review
Reliability and Availability
iCharts, Inc.
No answers on this topic
Zoho
ZOHO is a very reliable company/product. We never had any issues with downtime or inaccessibility to our data. Any type of maintenance that they had to perform was clearly communicated and never an issue. We use a lot of external hooks and we've never had any issues with getting ZOHO to communicate with any of those hooks.
Read full review
Performance
iCharts, Inc.
No answers on this topic
Zoho
ZOHO has obviously invested a lot of time effort and money in to creating a reliable infrastructure with high availability. We've never had any issues with performance and all of our data crunching small to large has always been well within reason. We have come to appreciate the performance of ZOHO and will continue to use it for all of our data needs.
Read full review
Support Rating
iCharts, Inc.
No answers on this topic
Zoho
The support team is honestly not that great. At times, it seems as if members of our own team know more about the product than the support team. They must not have a lot of training or the turnaround is quick
Read full review
Implementation Rating
iCharts, Inc.
No answers on this topic
Zoho
If your external data sources are previously organized and correlated (e.g.: in your datawarehouse or database) your implementation will be easier. Of cource some not previously predicted correlation would be necessary to be done during the implementation, but if your organization let it to be all done into Zoho Analytics, it will take more time from your team.
Read full review
Alternatives Considered
iCharts, Inc.
I haven't experience any other alternative product of this.
Read full review
Zoho
Zoho Analytics has the best UI and user friendly to create reports and dashboard along with features like Zia Assistance that guide in creating reports and dashboard and also help in the forecasting of the data based on the past records.
Read full review
Scalability
iCharts, Inc.
No answers on this topic
Zoho
As far as I know, Zoho Analytics has been able to fulfill every need we've had for it. Our reports have gotten better and more detailed with pretty much every new issue of our magazine. It just keeps getting better, and we keep feeding it more data to digest and present to us.
Read full review
Return on Investment
iCharts, Inc.
No answers on this topic
Zoho
  • Analytics has been the foundation of my role. I manage 2000 accounts myself, so I need analytics to help me know whom to serve first.
  • Analytics provides a lot of visualization options that I need to serve my customers.
  • Analytics has excellent options for accountability with our training team to know where each account is in their customer journey.
Read full review
ScreenShots

iCharts Screenshots

Screenshot of Screenshot of

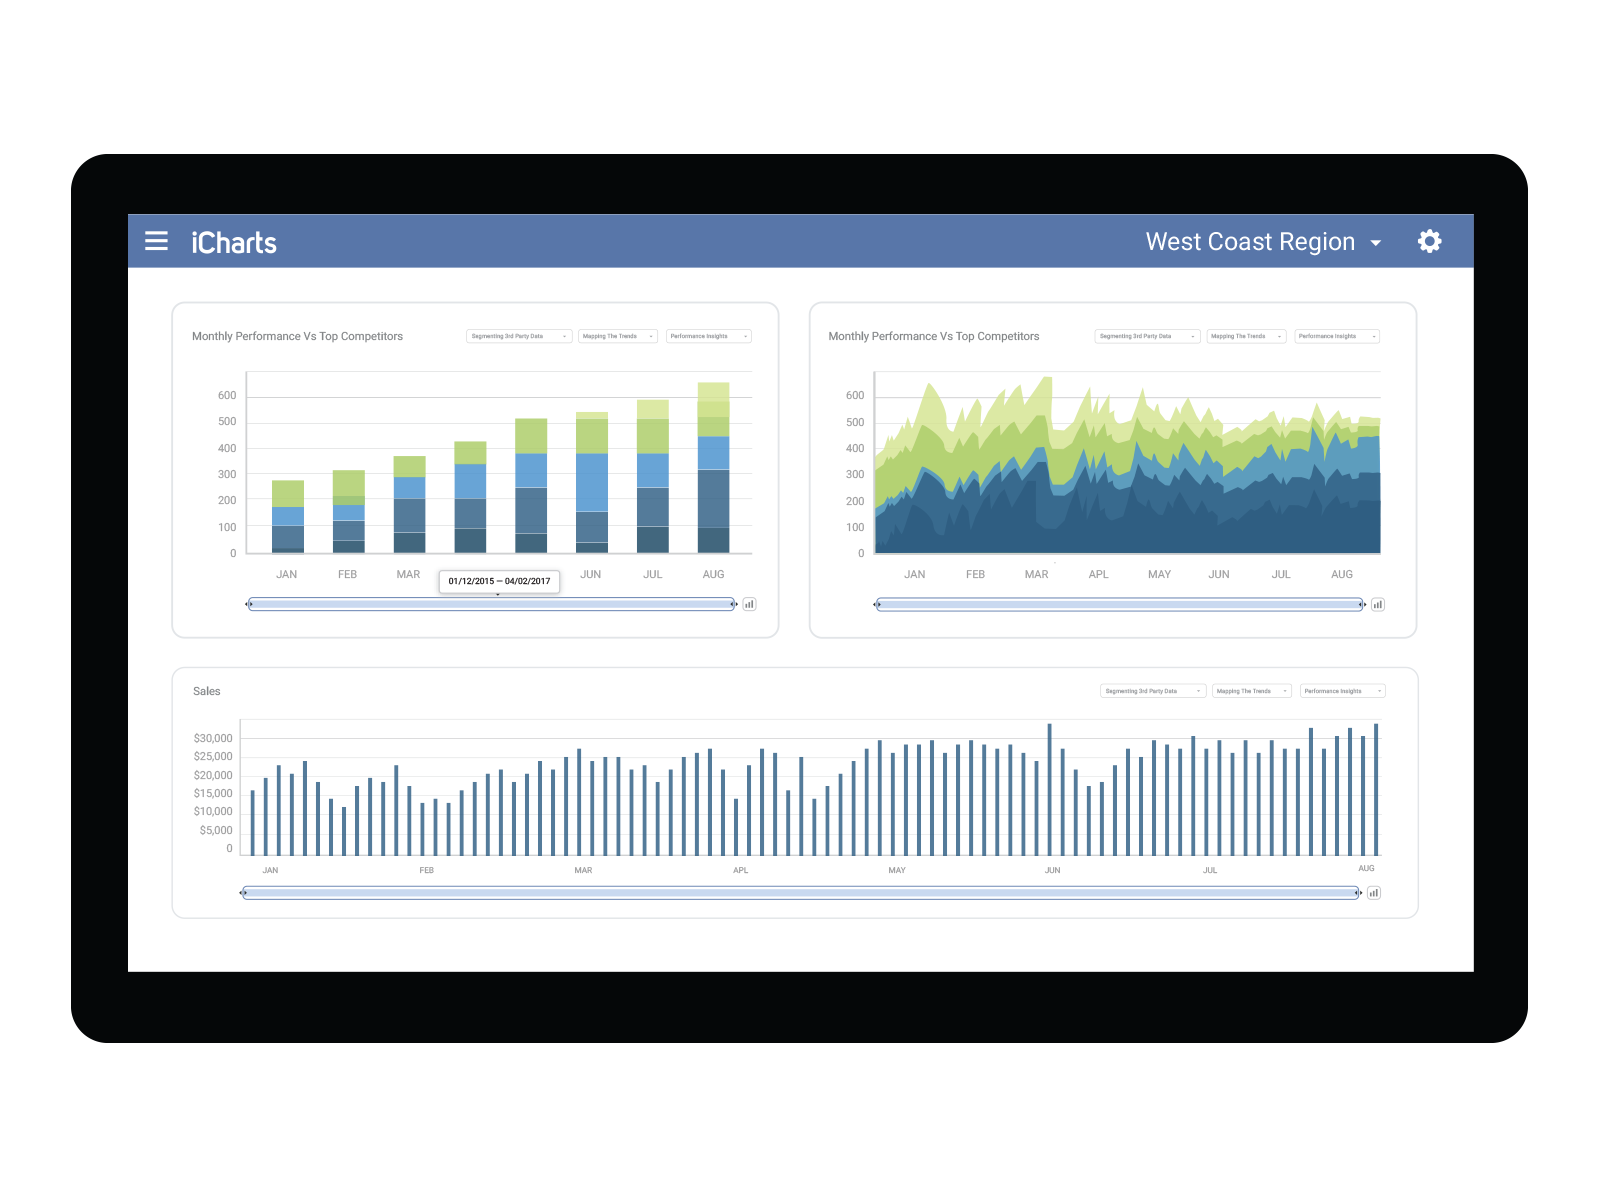
Zoho Analytics Screenshots

Screenshot of Zia Insights, which provides contextual intelligence with detailed diagnostics.Screenshot of where OpenAI's large language models (LLMs) are leveraged within Ask Zia to build complex queries, construct metrics and formulas, and discover public datasets.Screenshot of key metrics with KPI charts.Screenshot of streaming data, which is available for real-time insights. Users can process streams from Google Pub/Sub, Kafka, PubNub and APIs.Screenshot of reports accessed from iPad and Android tablets.Screenshot of custom machine learning models, available with a no-code assistant.