Jama Analyze (Discontinued) vs. Cyfe, by Traject
Jama Analyze (Discontinued) vs. Cyfe, by Traject
| Product | Rating | Most Used By | Product Summary | Starting Price |
|---|---|---|---|---|
 Jama Analyze (Discontinued) | Mid-Size Companies (51-1,000 employees) | Jama Analyze (formerly called Notion) was a solution for quickly creating shareable, custom dashboards. However, the product is no longer available. Jama Software sunset the Analyze product in 2019. Some of the benefits of Jama Analyze included the ability to: Create custom metrics across all teams with data from any source with the intuitive metric builder. Experience self-serve BI with no coding and no IT to get started making custom dashboards.… | $23 per month | |
 Cyfe | N/A | Cyfe is all-in-one dashboard software for analyzing data from online services like Google Analytics, Salesforce, AdSense, MailChimp, Amazon, Facebook, etc, from Traject. | $29 per month |
| Jama Analyze (Discontinued) | Cyfe, by Traject | |||||||||||||||
|---|---|---|---|---|---|---|---|---|---|---|---|---|---|---|---|---|
| Editions & Modules |
|
| ||||||||||||||
| Offerings |
| |||||||||||||||
| Entry-level Setup Fee | No setup fee | No setup fee | ||||||||||||||
| Additional Details | — | — | ||||||||||||||
| More Pricing Information | ||||||||||||||||
| Jama Analyze (Discontinued) | Cyfe, by Traject |
|---|
| Jama Analyze (Discontinued) | Cyfe, by Traject | |||||||||||||||||||||
|---|---|---|---|---|---|---|---|---|---|---|---|---|---|---|---|---|---|---|---|---|---|---|
| BI Standard Reporting |
| |||||||||||||||||||||
| Ad-hoc Reporting |
| |||||||||||||||||||||
| Report Output and Scheduling |
| |||||||||||||||||||||
| Data Discovery and Visualization |
| |||||||||||||||||||||
| Access Control and Security |
| |||||||||||||||||||||
| Mobile Capabilities |
| |||||||||||||||||||||
| Application Program Interfaces (APIs) / Embedding |
|
| Jama Analyze (Discontinued) | Cyfe, by Traject | |
|---|---|---|
| Small Businesses |  Yellowfin Score 8.7 out of 10 | Yellowfin Score 8.7 out of 10 |
| Medium-sized Companies |  Reveal Score 10.0 out of 10 | Reveal Score 10.0 out of 10 |
| Enterprises |  Kyvos Semantic Layer Score 9.5 out of 10 | Kyvos Semantic Layer Score 9.5 out of 10 |
| All Alternatives | View all alternatives | View all alternatives |
| Jama Analyze (Discontinued) | Cyfe, by Traject | |
|---|---|---|
| Likelihood to Recommend | 8.0 (1 ratings) | 8.0 (29 ratings) |
| Likelihood to Renew | - (0 ratings) | 9.4 (9 ratings) |
| Usability | - (0 ratings) | 7.0 (3 ratings) |
| Support Rating | - (0 ratings) | 10.0 (2 ratings) |
| Implementation Rating | - (0 ratings) | 10.0 (1 ratings) |
| Jama Analyze (Discontinued) | Cyfe, by Traject | |
|---|---|---|
| Likelihood to Recommend | Jama Software
| Traject
|
| Pros | Jama Software
| Traject
 Mitchell Terpstra Writer/Strategist |
| Cons | Jama Software
| Traject
 Kim Towne Digital Analytics Manager | Risk Management Coordinator |
| Likelihood to Renew | Jama Software No answers on this topic | Traject
 Tony Huidor Vice President, Digital Operations |
| Usability | Jama Software No answers on this topic | Traject
|
| Support Rating | Jama Software No answers on this topic | Traject
 Shane Hayes CIO (Chief Information Officer) |
| Implementation Rating | Jama Software No answers on this topic | Traject
Shane Hayes CIO (Chief Information Officer) |
| Alternatives Considered | Jama Software
| Traject
|
| Return on Investment | Jama Software No answers on this topic | Traject
Shane Hayes CIO (Chief Information Officer) |
| ScreenShots | Jama Analyze (Discontinued) Screenshots     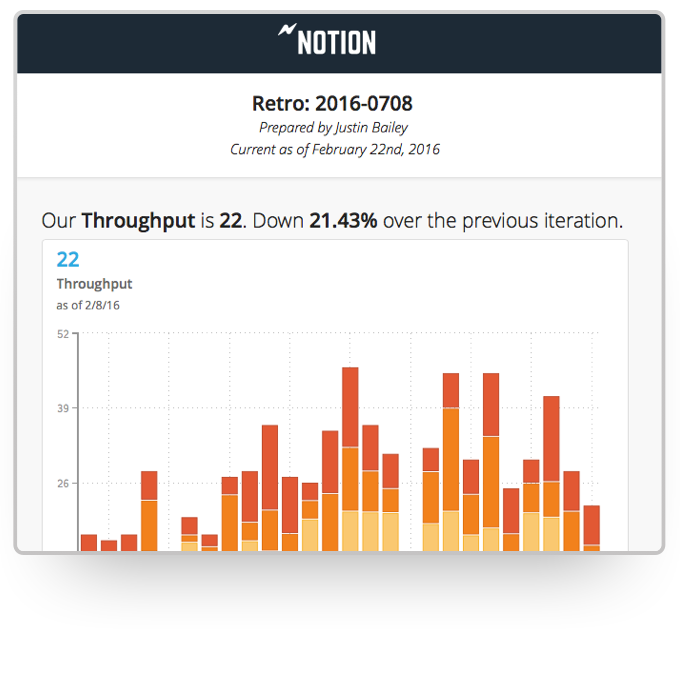 |