JarviX vs. Looker
JarviX vs. Looker
| Product | Rating | Most Used By | Product Summary | Starting Price |
|---|---|---|---|---|
 JarviX | N/A | Synergies is a cognitive application service provider that combines business knowledge, artificial intelligence technology, and software development. Their mission is to help businesses through their digital transformation journey, become leaders and innovators in their industries by unlocking the power of data in the hands of business users and decision makers. Their product, JarviX, is an AnalyticOps Platform . JarviX uses NLP… | N/A | |
 Looker | N/A | Looker is a BI application with an analytics-oriented application server that sits on top of relational data stores. It includes an end-user interface for exploring data, a reusable development paradigm for data discovery, and an API for supporting data in other systems. | N/A |
| JarviX | Looker | |||||||||||||||
|---|---|---|---|---|---|---|---|---|---|---|---|---|---|---|---|---|
| Editions & Modules | No answers on this topic | No answers on this topic | ||||||||||||||
| Offerings |
| |||||||||||||||
| Entry-level Setup Fee | No setup fee | Required | ||||||||||||||
| Additional Details | — | Must contact sales team for pricing. | ||||||||||||||
| More Pricing Information | ||||||||||||||||
| JarviX | Looker |
|---|
| JarviX | Looker | ||||||||||||||||||
|---|---|---|---|---|---|---|---|---|---|---|---|---|---|---|---|---|---|---|---|
| BI Standard Reporting |
| ||||||||||||||||||
| Ad-hoc Reporting |
| ||||||||||||||||||
| Report Output and Scheduling |
| ||||||||||||||||||
| Data Discovery and Visualization |
| ||||||||||||||||||
| Access Control and Security |
| ||||||||||||||||||
| Mobile Capabilities |
|
| JarviX | Looker | |
|---|---|---|
| Small Businesses |  Yellowfin Score 8.8 out of 10 | Yellowfin Score 8.8 out of 10 |
| Medium-sized Companies |  Reveal Score 10.0 out of 10 | Reveal Score 10.0 out of 10 |
| Enterprises |  Kyvos Semantic Layer Score 9.5 out of 10 | Kyvos Semantic Layer Score 9.5 out of 10 |
| All Alternatives | View all alternatives | View all alternatives |
| JarviX | Looker | |
|---|---|---|
| Likelihood to Recommend | 8.1 (2 ratings) | 8.3 (132 ratings) |
| Likelihood to Renew | - (0 ratings) | 9.3 (8 ratings) |
| Usability | 8.1 (2 ratings) | 8.8 (12 ratings) |
| Availability | - (0 ratings) | 10.0 (1 ratings) |
| Performance | - (0 ratings) | 6.0 (1 ratings) |
| Support Rating | 9.2 (2 ratings) | 8.8 (14 ratings) |
| Implementation Rating | - (0 ratings) | 10.0 (1 ratings) |
| Configurability | - (0 ratings) | 10.0 (1 ratings) |
| Contract Terms and Pricing Model | - (0 ratings) | 10.0 (1 ratings) |
| Ease of integration | - (0 ratings) | 10.0 (1 ratings) |
| Product Scalability | - (0 ratings) | 10.0 (1 ratings) |
| Professional Services | - (0 ratings) | 10.0 (1 ratings) |
| Vendor post-sale | - (0 ratings) | 10.0 (1 ratings) |
| Vendor pre-sale | - (0 ratings) | 10.0 (1 ratings) |
| JarviX | Looker | |
|---|---|---|
| Likelihood to Recommend | Synergies Intelligent Systems
|  Google
 Daniel Dammerman Regional Sales Director |
| Pros | Synergies Intelligent Systems
| Google
|
| Cons | Synergies Intelligent Systems
| Google
|
| Likelihood to Renew | Synergies Intelligent Systems No answers on this topic | Google
|
| Usability | Synergies Intelligent Systems
| Google
|
| Reliability and Availability | Synergies Intelligent Systems No answers on this topic | Google
 David Mynář Head Of Online Marketing |
| Performance | Synergies Intelligent Systems No answers on this topic | Google
David Mynář Head Of Online Marketing |
| Support Rating | Synergies Intelligent Systems
| Google
 Anson Abraham Data Lord |
| Implementation Rating | Synergies Intelligent Systems No answers on this topic | Google
David Mynář Head Of Online Marketing |
| Alternatives Considered | Synergies Intelligent Systems
| Google
|
| Contract Terms and Pricing Model | Synergies Intelligent Systems No answers on this topic | Google
David Mynář Head Of Online Marketing |
| Return on Investment | Synergies Intelligent Systems
| Google
|
| ScreenShots | JarviX Screenshots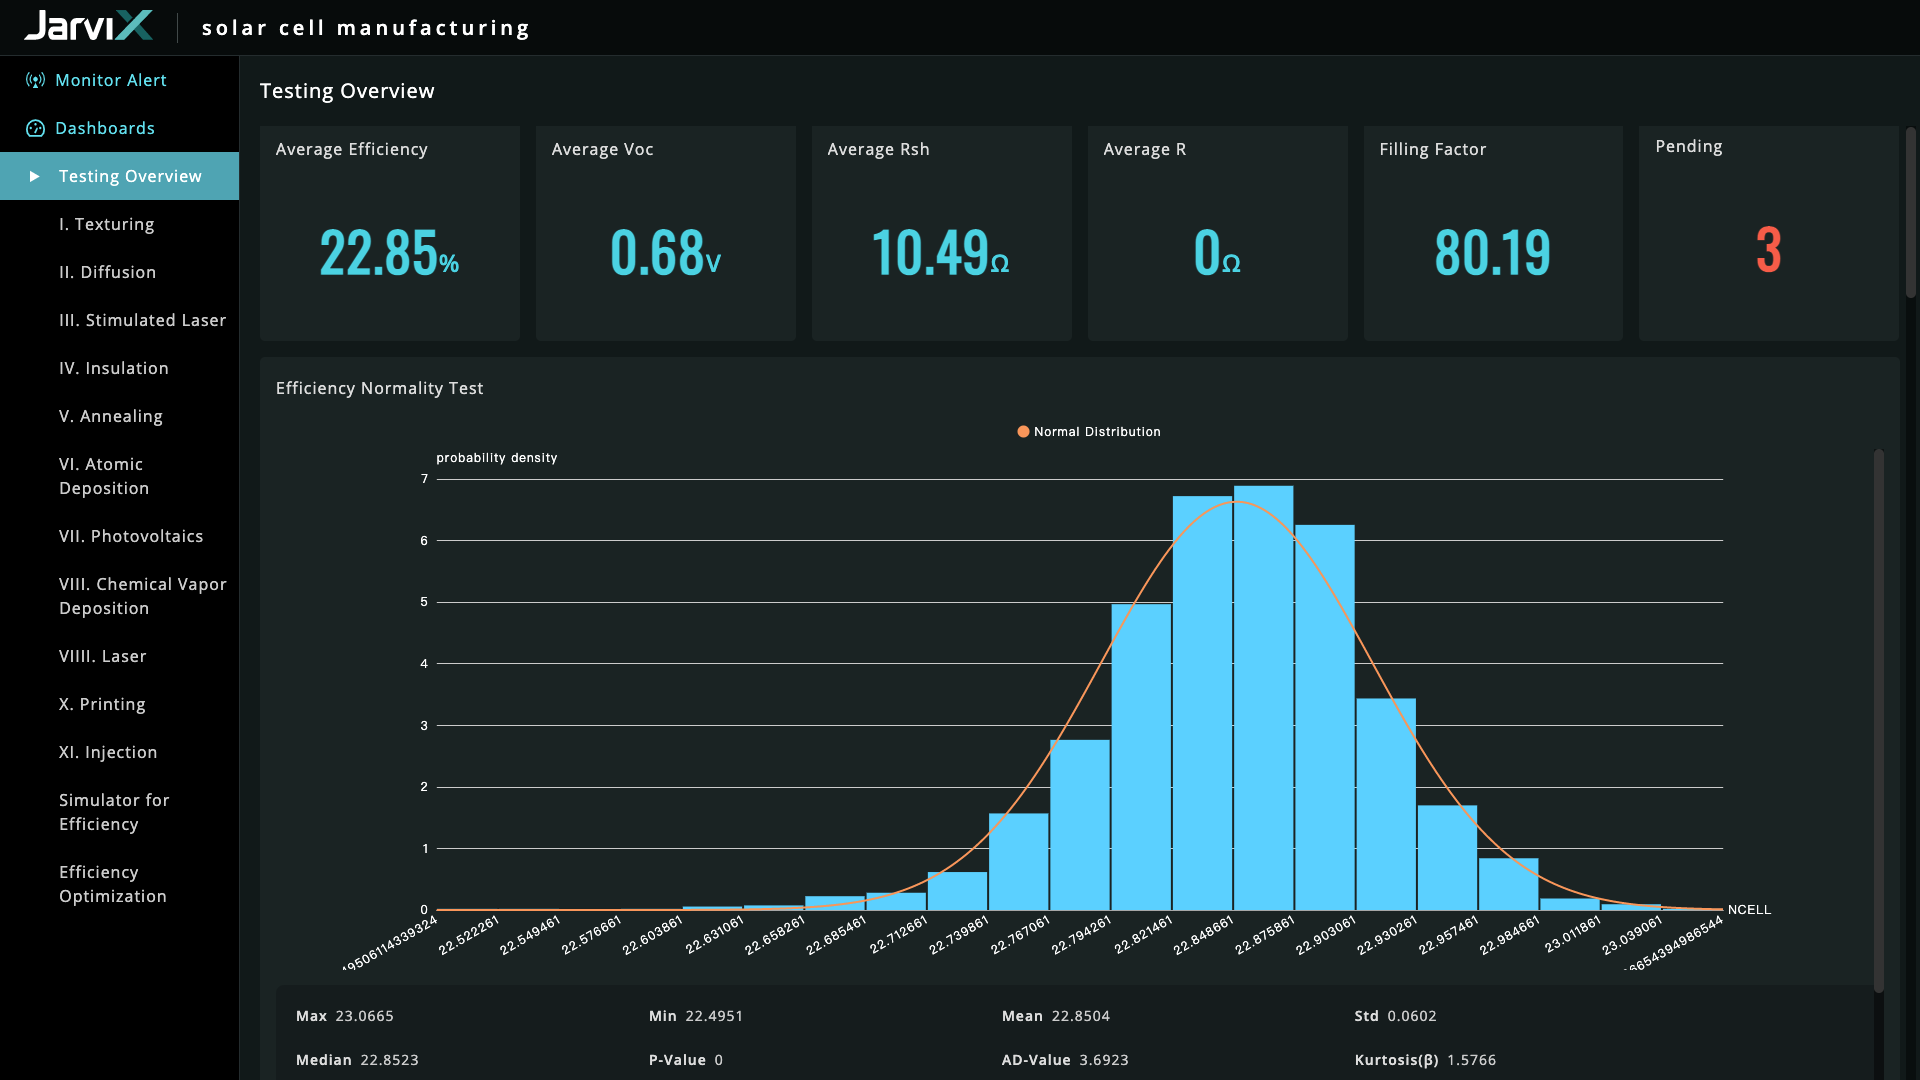   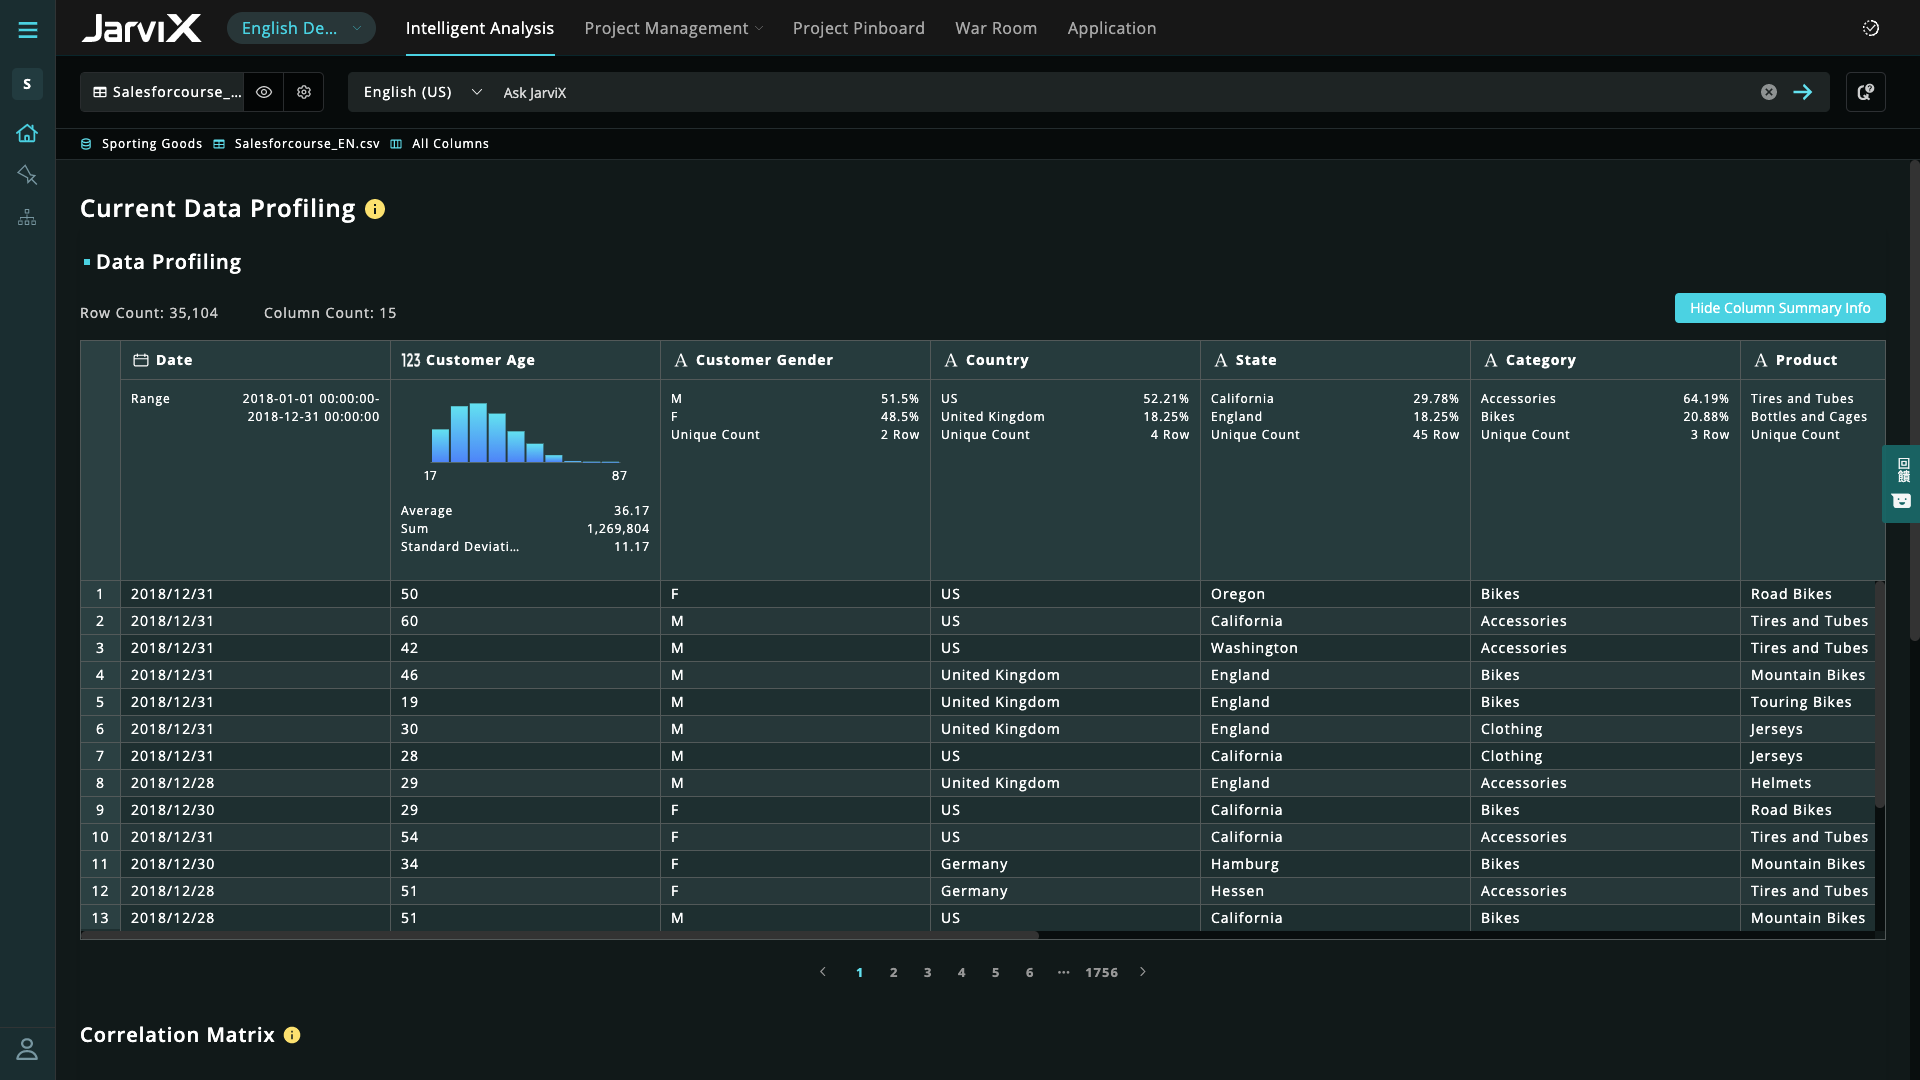   | Looker Screenshots |