Looker Studio is a data visualization platform that transforms data into meaningful presentations and dashboards with customized reporting tools.
$9
per month per user per project
Stackby
Score8.8 out of 10
N/A
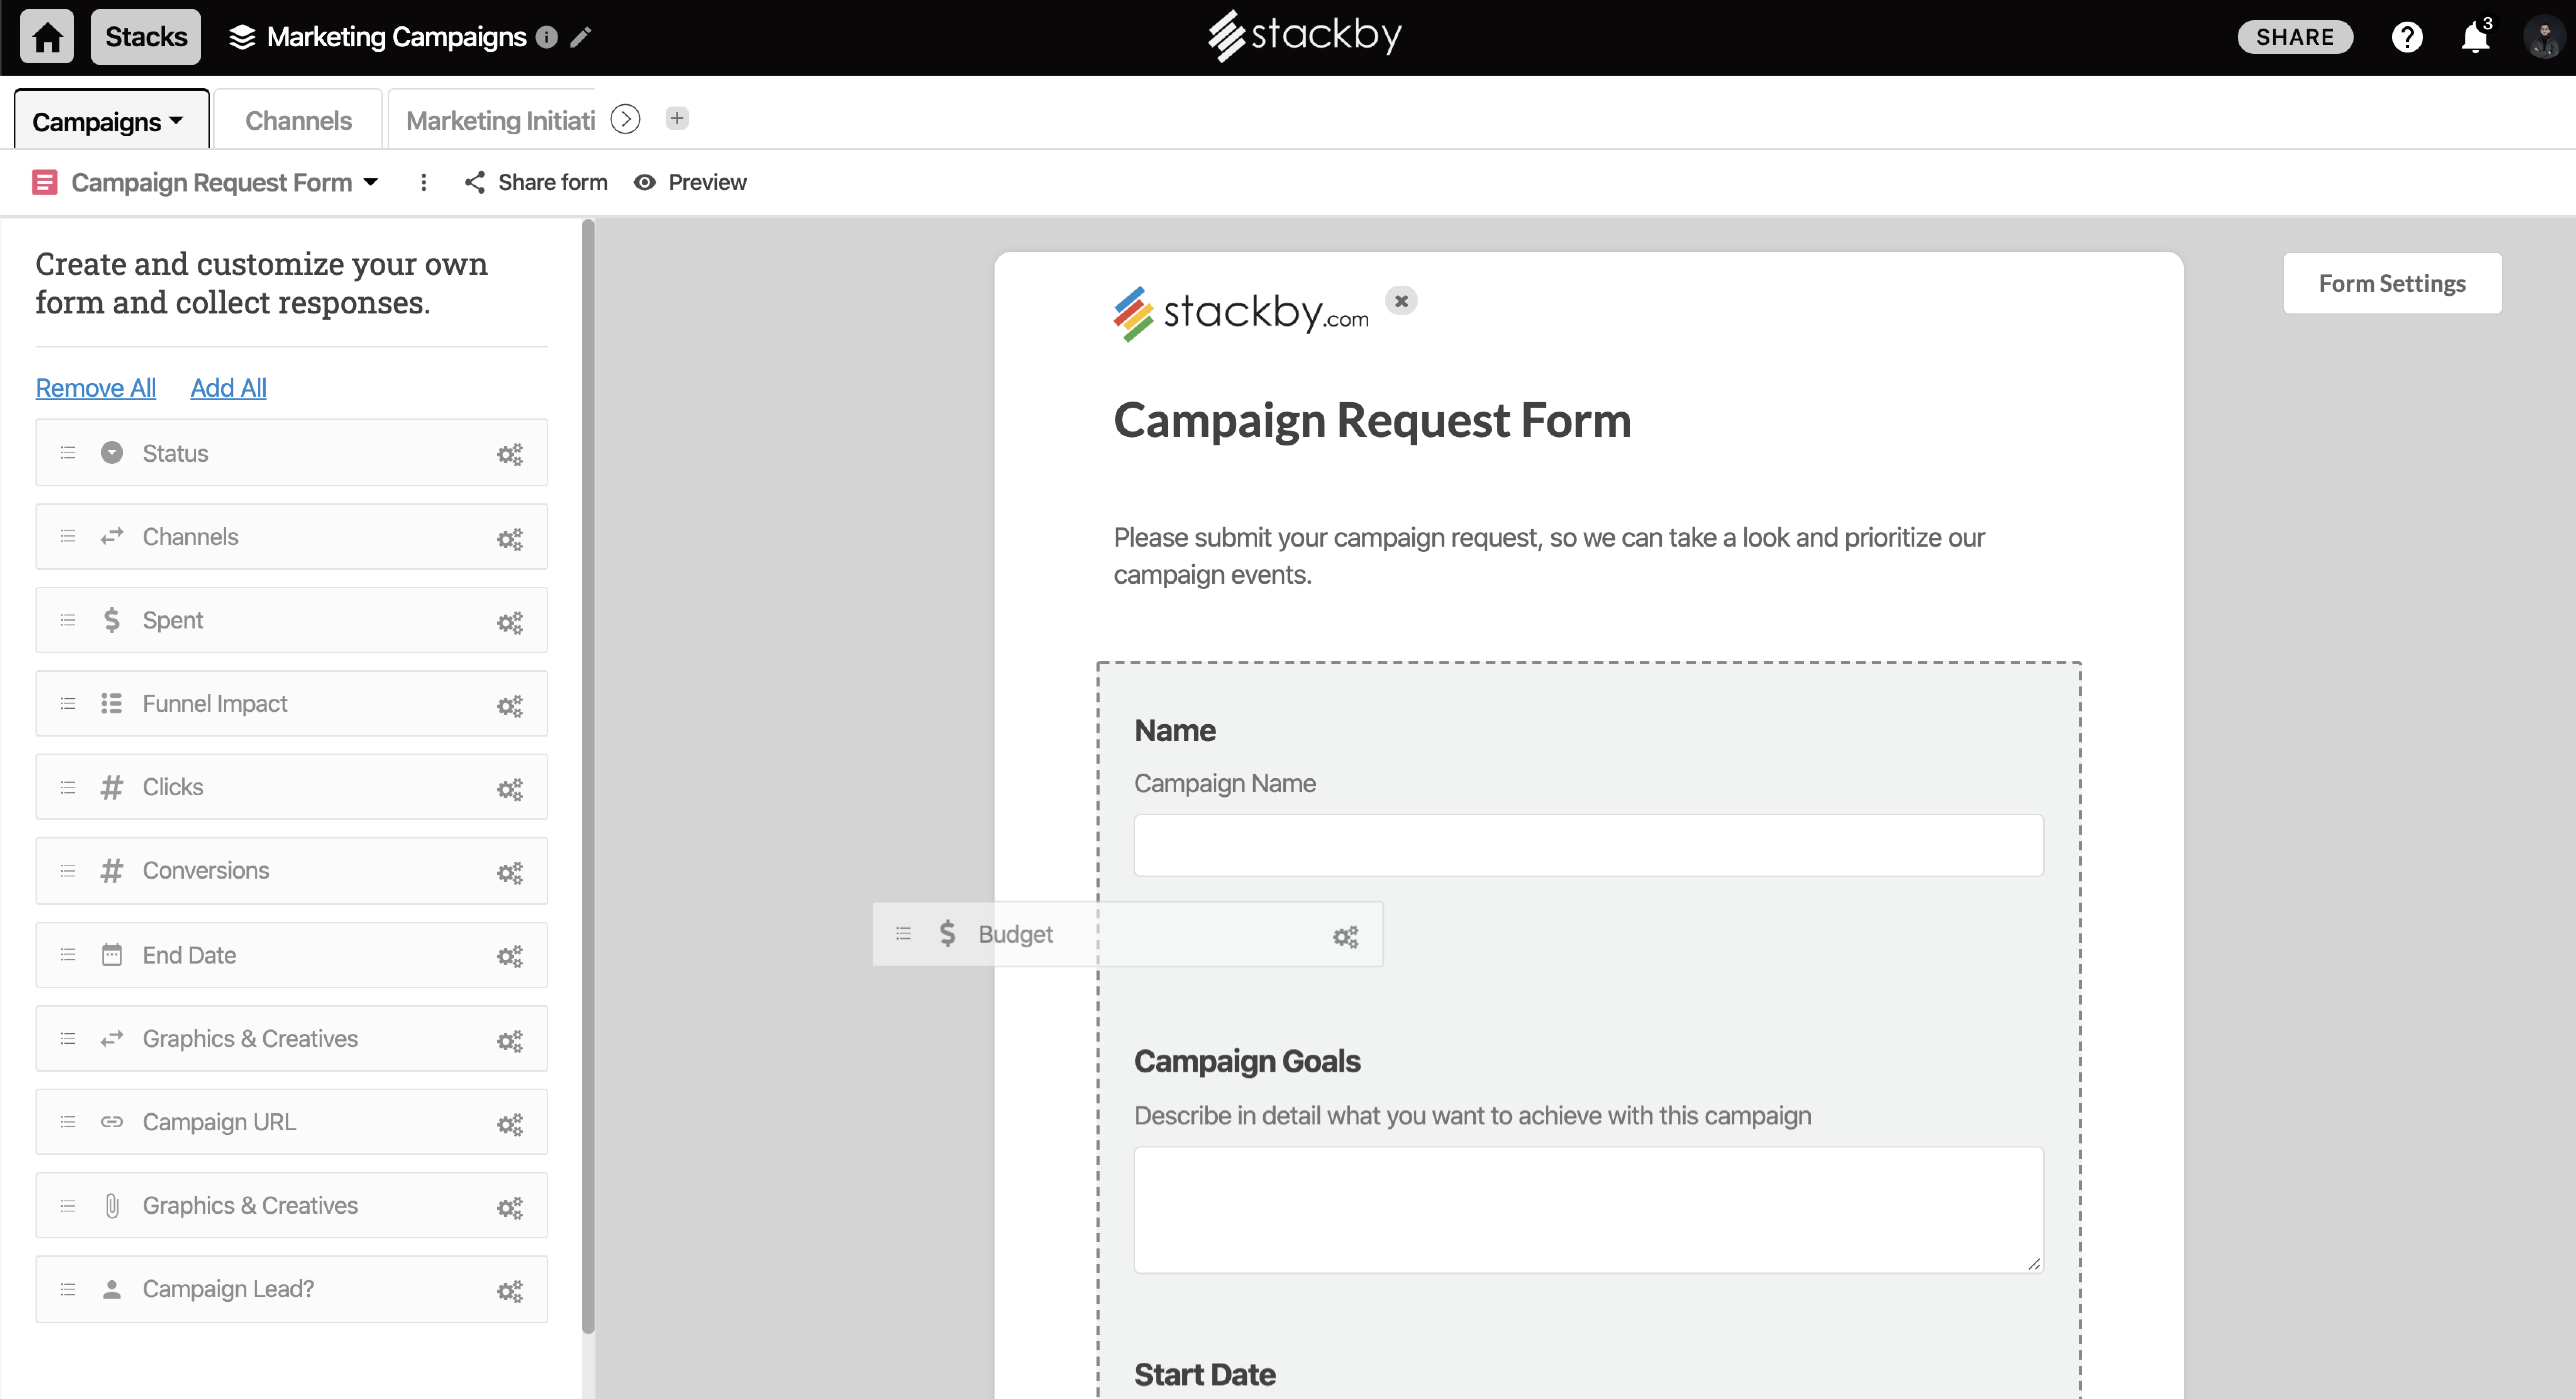
Stackby is designed to bring together the simplicity of spreadsheets, the functionality of databases and integrations with best business APIs to let anyone build their own tools, the way they want. No coding needed. Users can build a database from scratch, import data from pre-existing sources like spreadsheets or Google Sheets, or choose from over 100 pre-built templates across multiple categories. Stackby offers over 25 unique column types like text,…
Visualizing cross-channel campaign performance can blend data from a few different sources to compare performance metrics like spend, clicks, and conversions side-by-side in a single view, which helps in quick budget reallocation decisions. When dealing with massive volumes of data (millions of rows) or highly complex queries, Looker Studio dashboards can become slow, laggy, or even crash. Performance issues are a frequent complaint when working with large datasets, making it unsuitable for enterprise-level companies
A de minimis incentive was given to thank the reviewer for their time. The incentive was not used to bias or drive a particular response, nor was the incentive contingent on a positive endorsement. More Info
Based on my experience, I can provide specific scenarios where Stackby is well suited and others where it may be less appropriate: Project Management: Stackby is an excellent choice for project management scenarios. Its ability to create custom databases, track tasks, assign responsibilities, and collaborate in real-time makes it highly effective for managing and monitoring project progress. CRM and Sales: Stackby is well suited for managing customer relationships and sales processes. Its customizable database structure allows for organizing customer information, tracking leads, managing deals, and generating reports. The ability to integrate with other tools further enhances its usefulness in CRM and sales workflows. Content Planning: Stackby is a great fit for content planning scenarios. Users can create databases to manage editorial calendars, track content ideas, assign tasks to team members, and monitor content performance. Collaboration features facilitate seamless content collaboration and ensure timely publishing.
Breath of data - the number of ways to interrogate the data is endless, and the options to view metrics alongside each other make for comprehensive datasets.
Data visualisation and customisation - the options for presenting data and separating out across pages allow for clean visuals and segmented information.
Easy shareability/usability - a quick and simple tool to introduce colleagues to, and easy to grant access for them to be able to view the data, without having to understand the setup itself.
A de minimis incentive was given to thank the reviewer for their time. The incentive was not used to bias or drive a particular response, nor was the incentive contingent on a positive endorsement. More Info
It needs better handling of complex logic. We often need workarounds to perform complex custom calculations, and it can be really unpleasant at times.
Felt it got slow with a larger data set, and in one minor report, we had to set up time filters so that calculations during spikes could be traced more quickly.
Compare to competition they need to improve with notification things.
A de minimis incentive was given to thank the reviewer for their time. The incentive was not used to bias or drive a particular response, nor was the incentive contingent on a positive endorsement. More Info
Implement the same views available on desktop into the mobile app
Internal automations (like Airtable)
Ability to implement and display info as a dashboard (like Airtable)
Polish up the formatting of formulas, inputting them causes user frustration due to the formula input cursor jumping around
Better intelligence and ease of inputting data in bulk i.e have the fields automatically identify what data is being input and format appropriately (like Airtable does)
It is the simplest and least expensive way for us to automate our reporting at this time. I like the ability to customize literally everything about each report, and the ability to send out reports automatically in emails. The only issue we have been having recently is a technical glitch in the automatic email report. Sadly, there is almost no support for this tool from Google, but is also free, so that is important to take into consideration
A de minimis incentive was given to thank the reviewer for their time. The incentive was not used to bias or drive a particular response, nor was the incentive contingent on a positive endorsement. More Info
Looker Studio is easy to use, and it offers a sufficient variety of predefined visualizations to choose from. It's easy for us, and anyone can set up basic reporting without extensive data visualization skills. The interface layout is easy to understand, and it doesn't take long to get used to.
A de minimis incentive was given to thank the reviewer for their time. The incentive was not used to bias or drive a particular response, nor was the incentive contingent on a positive endorsement. More Info
Stackby is overall pretty easy to use, especially if you're used to something like Airtable or SmartSuite. Some of the pages seem like near exact clones (though they put their own creative spin on things). I'd prefer a slighty fresher interface (like SmartSuite), but I'm willing to sacrifice that for the better price and great customer service.
I give it a lower support rating because it seems like our Dev team hasn't gotten the support they need to set up our database to connect. Seems like we hit a roadblock and the project got put on pause for dev. That sucks for me because it is harder to get the dev team to focus on it if they don't get the help they need to set it up.
A de minimis incentive was given to thank the reviewer for their time. The incentive was not used to bias or drive a particular response, nor was the incentive contingent on a positive endorsement. More Info
Looker Studio is far easier to implement, stand up, and learn. The interface is simpler and user-friendly for various levels of data visualization/analysis knowledge and experience. The biggest benefit of Looker Studio, however, is its ease of connection to GA data and speed. Furthermore, since it is an online program/tool, it requires less CPU/battery/storage on the user's device.
A de minimis incentive was given to thank the reviewer for their time. The incentive was not used to bias or drive a particular response, nor was the incentive contingent on a positive endorsement. More Info
I have also tried Ora.Pm. Infinity has better graphical interface, but nowhere near as many features and the UI isn't as effective (i.e, moving around with keys). Grist has a much more technical interface and it comes from being more of a database/interactive spreadsheet vs Stackby. Grist has much more functionality in terms of formulas, but is much harder to learn to use and less other functionalities. Ora.PM is more of a test at a task management app, and doesn't compare - Stackby is much better.
A de minimis incentive was given to thank the reviewer for their time. The incentive was not used to bias or drive a particular response, nor was the incentive contingent on a positive endorsement. More Info