Looker is a BI application with an analytics-oriented application server that sits on top of relational data stores. It includes an end-user interface for exploring data, a reusable development paradigm for data discovery, and an API for supporting data in other systems.
N/A
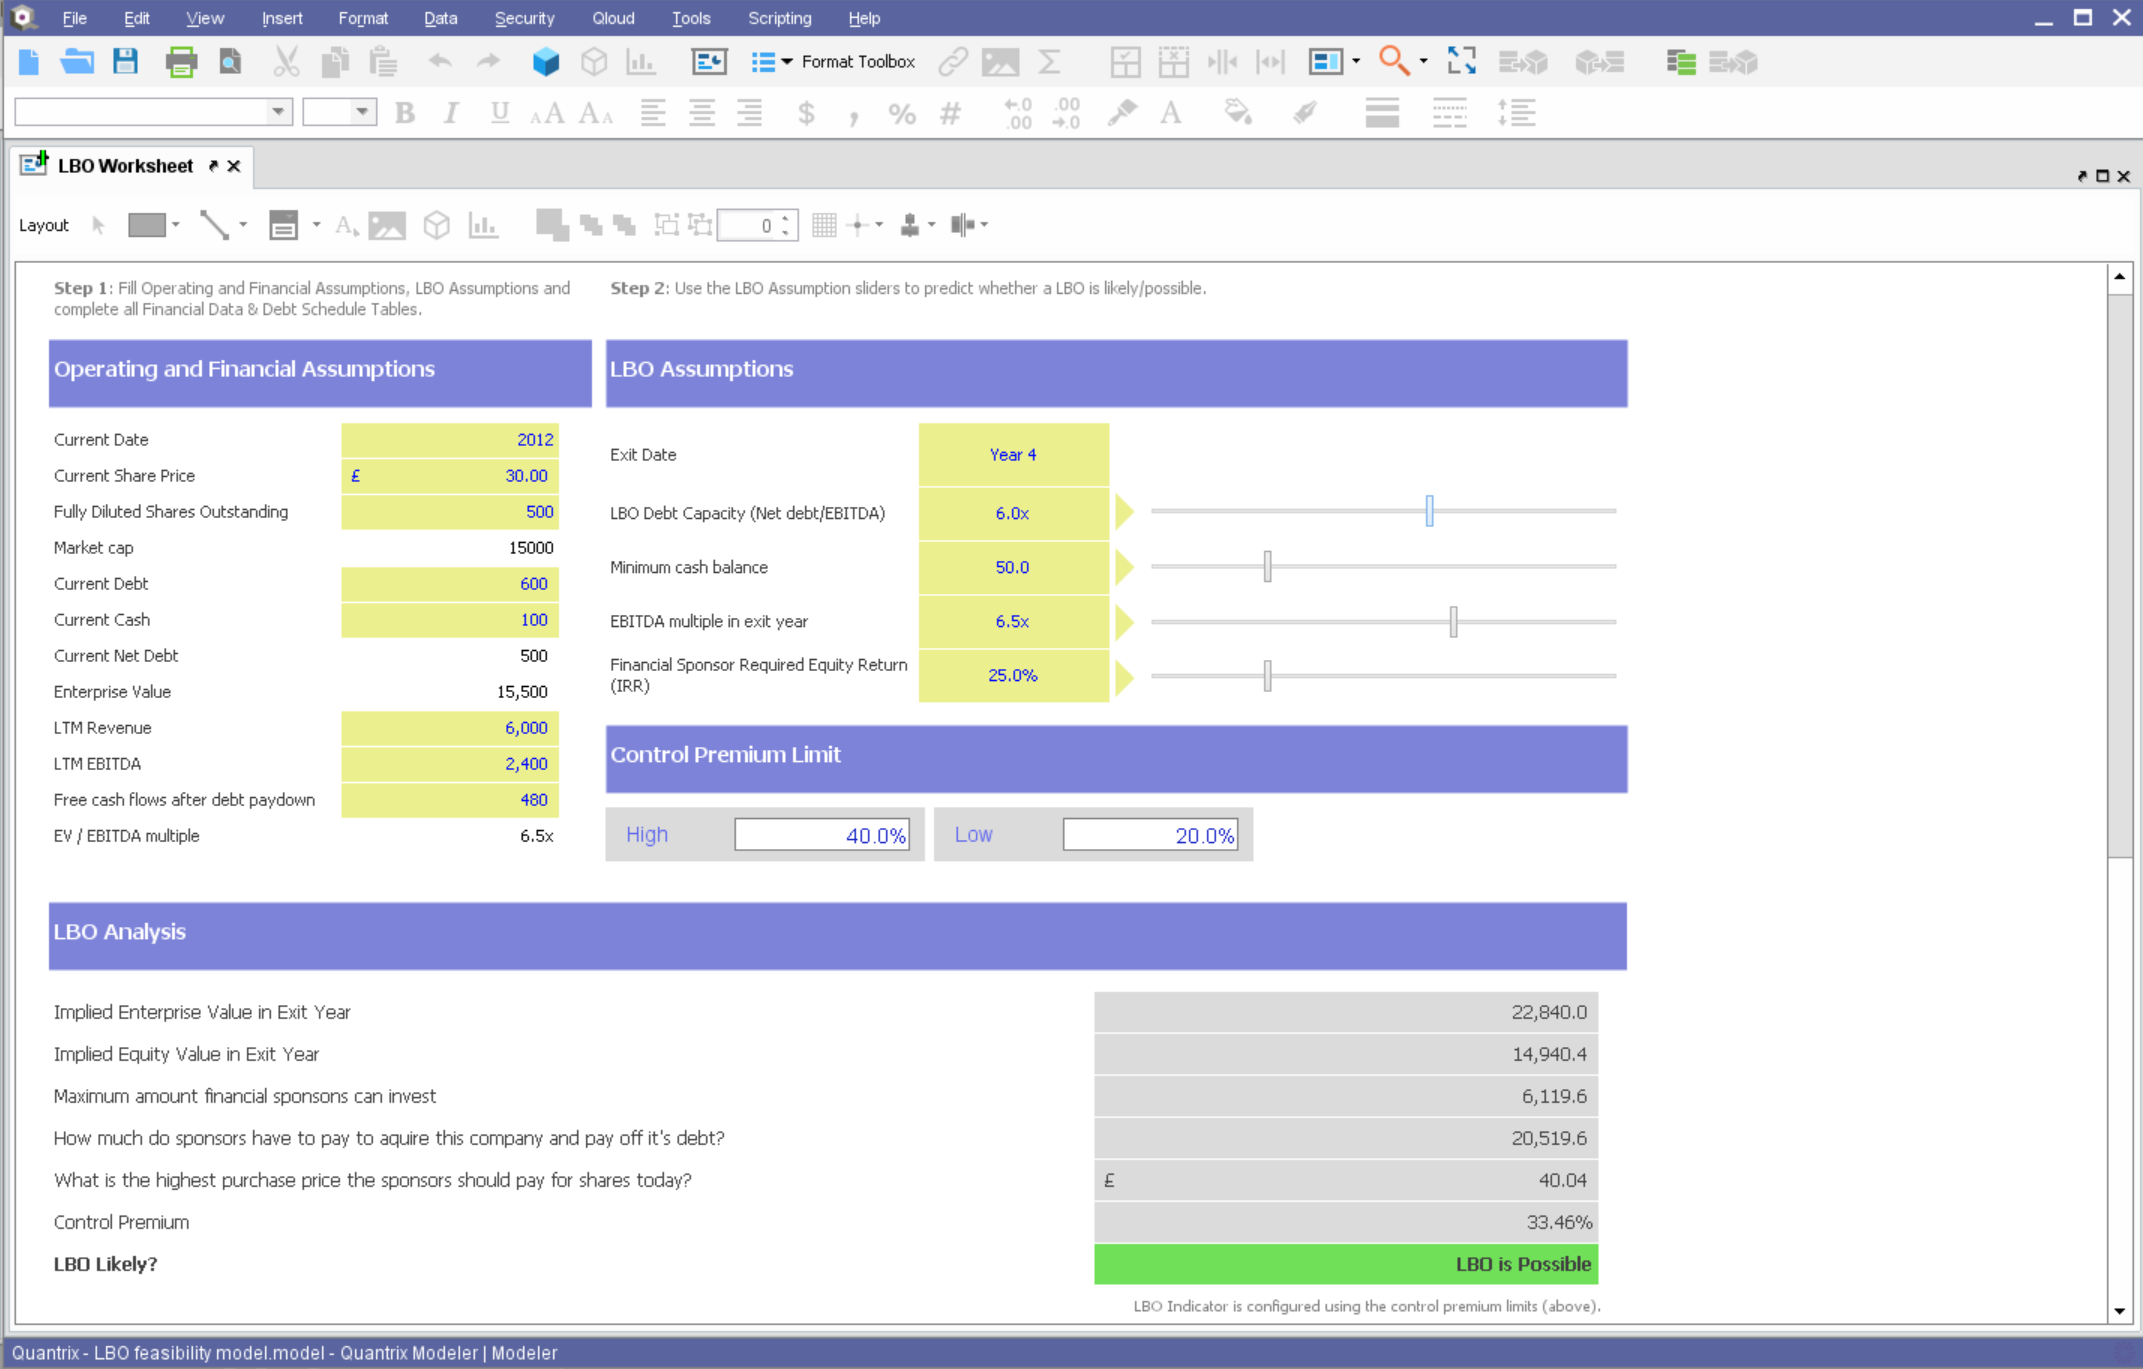
Quantrix
Score 7.4 out of 10
N/A
Quantrix is designed to allow users to address the limitations and risks inherent to spreadsheets when developing business-critical models. According to the vendor, this solution offers unmatched capability for forecasting, planning, budgeting, risk modeling and visual analytics, and also allows users to develop ‘what if’ scenarios and model the financial and operational impact of business decisions. Additionally, the vendor says sharing insight is made easier through the creation of interactive…
N/A
Pricing
Looker
Quantrix
Editions & Modules
No answers on this topic
No answers on this topic
Offerings
Pricing Offerings
Looker
Quantrix
Free Trial
Yes
Yes
Free/Freemium Version
No
No
Premium Consulting/Integration Services
Yes
Yes
Entry-level Setup Fee
Required
No setup fee
Additional Details
Must contact sales team for pricing.
Quantrix Modeler is licensed on a per user subscription basis.
More Pricing Information
Community Pulse
Looker
Quantrix
Features
Looker
Quantrix
BI Standard Reporting
Comparison of BI Standard Reporting features of Product A and Product B
Looker
7.5
133 Ratings
9% below category average
Quantrix
-
Ratings
Pixel Perfect reports
6.6109 Ratings
00 Ratings
Customizable dashboards
8.3132 Ratings
00 Ratings
Report Formatting Templates
7.6114 Ratings
00 Ratings
Ad-hoc Reporting
Comparison of Ad-hoc Reporting features of Product A and Product B
Looker
7.0
131 Ratings
14% below category average
Quantrix
-
Ratings
Drill-down analysis
6.6127 Ratings
00 Ratings
Formatting capabilities
6.7129 Ratings
00 Ratings
Integration with R or other statistical packages
5.955 Ratings
00 Ratings
Report sharing and collaboration
8.8130 Ratings
00 Ratings
Report Output and Scheduling
Comparison of Report Output and Scheduling features of Product A and Product B
Looker
8.0
127 Ratings
3% below category average
Quantrix
-
Ratings
Publish to Web
7.7105 Ratings
00 Ratings
Publish to PDF
8.0112 Ratings
00 Ratings
Report Versioning
7.983 Ratings
00 Ratings
Report Delivery Scheduling
8.4109 Ratings
00 Ratings
Data Discovery and Visualization
Comparison of Data Discovery and Visualization features of Product A and Product B
When data drives potential for new orders, Looker earns its place in our tech stack. If, on the other hand, we are hoping for pipeline generation, Looker is useful if you are willing to repeatedly go check customer utilizations .... it is not appropriate if you are hoping to automate data analysis for this purpose.
If you find yourself in the ocean of traditional spreadsheets, overwhelmed by broken links, errors, model audit problems, hardwiring, etc. here is a lifebuoy for you. If you want to have full flexibility in your budgeting and forecasting in contrast to ERPs with rigid structures and one-size-fits-all concept. If you are small or medium size company and do not want to invest in costly enterprise solutions. If you need a fast implementation https://youtu.be/5W_q5Xhw5fg
Show visited pages - sessions, pageviews - which programs are viewed the most.
Displays session source/medium views to see where users are coming from.
It shows the video titles, URLs, and event counts so we can monitor the performance of our videos.
It gives a graphic face to the numbers, such as using bar charts, pie graphs, and other charts to show user trends or which channels are driving engagement.
Our clients like to see the top pages visited for a month.
I like the drop-and-drag approach, and building charts is a little easier than it was before.
Building complex financial planning model availing of a multidimensional data structure coupled with a powerful formula language, with the immediacy and intuitiveness typical of spreadsheets
Implement quickly model modifications (new products, new scenarios, new time periods) simply adding new "items" to "categories" (corresponding to dimensions in a multidimensional data model)
Scale up models to very large datasets with very fast computation times
Easily import data from text files, other Quantrix models and external databases via DataLink and DataNAV
Save snapshots of tables computed in Quantrix to external databases via DataPush
Hard to be critical of the Quantrix team as I know they strive to produce the best product possible. I suppose the next thing on my wish list would be the application of the new Solver functionality to be available in the Qloud.
A big help for new users would be a good book on transitioning from Excel or other environment into Quantrix. I know first hand it can be difficult to transition when having to learn the program through a help guide, forums and tech support. I had a lot of trial and error in my journey to producing the desired models. On one hand it was a valuable method as it taught me a lot of what not to do, but I will admit it was not the most efficient way to do things.
Would also love to see local user groups being formed at some point in the future. Quantrix puts on a fantastic conference once a year in beautiful Maine, but it is a big journey for someone in Southern California (and limited to one or two days a year). I would like to see some local chapters formed in different areas of the country so local Quantrix users can get together more often and collaborate (maybe a quarterly or semi-annual meetup?). Our Quantrix community is still relatively small and may be a difficult task for some areas, but is also the very reason why this would be great idea.
I give it this rating because it deems as effective, I am able to complete majority of my tasks using this app. It is very helpful when analyzing the data provided and shown in the app and it's just overall a great app for Operational use, despite the small hiccups it has (live data).
Looker is relatively easy to use, even as it is set up. The customers for the front-end only have issues with the initial setup for looker ml creations. Other "looks" are relatively easy to set up, depending on the ETL and the data which is coming into Looker on a regular basis.
Somehow resources heavy, both on server and client. I recommned at least 50Mbs data rate and high performance desktop comouter to be abke to run comolex tasks and configure larger amount of data. On the other hand, the client does not need to worry when viewing, the performance is usually ok
Never had to work with support for issues. Any questions we had, they would respond promptly and clearly. The one-time setup was easy, by reading documentation. If the feature is not supported, they will add a feature request. In this case, LDAP support was requested over OKTA. They are looking into it.
Looker Studio, you can easily report on data from various sources without programming. Looker Studio is available at no charge for creators and report viewers. Enterprise customers who upgrade to Looker Studio Pro will receive support and expanded administrative features, including team content management. So it's good.
Overall, I was not part of the ultimate decision to purchase Quantrix. I terms of user-friendliess and robust reporting capabilities I do think Tableau has Quantrix outclassed. That being said, Quantrix does provide more in-depth analyses for our relevant data and provides better modeling for our forecasts out of the box. The accuracy of the tools output is also much better
Looker has a poignant impact on our business's ROI objectives. As an advertising exchange we have specific goals for daily requests and fill, and having premade Looks to monitor this is an integral piece of our operational capability
To facilitate an efficient monthly billing cycle in our organization, Looker is essential to track estimated revenue and impression delivery by publisher. Without the Looks we have set up, we would spend considerably more time and effort segmenting revenue by vertical.
Looker's unique value proposition is making analytical tools more digestible to people without conventional analytical experience. Other competing tools like Tableau require considerably more training and context to successfully use, and the ability to easily plot different visualizations is one of its greatest selling points.
Capacity forecasting used to take hours to calculate with a ton of manual modifications. Quantrix has automated that so a model can be updated at any time with a click of a button
The accuracy of the models is incredible. It took some tweaking to add in data scubbers, but now it runs almost flawlessly
The confidence the management teams have in the output of the model is amazing. Before, people would question the output, have you rebuild it, and then compare. Now the report comes out and the output has high confidence.