Piwik is an open source analytics platform that enables users to measure web and mobile apps as well as intranet portals. It protects the privacy of users through advanced privacy features and its approach to data ownership. Piwik offers On-premises and Cloud deployment options.
Available in over 50 languages, it is fully customisable and vendor-independent. Piwik offers over 70 integrations with Content Management Systems, Ecommerce solutions, Forums as well as other mobile and web platforms.…
$0
QlikView
Score 8.2 out of 10
N/A
QlikView® is Qlik®’s original BI offering designed primarily for shared business intelligence reports and data visualizations. It offers guided exploration and discovery, collaborative analytics for sharing insight, and agile development and deployment.
N/A
Pricing
Matomo Analytics
QlikView
Editions & Modules
Free download (open source)
$0
Free 30 day trial
$0
limited to 30 days
Essential
$9
number of pageviews (monthly traffic)
Business
$29
number of pageviews (monthly traffic)
Enterprise
$199
your requirements and monthly traffic
Content Optimization Bundle
$579
per installation
Growth Bundle
$1,149
per installation
Premium Bundle
$1,499
per installation
Email Support Subscription
$2,090
per installation
QlikView
Custom
per user
Offerings
Pricing Offerings
Matomo Analytics
QlikView
Free Trial
Yes
Yes
Free/Freemium Version
Yes
No
Premium Consulting/Integration Services
Yes
Yes
Entry-level Setup Fee
Optional
Optional
Additional Details
On-premise Edition is free to download and install on one's own servers.
On an perpetual license basis, based on server plus number of users.
Contact vendor for pricing.
More Pricing Information
Community Pulse
Matomo Analytics
QlikView
Features
Matomo Analytics
QlikView
Web Analytics
Comparison of Web Analytics features of Product A and Product B
Matomo Analytics
9.8
2 Ratings
19% above category average
QlikView
-
Ratings
Lead Conversion Tracking
10.02 Ratings
00 Ratings
Bounce Rate Measurement
10.02 Ratings
00 Ratings
Device and Browser Reporting
10.02 Ratings
00 Ratings
Pageview Tracking
10.02 Ratings
00 Ratings
Event Tracking
10.01 Ratings
00 Ratings
Reporting in real-time
8.32 Ratings
00 Ratings
Referral Source Tracking
10.02 Ratings
00 Ratings
Customizable Dashboards
10.02 Ratings
00 Ratings
BI Standard Reporting
Comparison of BI Standard Reporting features of Product A and Product B
Matomo Analytics
-
Ratings
QlikView
8.5
68 Ratings
4% above category average
Pixel Perfect reports
00 Ratings
8.050 Ratings
Customizable dashboards
00 Ratings
9.466 Ratings
Report Formatting Templates
00 Ratings
8.060 Ratings
Ad-hoc Reporting
Comparison of Ad-hoc Reporting features of Product A and Product B
Matomo Analytics
-
Ratings
QlikView
8.1
67 Ratings
1% above category average
Drill-down analysis
00 Ratings
8.366 Ratings
Formatting capabilities
00 Ratings
7.767 Ratings
Integration with R or other statistical packages
00 Ratings
8.336 Ratings
Report sharing and collaboration
00 Ratings
8.262 Ratings
Report Output and Scheduling
Comparison of Report Output and Scheduling features of Product A and Product B
Matomo Analytics
-
Ratings
QlikView
8.6
62 Ratings
5% above category average
Publish to Web
00 Ratings
8.049 Ratings
Publish to PDF
00 Ratings
9.056 Ratings
Report Versioning
00 Ratings
7.542 Ratings
Report Delivery Scheduling
00 Ratings
10.048 Ratings
Data Discovery and Visualization
Comparison of Data Discovery and Visualization features of Product A and Product B
If you want to balance data-driven marketing and a privacy-minded approach to analytics, Matomo Analytics is for you. It's easy to be compliant with GDPR and other regulations while still having detailed (anonymized) analytics that help inform what content is resonating vs what content is not resonating. And of course you also get all of the rich referral, campaign, and goal conversion data to help you optimize your marketing.
Sales data validations have helped manage our justifications in the past, especially with regard to new product development and new business introduction. It has also been helpful in identifying trends with business impact and direction specific to quarter and monthly sales from ERP data as well as decisions to purchase equipment of staffing based on run rates and product demand.
One thing that can get out of hand is data output - if you aren't careful in your query, you may be overloaded with data dumps and drown in the amount of info you have to filter through. This is a user caution, not a comment on the software itself.
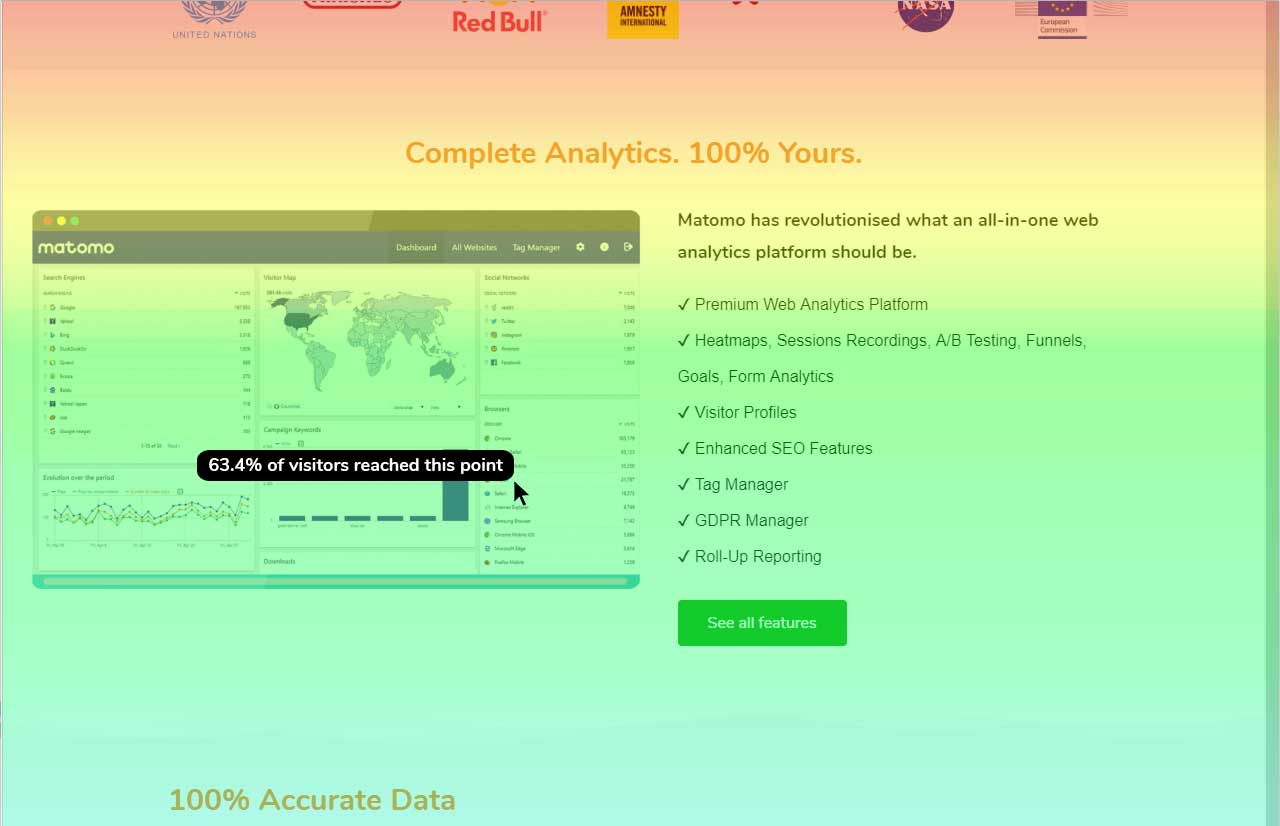
One of Piwik's strengths is the provision of customizable widgets for different bits of analytics data. The ability to add and remove them, change dates and more makes this a flexible way to visualize data.
The visitor log section is also rich, providing date, keywords, actions and more in a single table, which makes it easy to identify your most effective content.
And the visitor actions table includes both bounce rate and time on site, so you can quickly tell which pages have the most engagement.
Data display is a strength for Piwik, as you have access to overview charts while simultaneously being able to drill deeper.
From a user security standpoint it would be useful to provide users the ability to have two-factor authentication. While stats data is not necessarily sensitive in aggregate, some users may feel that certain portions need to be more secure.
It would be nice if there was a tighter integration with the Google search/referrer API so that "keyword not defined" would be replaced more often with the actual keyword that is being used to send a visitor to a site.
An easier branding method, maybe in the form of an API function set, that pulled branding URLs from a set of database fields would be great as well.
We found that QlikView can be a bit slow in supporting some forms of encryption. It is web-based and we needed to upgrade all of our server to not support the older SSL and TLS 1 protocols, only support TLS 1.2 and TLS 1.3. However, QlikView could not run with TLS 1.2 and TLS 1.3. We had to wait over six months to get a version that would handle the newer TLS versions.
There are so many options with QlikView that you can get lost when developing a visualization. There are still items I have not yet figured out, such as labeling a graph with the name of a selected detail item.
QlikView works by pulling the data it is going to use for visualization into its database. I am a security reviewer and I need to make certain that PII and PHI is not pulled by QlikView for a visualization, otherwise this could become a reportable indecent.
At this point, there is not a single conceivable reason as to why we would not renew and continue to use Piwik Analytics. Especially since it is a free program and open source. The product will only get better over time as more people look into it and donate to cause so that development can continue.
Ease of use, ability to load from pretty much any data source. today I created an application that loaded time sheets from excel that are not in a table format. With Qlik's "enable transformation steps" I was able to automate loads of multiple spreadsheets and multiple tabs easily. Could not do that with any other tool.
Piwik succeeds in presenting me (and my associates and my clients...) large amounts of data in a user friendly way. The interface and functionality can easily be customized. While some enhancements do need technical background (API calls by programming language from the webserver or javascript), others are easy to use (goal / event tracking)
QlikView is very easy to implement. The installation is very straight forward. QlikView has several different data connectors that can connect to different data sources very smoothly. The user interface to build the reports is very easy to understand. This helps to have a smaller learning curve. Something very helpful is that QlikView is a browser application for the end users. So, you don't need to install any applications on the user's computer.
The best thing about the Matomo support is that they have a forum which basically you can find the answer to almost all of your questions and most of the time you don't need to contact them regarding your questions and problems but if you need help they will answer in a reasonable time slots.
My experience with the Qlik support team has been somewhat limited, but every interaction I have had with them has been very professional and I received a response quickly. Typically if there is a technical issue, our IT team will follow up. My inquiries are specific to product functionality, and Qlik has been very helpful in clarifying any questions I might have.
My team attended, but I cannot myself rate, but I think it was good as they've successfully launched a training program at our company themselves for users. It was 3-4 day training.
Training was as expected. The demo environments tend to be more fully featured that our own environment, but the training was clear and well delivered.
"Implementation" can mean a few things... so I'm not sure that this is the answer you want.... but here it goes: To me, implementation means: "Is the user interface intuitive and can I produce meaningful reports with ease?" On that score, I'd say YES. The amount of training required was minimal and the results were powerful. The desktop implementation is a simple, "blank" interface just waiting for your creativity. The pre-populated templates give you a reasonable start to any project -- and a good set of objects to "play around with" if you're just getting started. Finally, note that the "implementation" I used was baked into QuickBooks 2016 Enterprise -- called "Advanced Reporting"..... That integration makes it ultra useful and simple.
It is much more robust out of the box, easier to set up and more intuitive to use. The reports are set up already and it requires little to no setup after installation to start gathering insights.
The only other vendor product that I have worked with that provides a similar experience to Qlikview is Tableau. I would recommend Tableau if your use case is to build a fixed dashboard. You can share reports for free without needing to buy additional licenses. I would recommend Qlikview if your users are looking for a more interactive experience. They can create new objects to represent the data which can't be accomplished as easily in Tableau
You can use the free desktop version to do a lot of reporting and analysis work more quickly so the ROI is huge
QlikView is great at finding outliers such as data entry errors
QlikView is great at helping you quickly discover new insights about your business that can prompt you to take action that can immediately affect your cash flow.