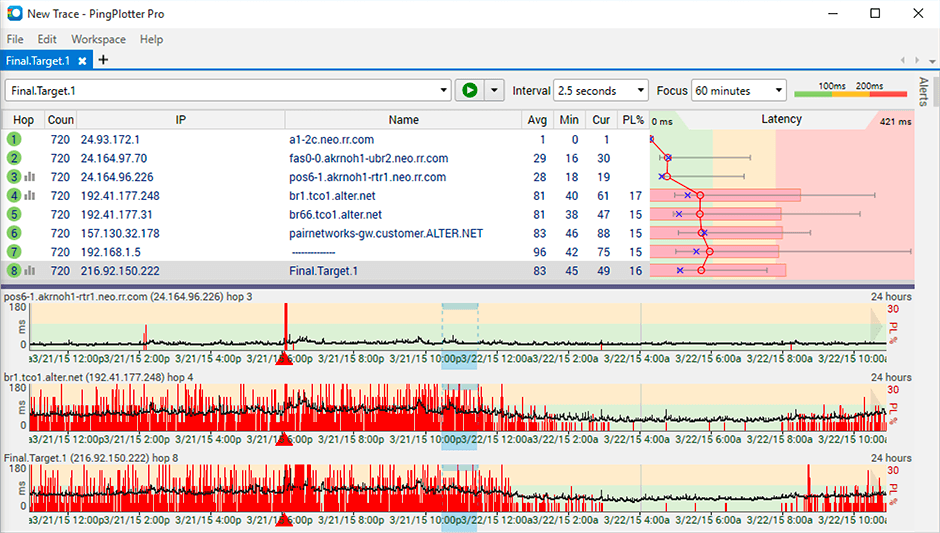
PingPlotter is a graphical traceroute and ping tool that visualizes network performance in a way that makes identifying the source of problems quicker and easier for everyone from online gamers and video streamers to VoIP admins and IT pros. Features for remote deployment, network monitoring, scripting, and a web interface are included along with several additional capabilities.
$0
per user
Zabbix
Score8.5 out of 10
N/A
Zabbix is an open-source network performance monitoring software. It includes prebuilt official and community-developed templates for integrating with networks, applications, and endpoints, and can automate some monitoring processes.
This tool is best suited to get a quick read on basic network access across multiple hops. It provides immediate, very valuable feedback. If you know your stuff, there are other tools that handle the rest you need: packet capture, port scans, etc. We are all looking for that multi-tool, but this is perfect for the basic need of knowing where in the network a problem might be.
Zabbix is great for monitoring your servers and seeing alerts when the system uses too much CPU or memory. This allowed the system Engineer to be proactive and add resources to these systems to avoid interrupting the services. Especially servers running operations applications and services. This is one of the best usages for Zabbix.
A de minimis incentive was given to thank the reviewer for their time. The incentive was not used to bias or drive a particular response, nor was the incentive contingent on a positive endorsement. More Info
Collecting hardware data - CPU, Memory, Network, and Disk Metrics are collected and reported on.
Flexible design - It is very easy to build out even very large environments via the templating system. You can also start where you are - network monitoring, server monitoring, etc. and then build it out from there as time and resources permit.
Provides a "plugin architecture" (via XML templates) to allow end users to extend it to monitor all kinds of equipment, software, or other metrics that are not already added into the software already.
Very complete documentation. Almost every aspect of Zabbix has been documented and reported on.
Cost - Zabbix is FOSS software and always free. Support is reasonably priced and readily available.
A de minimis incentive was given to thank the reviewer for their time. The incentive was not used to bias or drive a particular response, nor was the incentive contingent on a positive endorsement. More Info
Being able to export data would have been helpful for a larger analysis.
It is a robust program and probably more than we needed for a small business; some options that were better aligned with our budget would have been good.
As a non-technical person in the networking space, I found the data helpful for communicating, but not always easy to understand.
A de minimis incentive was given to thank the reviewer for their time. The incentive was not used to bias or drive a particular response, nor was the incentive contingent on a positive endorsement. More Info
It is free. It didn't cost anything to implement (other than my time and the cost incurred for it) and it is filling a badly needed gap in our IT infrastructure. Support is available if we have issues and can be done annually or paid for on a per incident basis as needed. Expansion, updates, and all other future lifecycle activities are likewise free of cost, so as long as someone is able to implement/maintain the software (and the OSS project is maintained) then I imagine the company will never leave it.
A de minimis incentive was given to thank the reviewer for their time. The incentive was not used to bias or drive a particular response, nor was the incentive contingent on a positive endorsement. More Info
I installed it and it just started working. I realized I could then tweak it to show what I needed but didn't have to spend a long time configuring it before use, editing YAML files etc. Maybe that's fine for a network professional, but I only need this software if something goes wrong, and then need it to work quickly out of the box.
A de minimis incentive was given to thank the reviewer for their time. The incentive was not used to bias or drive a particular response, nor was the incentive contingent on a positive endorsement. More Info
I think every organization, especially the IT department, needs a tool like this. I know of another product like Zabbix that gives a similar or the same solution, but its range makes it very useful. You can see almost all the device info in one place: disk usage, disk space, network usage, etc.
A de minimis incentive was given to thank the reviewer for their time. The incentive was not used to bias or drive a particular response, nor was the incentive contingent on a positive endorsement. More Info
I have not had much contact with the PingPlotter support, only one time have I went to them and it was a positive experience. The questions I had were answered quickly and professionally. I have no issue with the experience I had with the Support team. This was from before and after the purchase of the product.
A de minimis incentive was given to thank the reviewer for their time. The incentive was not used to bias or drive a particular response, nor was the incentive contingent on a positive endorsement. More Info
The setup is the most time-consuming portion of using zabbix. It takes a lot of effort to shape it into a usable format and even then it can get very messy. It's not exactly intuitive and as mentioned the UI seems a bit antiquated. If I was to roll out a monitoring solution from scratch, I'd probably look for alternatives which are easier to use and maintain.
A de minimis incentive was given to thank the reviewer for their time. The incentive was not used to bias or drive a particular response, nor was the incentive contingent on a positive endorsement. More Info
We are a mainly Windows environment, so it would be useful if we could have used Active Directory to deploy agents. As of version 4.2, Zabbix has announced a new agent MSI file to allow exactly that. Unfortunately, we didn't have that option. Also, for Linux and MAC deployments, there is no simple way to deploy that. Using remote scripts you may be able to create something, but most places will opt for either SNMP (agentless) or manual installation of agents to add to Zabbix. A way of deploying agents via discovery would go a long way to helping in the adoption of the tool.
A de minimis incentive was given to thank the reviewer for their time. The incentive was not used to bias or drive a particular response, nor was the incentive contingent on a positive endorsement. More Info
I used Ping.app and UptimeLog.app on the Mac. These both provided different aspects. These two had a menubar to show me green or red for multiple connections. UptimeLog showed me very clearly when my connectivity was on or off and for exactly how long
We're using the Solarwinds suite as our global monitoring standard, but it is very complex and its licensing model makes it difficult to monitor a wide range of technologies. So, we're using Zabbix as a complement on our monitoring process. Zabbix is a way more flexible and has free integrations to a wide range of technologies. It is also more 'user friendly' and easy to manage.
A de minimis incentive was given to thank the reviewer for their time. The incentive was not used to bias or drive a particular response, nor was the incentive contingent on a positive endorsement. More Info
A de minimis incentive was given to thank the reviewer for their time. The incentive was not used to bias or drive a particular response, nor was the incentive contingent on a positive endorsement. More Info