Chose Airbrake
I chose Airbrake over Sentry and Rollbar primarily because I’m most familiar with Airbrake, I’ve been using it for many years now so it’s well-established and I know what I’m getting and that it works.
| Product | Rating | Most Used By | Product Summary | Starting Price |
|---|---|---|---|---|
 Airbrake | N/A | Airbrake, now from LogicMonitor (acquired February 2021) is an error monitoring and performance insight tool. Airbrak offers real-time error alerts, rich contextual data about why errors are occurring, integration into an existing workflow, and application performance insights to enable users to identify, diagnose, and fix problems - before users get annoyed. | $0 per month | |
 Datadog | N/A | Datadog is a monitoring service for IT, Dev and Ops teams who write and run applications at scale, and want to turn the massive amounts of data produced by their apps, tools and services into actionable insight. | $18 per month per host | |
 Sentry | N/A | Sentry provides engineering teams with tools to detect and solve user-impacting bugs and other issues. | $26 per month |
| Airbrake | Datadog | Sentry | ||||||||||||||||||||||
|---|---|---|---|---|---|---|---|---|---|---|---|---|---|---|---|---|---|---|---|---|---|---|---|---|
| Editions & Modules |
|
|
| |||||||||||||||||||||
| Offerings |
| |||||||||||||||||||||||
| Entry-level Setup Fee | No setup fee | Optional | No setup fee | |||||||||||||||||||||
| Additional Details | Airbrake offers plans that include up to 200M errors, plus unlimited on-demand errors. Start your free trial and find the plan that right for your needs. 10% discount available for annual pricing. | Discount available for annual pricing. Multi-Year/Volume discounts available (500+ hosts/mo). | — | |||||||||||||||||||||
| More Pricing Information | ||||||||||||||||||||||||
| Airbrake | Datadog | Sentry | |
|---|---|---|---|
| Considered Multiple Products | Airbrake  Daniele Dolci Full-stack Developer Chose Airbrake Better feedback among programmers  Tyler McWilliam Software Engineer Chose Airbrake We use Airbrake alongside monitoring and alerting platforms. Airbrake is good for tracking small bugs down but it would be nice if it integrated more seamlessly with other performance monitoring platforms. |  Datadog  Jeffrey van Santen Sr SWE Chose Datadog Datadog is a more complex but complete solution than any of the other Log Aggregation, monitoring, or general observabilty tools that we have trialed. I found it easier to setup following useful and up-to-date documentation provided directly by Datadog instead of scattered …  Fernando Battistella DevOps Engineer Chose Datadog ease of use and implementation, other than New Relic (which I think is terrible in every possible way), the other two support opentelemetry better, have more manageable costs and comparable basic services, but they do not have the breadt of services dd does. | Sentry  Nazif Aksay QA and Observability Engineer Chose Sentry It is cheaper and offers better support for front-end applications for enterprise large environments with more then 30 scrum teams and hundreds of micro frontend applications. The configuration options, both with the agent and from the user interface, are superior to other … |
| Airbrake | Datadog | Sentry | |
|---|---|---|---|
| Small Businesses |  GitLab Score 8.7 out of 10 |  InfluxDB Score 8.8 out of 10 | GitLab Score 8.7 out of 10 |
| Medium-sized Companies | GitLab Score 8.7 out of 10 |  Sumo Logic Score 8.8 out of 10 | GitLab Score 8.7 out of 10 |
| Enterprises | GitLab Score 8.7 out of 10 |  NetBrain Technologies Score 9.2 out of 10 | GitLab Score 8.7 out of 10 |
| All Alternatives | View all alternatives | View all alternatives | View all alternatives |
| Airbrake | Datadog | Sentry | |
|---|---|---|---|
| Likelihood to Recommend | 7.9 (16 ratings) | 9.4 (55 ratings) | 9.0 (15 ratings) |
| Usability | - (0 ratings) | 9.2 (34 ratings) | 8.0 (3 ratings) |
| Support Rating | - (0 ratings) | 8.9 (6 ratings) | - (0 ratings) |
| Airbrake | Datadog | Sentry | |
|---|---|---|---|
| Likelihood to Recommend | LogicMonitor
| Datadog
| Sentry
|
| Pros | LogicMonitor
| Datadog
| Sentry
 Luke Abbott Developer |
| Cons | LogicMonitor
Tyler McWilliam Software Engineer | Datadog
| Sentry
|
| Likelihood to Renew | LogicMonitor No answers on this topic | Datadog
| Sentry No answers on this topic |
| Usability | LogicMonitor No answers on this topic | Datadog
Jeffrey van Santen Sr SWE | Sentry
|
| Support Rating | LogicMonitor No answers on this topic | Datadog
| Sentry No answers on this topic |
| Implementation Rating | LogicMonitor No answers on this topic | Datadog
| Sentry No answers on this topic |
| Alternatives Considered | LogicMonitor | Datadog
| Sentry
Nazif Aksay QA and Observability Engineer |
| Return on Investment | LogicMonitor
| Datadog
| Sentry
 Rahul Jain Senior Software Engineering |
| ScreenShots | Airbrake Screenshots   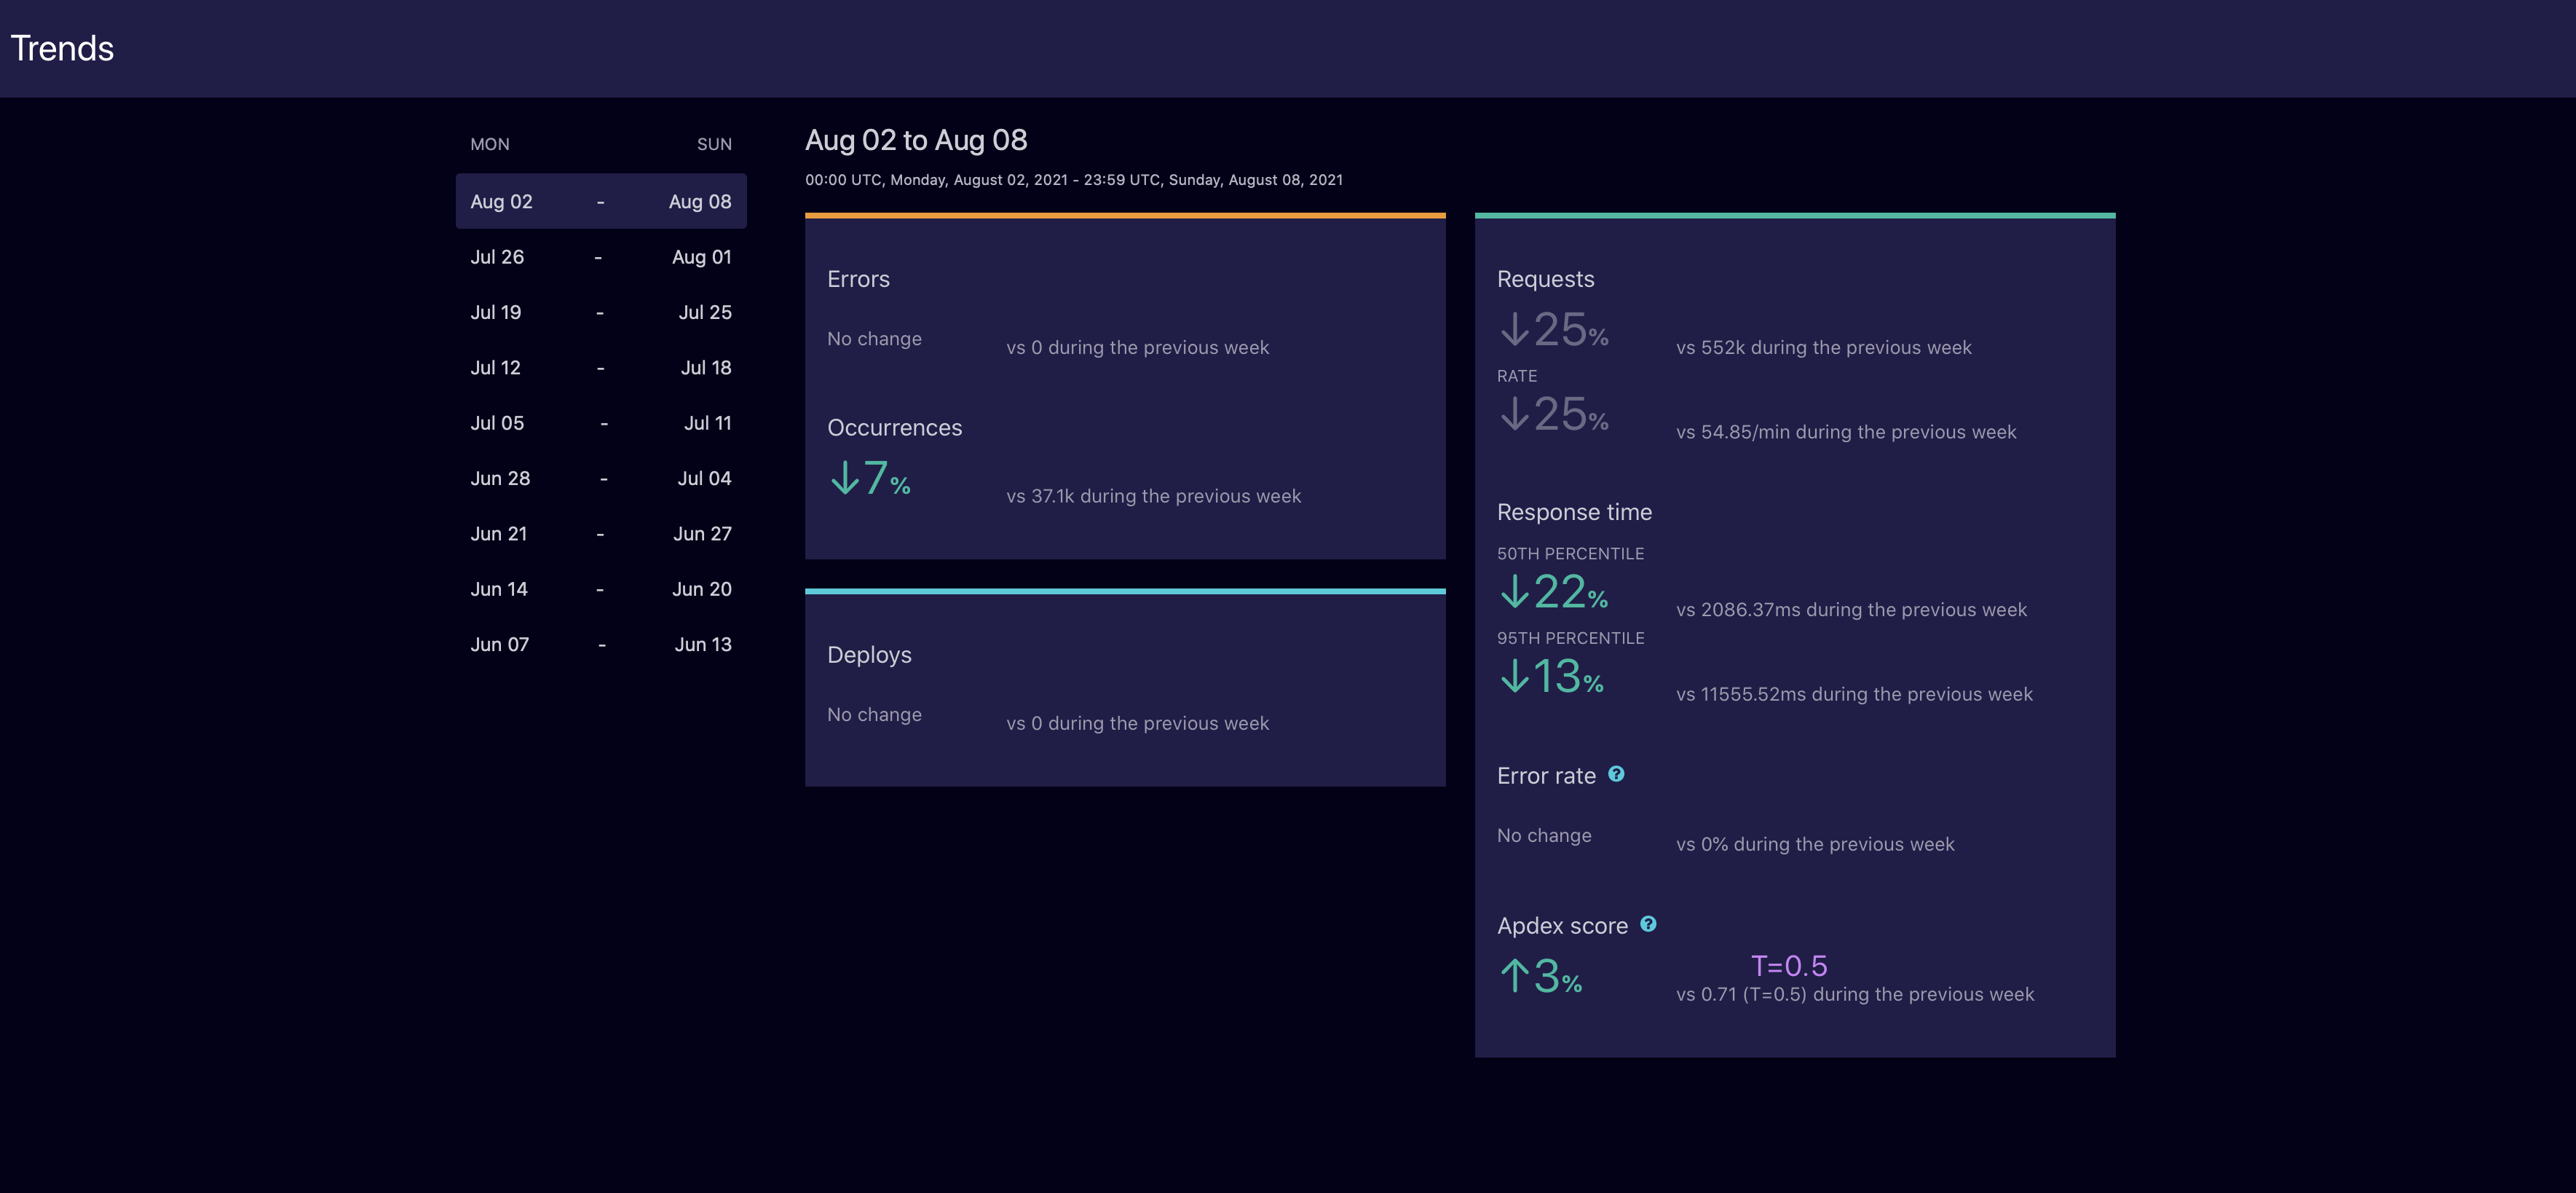  | Datadog Screenshots      |