Altair Monarch (formerly Datawatch Monarch, acquired by Altair in December, 2018) works with both relational and multi-structured data including support for a wide range of formats including PDF, XML, HTML, text, spool and ASCII files. The product can access data from invoices, sales reports, balance sheets, customer lists, inventory, logs and more. According to the vendor, the system is easy to use, allowing users to quickly select any data source and automatically convert it into…
N/A
Alteryx Platform
Score 9.1 out of 10
N/A
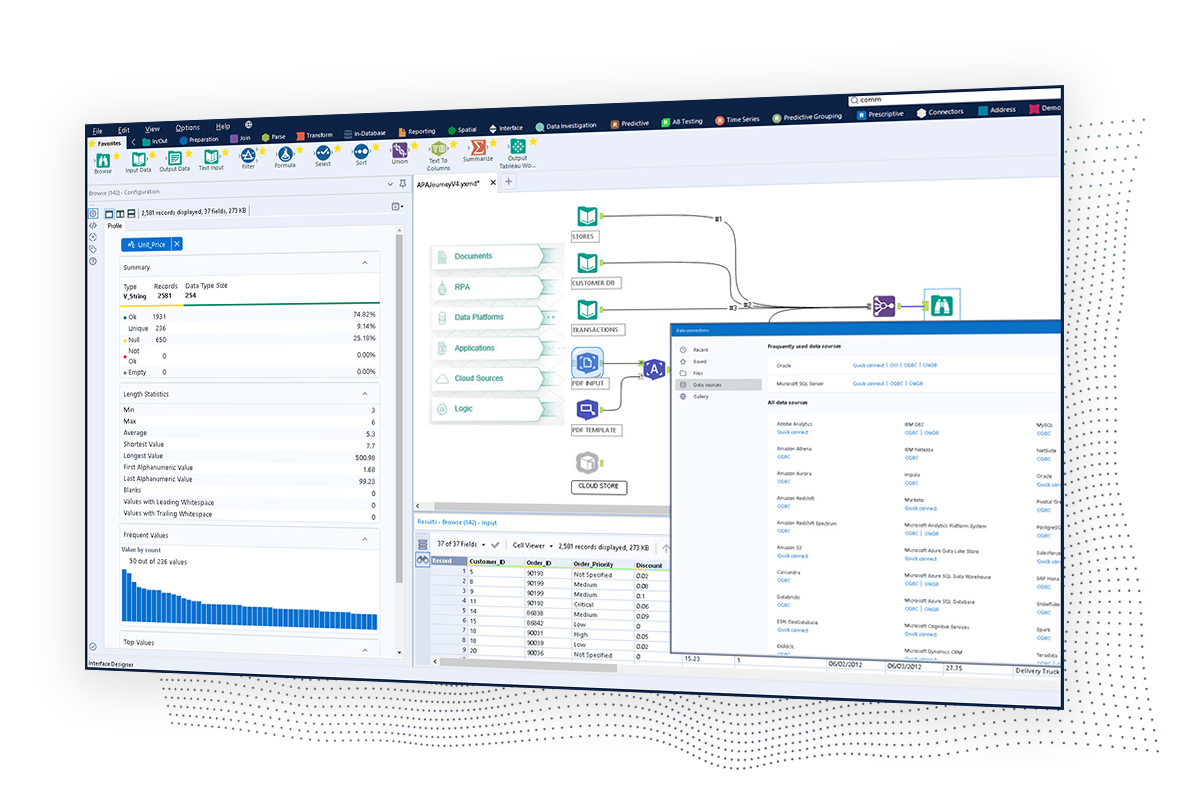
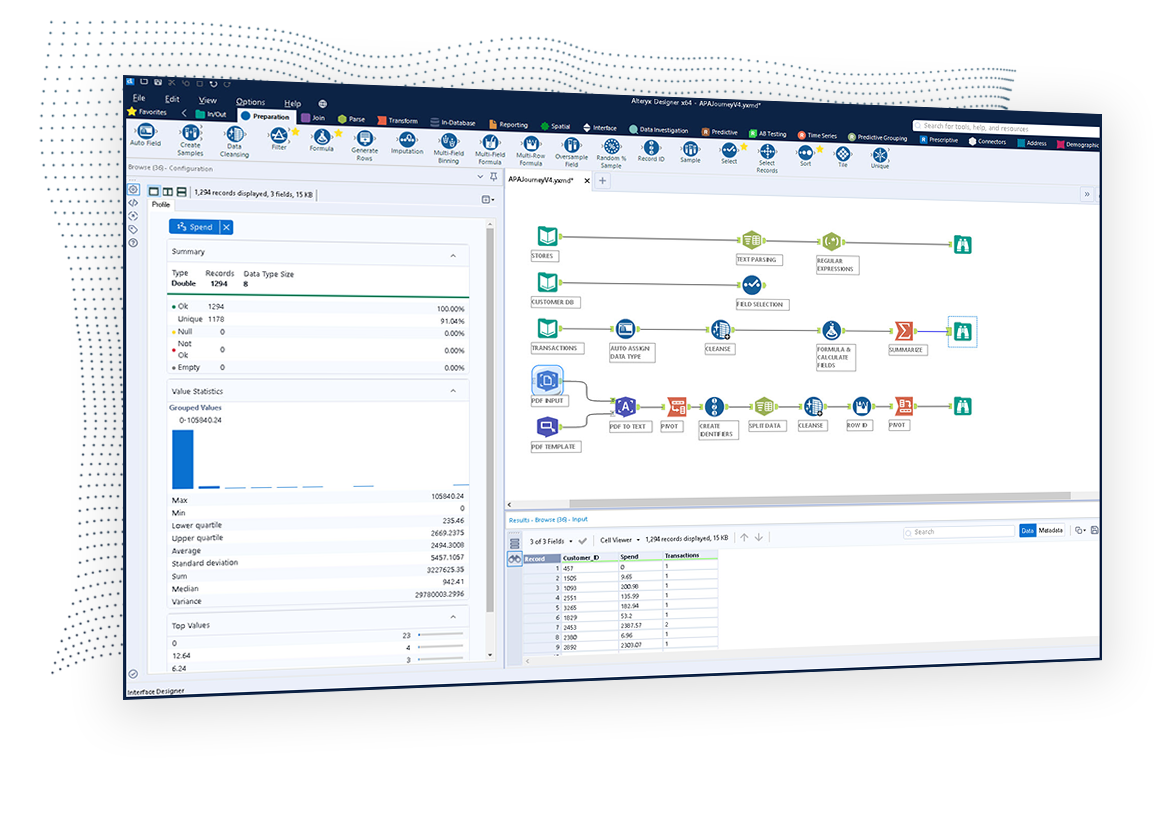
The Alteryx AI Platform gives organization automated data preparation, AI-powered analytics, and machine learning with embedded governance and security. Its self-service functionality, with self-service data prep, machine learning, and AI-generated insights, gives enterprise teams with a simplified user experience allowing everyone to create analytic solutions that improve productivity, efficiency, and the bottom line. Alteryx Designer can be used to automate every analytics step…
$14,850
per year 3 users (minimum), cloud edition
QlikView
Score 8.1 out of 10
N/A
QlikView® is Qlik®’s original BI offering designed primarily for shared business intelligence reports and data visualizations. It offers guided exploration and discovery, collaborative analytics for sharing insight, and agile development and deployment.
N/A
Pricing
Altair Monarch
Alteryx Platform
QlikView
Editions & Modules
No answers on this topic
Designer Desktop
starting at $5,195
per year per user
Designer Cloud Professional Edition
Starting at $4,950
per year per user (minimum of 3 users)
QlikView
Custom
per user
Offerings
Pricing Offerings
Altair Monarch
Alteryx Platform
QlikView
Free Trial
Yes
Yes
Yes
Free/Freemium Version
Yes
No
No
Premium Consulting/Integration Services
Yes
Yes
Yes
Entry-level Setup Fee
Optional
No setup fee
Optional
Additional Details
—
—
On an perpetual license basis, based on server plus number of users.
Contact vendor for pricing.
More Pricing Information
Community Pulse
Altair Monarch
Alteryx Platform
QlikView
Considered Multiple Products
Altair Monarch
Verified User
Executive
Chose Altair Monarch
Datawatch is very good value of money compared to QlikView; QlikView is really more of a BI tool and has a lot of functions that I didn't need. Datawatch is very strong in the real-time area where Tableau, Panorama, and Qlik don't do very well. If you need to set up a visual …
Alteryx is much easier to learn and use. The breadth of capabilities for data blending, predictive and geo-spatial analysis is way above the other products. Plus Alteryx Gallery and in-database (DB) tools are a game changer compared any of the other products.
Power BI is cheaper, but more basic. Tableau is more expensive, but with greater capabilities. I feel like the other two are a little more intuitive. My company had Qlikview when I arrived.
The product is especially useful when you have real-time and/or time series data to analyze. If you have more mundane, simpler requirements, other products might do the job you need for less money (there are even some decent open source visualization tools you can find.) I know the product is very widely used in capital markets applications to monitor and analyze risk and price and volume changes; if you're working in that area, I don't think there's a better tool to use.
I would 100% recommend Alteryx to a friend, for me its friendly interface is the best, it has all the tools I need without the headache that programming is. It can be used for simple or complex analysis, so honestly, I don’t see a scenario where it wouldn’t suit. I’ve used Alteryx to make simple things I could do in Excel, for example, but it was less complex and faster to do in Alteryx, so why not? Its a very versatile tool.
Sales data validations have helped manage our justifications in the past, especially with regard to new product development and new business introduction. It has also been helpful in identifying trends with business impact and direction specific to quarter and monthly sales from ERP data as well as decisions to purchase equipment of staffing based on run rates and product demand.
One thing that can get out of hand is data output - if you aren't careful in your query, you may be overloaded with data dumps and drown in the amount of info you have to filter through. This is a user caution, not a comment on the software itself.
Creating a basic model to extract data from a report is very easy.
Advanced features like Calculated Fields and External Lookups allow you to augment the raw data.
You can create a "project" to automate the data extraction. Combined with Datapump (a separate DW app), you can fully automate the process once the raw report is generated.
Pulling data from multiple disparate data sources.
Allows users to see the data at every step of the workflow to be able to cleanse, analyze, and optimize the data.
Provides an analytics platform that is easy for users of all levels to thrive in whether they are just starting out in their analytics journey or they have a master's degree in Data Science.
Recently, we had some major sticker-shock when we wanted to upgrade Data Pump. It is an exceptional product, but when the price jumped from $6,000 to over $60,000, it was impossible to get the funds approved internally for the upgrade.
We also paid for yearly maintenance contracts which included Professional Services, but rarely found those services beneficial. However, we did receive all software upgrades for Datapump as part of the contract which we found to be very beneficial. However, with the new pricing, that is not longer the case.
Steeper Learning Curve: Alteryx can have a steep learning curve for users who are new to the platform or have limited experience with data analytics. Enhancements to the user interface and user onboarding resources could help make the learning process more intuitive and accessible to a wider range of users.
Enhanced Data Visualization Capabilities: Alteryx offers basic data visualization capabilities, but there is room for improvement in terms of advanced visualizations and interactive dashboarding features. Adding more sophisticated chart types, interactive widgets, and customization options would enhance the data visualization capabilities within the platform.
Improved Error Handling and Debugging: Alteryx provides error handling mechanisms, but enhancing the error reporting and debugging capabilities would be beneficial. Improved error messages, better visibility into data flow, and debugging tools could help users troubleshoot and resolve issues more efficiently.
We found that QlikView can be a bit slow in supporting some forms of encryption. It is web-based and we needed to upgrade all of our server to not support the older SSL and TLS 1 protocols, only support TLS 1.2 and TLS 1.3. However, QlikView could not run with TLS 1.2 and TLS 1.3. We had to wait over six months to get a version that would handle the newer TLS versions.
There are so many options with QlikView that you can get lost when developing a visualization. There are still items I have not yet figured out, such as labeling a graph with the name of a selected detail item.
QlikView works by pulling the data it is going to use for visualization into its database. I am a security reviewer and I need to make certain that PII and PHI is not pulled by QlikView for a visualization, otherwise this could become a reportable indecent.
We've developed a working partnership with Alteryx. As an enablement suite, we're continuing to innovate and deliver great products with use of Alteryx in our solutions. Alteryx use expands to our global product development teams and is in use in multiple parts of our organization. Alteryx also delivers Experian demographic content to other clients in their product offering. We're highly likely to renew, but that decision is way above my pay grade.
Ease of use, ability to load from pretty much any data source. today I created an application that loaded time sheets from excel that are not in a table format. With Qlik's "enable transformation steps" I was able to automate loads of multiple spreadsheets and multiple tabs easily. Could not do that with any other tool.
I've found that while some things might take a little longer to create, the flexibility of Alteryx allows you to perform any function needed. I haven't found a use that was not available in Alteryx yet. APIs and XMLs can be created to perform certain functions. In addition, CMD line commands can be sent using Alteryx to perform certain functions as well.
QlikView is very easy to implement. The installation is very straight forward. QlikView has several different data connectors that can connect to different data sources very smoothly. The user interface to build the reports is very easy to understand. This helps to have a smaller learning curve. Something very helpful is that QlikView is a browser application for the end users. So, you don't need to install any applications on the user's computer.
I use many programs and compared to others, Alteryx virtually never goes down, freezes up or gives an application error. Over a 4 year time period that I have used this program, any of these may have happened 3 times. It is an incredibly stable program that I feel completely confident in.
I already gave the example of journal entries created in less than a second. What else can I tell you about.... I can tell you those 2 journal entries have historically had to be split into separate accounting systems so the outputs had to be very different (D365 vs Intacct) such that they are exactly ready for uploading. I can tell you I used to have some tire and battery queries hitting a line item detail table and they took hours to run UNTIL I asked IT for a view in SQL and now they're ready in about 5 minutes total. I guess I'd say if anything does take a long time - do some research with others and figure out what would speed them up
Stellar, bar-none. Some of the best support folks of any vendor. The Alteryx Community is the most responsive and supportive. On the rare occasion of a release issue or bug, we've been able to get quick help to solve the core problem. Alteryx does not play the blame game. They genuinely help the users solve their issues or respond to questions
My experience with the Qlik support team has been somewhat limited, but every interaction I have had with them has been very professional and I received a response quickly. Typically if there is a technical issue, our IT team will follow up. My inquiries are specific to product functionality, and Qlik has been very helpful in clarifying any questions I might have.
1st level of trainings which I've attended in Paris was easy and I was already knowing %90, that learning could have been an e-learning instead of in-person
My team attended, but I cannot myself rate, but I think it was good as they've successfully launched a training program at our company themselves for users. It was 3-4 day training.
Very good, detailed online trainings which you can take at your own pace, and strong certifications exists, certifications are extremely detailed and hard...
Training was as expected. The demo environments tend to be more fully featured that our own environment, but the training was clear and well delivered.
There is really not much to it (the installation, that is). Once you get it installed, along with any of the add-ons (demographics, R, etc.), you are up and running almost immediately. There is really no additional setup. You can immediately begin blending data, running demographics, performing spatial queries, running predictive analysis, etc. And for many of these functions, the learning curve is quite easy.
"Implementation" can mean a few things... so I'm not sure that this is the answer you want.... but here it goes: To me, implementation means: "Is the user interface intuitive and can I produce meaningful reports with ease?" On that score, I'd say YES. The amount of training required was minimal and the results were powerful. The desktop implementation is a simple, "blank" interface just waiting for your creativity. The pre-populated templates give you a reasonable start to any project -- and a good set of objects to "play around with" if you're just getting started. Finally, note that the "implementation" I used was baked into QuickBooks 2016 Enterprise -- called "Advanced Reporting"..... That integration makes it ultra useful and simple.
Datawatch is very good value of money compared to QlikView; QlikView is really more of a BI tool and has a lot of functions that I didn't need. Datawatch is very strong in the real-time area where Tableau, Panorama, and Qlik don't do very well. If you need to set up a visual monitoring dashboard, Datawatch is the best product I've seen for that. if you want to do a lot of in depth statistical analysis of large databases, Tableau is probably a good option.
Alteryx is MUCH more user friendly. both provide the ability to code within them, but Alteryx has much nicer interface. The formula tools have a more simple language that is easier to learn than formulae in SSIS. Alteryx is easy to read with multi colored tools identifying what each one does. It also allows for macros. You can build your own tool to process records of data or batch records together.
The only other vendor product that I have worked with that provides a similar experience to Qlikview is Tableau. I would recommend Tableau if your use case is to build a fixed dashboard. You can share reports for free without needing to buy additional licenses. I would recommend Qlikview if your users are looking for a more interactive experience. They can create new objects to represent the data which can't be accomplished as easily in Tableau
Individual analysts can quickly generate results using their own copy of Alteryx Designer. But using the Server and developing macros for more complex needs can be time consuming.
Error handling - allows controls to be built into workflows easily and allows them to be isolated and spat into control reports that can be easily reviewed and audited, thanks to the ability to create multiple outputs in one go.
Time-saving - saved huge amounts of time, especially when moving Excel processes into Alteryx.
Product development - allowed my firm to create products that we have been able to market and sell to clients.
You can use the free desktop version to do a lot of reporting and analysis work more quickly so the ROI is huge
QlikView is great at finding outliers such as data entry errors
QlikView is great at helping you quickly discover new insights about your business that can prompt you to take action that can immediately affect your cash flow.