Amazon CloudWatch is a native AWS monitoring tool for AWS programs. It provides data collection and resource monitoring capabilities.
$0
per canary run
Lansweeper
Score 8.6 out of 10
N/A
Lansweeper helps organizations see, understand, and make confident decisions about their technology estate across IT, OT, IoT, and Cloud. Lansweeper automatically discovers and inventories every asset: hardware, software, and user—then connects that data to insights about usage, lifecycle, and risk. This is to create what the vendor describes as Technology Asset Intelligence (TAI): a trusted foundation of knowledge that turns raw inventory data into clear, actionable…
$2,868
per year (includes 2000 assets)
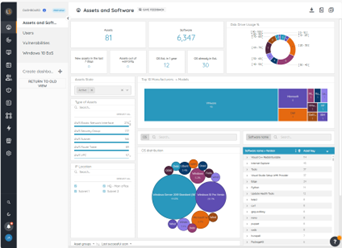
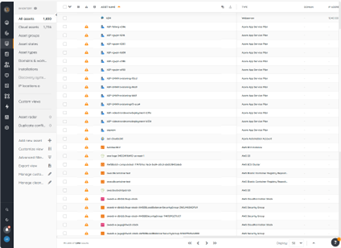
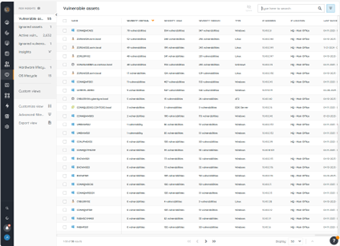
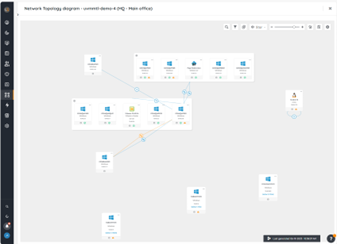
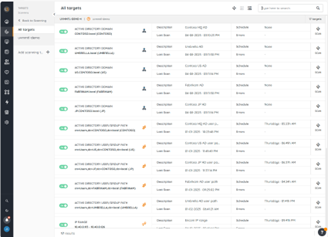
SolarWinds Hybrid Cloud Observability
Score 8.5 out of 10
N/A
SolarWinds® Hybrid Cloud Observability aims to provide a comprehensive, integrated, and full-stack solution designed to optimize performance, improve availability, and reduce remediation time by correlating data from across the IT ecosystem, including networks, servers, applications, databases, and more.
$5
per month node
Pricing
Amazon CloudWatch
Lansweeper
SolarWinds Hybrid Cloud Observability
Editions & Modules
Canaries
$0.0012
per canary run
Logs - Analyze (Logs Insights queries)
$0.005
per GB of data scanned
Over 1,000,000 Metrics
$0.02
per month
Contributor Insights - Matched Log Events
$0.02
per month per one million log events that match the rule
Logs - Store (Archival)
$0.03
per GB
Next 750,000 Metrics
$0.05
per month
Next 240,000 Metrics
$0.10
per month
Alarm - Standard Resolution (60 Sec)
$0.10
per month per alarm metric
First 10,000 Metrics
$0.30
per month
Alarm - High Resolution (10 Sec)
$0.30
per month per alarm metric
Alarm - Composite
$0.50
per month per alarm
Logs - Collect (Data Ingestion)
$0.50
per GB
Contributor Insights
$0.50
per month per rule
Events - Custom
$1.00
per million events
Events - Cross-account
$1.00
per million events
CloudWatch RUM
$1
per 100k events
Dashboard
$3.00
per month per dashboard
CloudWatch Evidently - Events
$5
per 1 million events
CloudWatch Evidently - Analysis Units
$7.50
per 1 million analysis units
Starter
$239
per month (billed annually) Includes 2,000 assets
Pro
$439
per month (billed annually) Includes 2,000 assets
Enterprise
Contact Sales
Starts at 10,000 Assets
Essentials
$5
per month per node
Advanced
$9
per month per node
Offerings
Pricing Offerings
Amazon CloudWatch
Lansweeper
SolarWinds Hybrid Cloud Observability
Free Trial
Yes
Yes
Yes
Free/Freemium Version
Yes
No
No
Premium Consulting/Integration Services
Yes
Yes
Yes
Entry-level Setup Fee
No setup fee
No setup fee
No setup fee
Additional Details
With Amazon CloudWatch, there is no up-front commitment or minimum fee; you simply pay for what you use. You will be charged at the end of the month for your usage.
—
Pricing is set per node, per month, and billing is annual. The prices listed are base prices that could increase depending on your environment. Please speak to a representative to get a quote.
More Pricing Information
Community Pulse
Amazon CloudWatch
Lansweeper
SolarWinds Hybrid Cloud Observability
Features
Amazon CloudWatch
Lansweeper
SolarWinds Hybrid Cloud Observability
IT Asset Management
Comparison of IT Asset Management features of Product A and Product B
For out business we find that AWS Cloudwatch is good at providing real-time metrics for monitoring and analysing the performance and usage of our platform by customers. It is possible to create custom metrics from log events, such people adding items to a basket, checking out or abandoning their orders.
Lansweeper I believe is well suited for any environment - its low cost and small footprint make it an easy addition to any organization, big or small, that is looking for an asset inventory solution that can either replace or supplement existing asset management systems. It may not be well suited for situations where a lot of customization is necessary, such as pulling in custom fields or details from equipment that don't reside in a registry.
- For small teams serving big organizations - it's a really simple tool to install and set up relatively quickly. - the new installer is also great - I don't have to understand what modules need to be installed; it's all streamlined. - The HCO Licensing allows you to run the Additional polling engines at a scale where the previous licensing model didn't. We can deploy APEs in locations now, which would not have been worth the investment in previously as there weren't enough devices in that location/region to spend the $$$$ on an APE License.
It provides lot many out of the box dashboard to observe the health and usage of your cloud deployments. Few examples are CPU usage, Disk read/write, Network in/out etc.
It is possible to stream CloudWatch log data to Amazon Elasticsearch to process them almost real time.
If you have setup your code pipeline and wants to see the status, CloudWatch really helps. It can trigger lambda function when certain cloudWatch event happens and lambda can store the data to S3 or Athena which Quicksight can represent.
Inventory - LANSweeper scans the network for devices - anything with an SNMP trap or using AD or local credentials. We can get an in-depth look at devices.
Reporting - LANSweeper can generate just about any report you can imagine. We can check RAM in groups and determine where upgrades are needed. We can find local printers (which aren't allowed on our network) and address that issue with the user. We can check CPU type to help determine end of life without our network.
Printers - It's nice to have a quick look at printer statuses. Toner levels, out of paper, and service errors are all reported via LANSweeper.
Memory metrics on EC2 are not available on CloudWatch. Depending on workloads if we need visibility on memory metrics we use Solarwinds Orion with the agent installed. For scalable workloads, this involves customization of images being used.
Visualization out of the box. But this can easily be addressed with other solutions such as Grafana.
By design, this is only used for AWS workloads so depending on your environment cannot be used as an all in one solution for your monitoring.
Can only scan what it sees. Doesn't show every item on the machine. Patches are also absent.
Software Recognition is OK with Microsoft. It is dire within our network of multiple products. Recognition is at about 35% with constant manual work needed to baseline for each manufacturer in each network
Datacenter compliance is a manual project. We used Excel extensively.
License optimization is limited to installations v surplus licenses. We need to know who's using what and how.
It's excellent at collecting logs. It's easy to set up. The viewing & querying part could be much better, though. The query syntax takes some time to get used to, & the examples are not helpful. Also, while being great, Log Insights requires manual picking of log streams to query across every time.
The tool is a web gui, and is mostly easy to navigate, but certain areas are more unclear than others. Identifying what im filtering for, or what menu option has what impact can be less straightforward than I'd like. Overall though, this tool will provide me with information other tools in my box just don't.
Support is effective, and we were able to get any problems that we couldn't get solved through community discussion forums solved for us by the AWS support team. For example, we were assisted in one instance where we were not sure about the best metrics to use in order to optimize an auto-scaling group on EC2. The support team was able to look at our metrics and give a useful recommendation on which metrics to use.
Lots of info online there are tons of SQL Reports you can copy from the web as Lansweeper and users post many of them. They also send out alerts that pop up on Lansweeper, letting you know of an update that you need for certain software and provide an SQL report so you can scan your system to see what PCs need this update.
Grafana is definitely a lot better and flexible in comparison with Amazon CloudWatch for visualisation, as it offers much more options and is versatile. VictoriaMetrics and Prometheus are time-series databases which can do almost everything cloudwatch can do in a better and cheaper way. Integrating Grafana with them will make it more capable Elasticsearch for log retention and querying will surpass cloudwatch log monitoring in both performance and speed
In short it has more features and its a more robust solution and it works well with those solutions. I am sure it will keep track with Ai and action recommendations in the future as I didnt see any of it on the platform (at least the one we use) I thin that is the only thing that is missing in the current product
Solarwinds has the best overlap of the two others I've mentioned - the other two tools (Datadog and Dynatrace) are great in their own way but Solarwinds is just good at everything; if I had to pick one tool of the above, it would be Solarwinds for the compatibility and ease of use, the other tools are more focused on being great at certain things while Solarwinds is the jack of all trades.
It had a positive impact on solutions expense cause several teams we're using different solutions with different costs that used several servers and DB resources. Now, we've been able to simply that a lot with Lansweeper.
With my previous point, people had to train and learn about each of their solutions. Now we can put a team in charge and so the other teams can focus on other tasks.
Last year Lansweeper changed their licencing prices a lot so it slashed our budget.