Chartbeat delivers real-time analytics, insights, and transformative tools for content teams around the world, to help improve audience engagement, inform editorial decisions, and increase loyalty.
N/A
Hotjar
Score 7.8 out of 10
N/A
Hotjar is a conversion rate optimization tool for digital marketers. Features include heatmapping, visual session recording, conversion funnel analytics, form analytics, feedback polls and surveys, and usability testing.
The tool is used by digital analysts, UX designers, web developers and product marketers. Hotjar was acquired by Contentsquare September 2021, and is now a Contentsquare brand.
$39
per month 100 daily sessions
Pricing
Chartbeat
Hotjar
Editions & Modules
No answers on this topic
Hotjar Observe - Plus
$39
per month 100 daily sessions
Hotjar Ask - Plus
$59
per month 250 monthly responses
Hotjar Ask - Business
$79
per month Starting from 500 monthly responses
Hotjar Observe - Business
$99
per month Starting from 500 daily sessions
Hotjar Scale - Business
$213
per month Starting from 500 daily sessions
Hotjar Ask - Scale
Contact Sales
per month unlimited volume
Offerings
Pricing Offerings
Chartbeat
Hotjar
Free Trial
Yes
Yes
Free/Freemium Version
No
Yes
Premium Consulting/Integration Services
No
No
Entry-level Setup Fee
No setup fee
No setup fee
Additional Details
Chartbeat pricing is based on monthly site page views. Discounts are applied to multi-year contracts. The Basic Plan includes the Real-time Dashboard, Historical Dashboard, Heads Up Display, Reports, Big Board, iOS and Android app, and Real-time API endpoints.
The Plus Plan includes all of the Basic Plan features, plus ONE of the following Premium features: Headline Testing, Advanced Queries, or Multi-Site View.
The Premium Plan includes all of the Basic Plan features, plus ALL Premium features: Headline Testing, Advanced Queries, Multi-Site View, and enterprise-level support and custom trainings.
We use Chartbeat in conjuction with these tools. Chartbeat is forward facing and we encourage everyone in the newsroom to use it. It provides the best live view, but lacks depth needed for more longer-term trend reporting and analysis. Domo allows much more advanced data …
Google Analytics 360 had problems, but after it was discontinued, Google Analytics became a shell of its former self. An added benefit of Chartbeat is that it's more "live" (looking at live concurrents rather than in the past however many minutes) and tells you how that number …
We use Chartbeat for real-time evaluation and Adobe Analytics for longer-term performance reporting. Chartbeat is easier to use overall, particularly for content producers. Researchers tend to rely on Adobe Analytics for their reports. We have found that we need to keep using …
Google Analytics has gradually become much more difficult to use, and much slower in its realtime reporting. It was the changes that came in with Google Analytics 4 that gave us the final push to work with Chartbeat - a product some of us were already familiar with from …
Omnilytics is more robust, detailed, and catered for an intermediate media user, while I think Chartbeat is a more user-friendly and beginner-oriented piece of technology. That being said, there is an impressive amount of lift for Chartbeat, and it's evident that simplicity is …
I used Parse.ly before I used Chartbeat. We shifted away from Parse.ly because it's social standing wasn't as good, it was mostly for site readership and we needed a bigger concentration on social media that Parse.ly couldn't provide. It's not listed, but we now use Social Flow …
Chartbeat stands out in terms of real-time tracking and information from which to manage homepages, I found this better than Smart Octo's equivalent. However, the ability to quickly explore past data does not go as deep as Google Analytics.
Chartbeat is better than GA when it comes to ease of use and immediacy. The homepage layover that Chartbeat offers is unique from what I've seen and gives me an instant knowledge of what's working on my site and how to best arrange it.
Other products like Chartbeat that I've used are Parse.ly, GA, and Omniture. Parse.ly is the only tool, in my opinion, that offers more real-time data, but the interface is lacking and isn't as intuitive as Chartbeat.
Chartbeat is certainly better at visualizing content and segmenting the data all on one screen. We can filter by section, author, channel and more without leaving the main dashboard page. Combining properties together in roll up groups is another key feature. We're able to …
Compared to Sprig and Usabilla, Hotjar has robust functionality. Again, as stated earlier, the ability to summarize rage clicks, trigger recordings for a/b experiments, and run intercept surveys on mobile is very useful. Hotjar is also noticeably more intuitive to use than …
The fact that it has a trial period in which you can fully try each feature of the platform. The fact that is very intuitive for us to understand each feedback given by the users and to interpret how they move and what they observe on the pages we need to test.
For us, Hotjar was really simple to implement and the user interface is really easy to use and get accustomed to. Some of the other products we evaluated didn't have as rich features and were way overpriced which made us choose Hotjar. Also, Hotjar allows you to capture …
There was not something specific negative that we noticed in the other products, hotjar came in the discussion through a referral from one of our colleagues, was covering all the tickboxes that we had set and decided to move forwards with it
Whatever software does, Hotjar does better. Integration and setup are really fast and you can have data to analyze in a few minutes. Also, the support team is very dedicated and there's a lot of documentation and examples you can follow.
I have not used any other services and only used Hotjar so I cannot say how this service compares to others in their vertical. I have used Survey Monkey and I have found that their survey templates do not match that of Hotjar's. I also think that the reporting/tracking is more …
Hotjar was significantly cheaper for us, and they’ve been brilliant at honouring their legacy pricing model which is much cheaper up until recently. We find that Hotjar also offers a wider range of tools that we would otherwise need to pay more for elsewhere like surveys. The …
Cmparing with other products in the same vertical, we found the UX UI for Hotjar the best. It is easier to integrate with and has lot many more features as compared to its nearest competitors. We fount the product to be robust and accurate with lot of customizable options to …
I liked the Hotjar User interface a little more and it seemed a little bit easier to set up. For some users with just the basic needs smart look was overly complicated. whereas in Hotjar everything you need is in one simple easy-to-view dashboard. Also, it offered more free …
I test drove Lucky Orange and decided to keep Hotjar as the UI is easier to use. The competitor had no compelling features vs the ones offered by Hotjar. I also found the standard sound effects in Lucky Orange very overbearing and obnoxious.
Hotjar was relatively more known to the team and they had past experience as well with the tool which made the adoption relatively easier. As such we didn’t find a lot of difference between the two tools when it comes fulfilling our use cases so for us specifically both were …
We used different tools but Hotjar combines several functionalities in one tool. So we used and are still using SurveyMonkey for bigger Surveys but it's handy to also have a tool where we can create short single questions surveys. We selected Hotjar because it is a good …
Hotjar is the full deal and provides fantastic functionality and options for me to track my users on my website. The other software is good but I personally feel Hotjar is the best for purposes. I know it’s a little pricey, but if you use it right, it will ultimately help you …
Google Analytics is a much more robust platform than Hotjar, but works great as a complement to Google Analytics - in other words, it was a matter of choosing both, not either/or. While there are workarounds for them on Google Analytics, heatmaps and screen recordings are much …
Hotjar is better at taking screenshots from landing pages which help us better visualize clicks, scroll and mouse movements. With Hotjar, we can better see what users are doing on our landing pages. This way you'll have a much more accurate picture of how people arrive at …
The thing is I never used another tool like Hotjar before All my website analysis I made with Google Products before (Analytics, Tag Manager, Data Studio, etc..) But Hotjar really helps a lot to understand what my website means to my potential customers and even more, It allows …
I've really liked Hotjar for our web app and haven't had a need to look for other products. We've used Hotjar for three years and it gets us the answers we need for our web app UI changes or releases. I've really enjoyed using it.
I just find Hotjar to be simpler, cleaner, easier, and more flexible. Lucky Orange was a tool that another client of my had installed and, while it 'worked' and did similar things, I found that Hotjar was simpler. I don't know if there are cost differences between the two …
It is well suited to keeping me toward a specified goal, and gives me concrete numbers and gives me an idea of what we need to do to meet our goals. It's less appropriate if you want something more than pageviews, and doesn't really do a lot for video views.
Hotjar is well suite for organizations that want to get a good glimpse into user behavior on their websites. The tool is easily installed through Google Tag Manager, and then users simply select which pages or paths they want the tool to analyze. After a few days, users can start seeing patterns develop, helping them understand what areas of the user journey flow they need to test out and improve. Hotjar is primarily for web-based experiences, not for mobile applications and other non-web digital applications.
Heat mapping is great on Hotjar. It is a good place to start when you are looking at the UX & CRO on your website. You can see the % of people clicking on elements on a page, how far they scroll, and mouse movements.
Hotjar is great for session recordings. These record the mouse movements, clicks, pages and scrolls of a user in video format. You can watch these to investigate what works well on a site and identify potential roadblocks and bugs.
Hotjar is great as it ensures that users details are anonymous; for instance, if you are watching a session recording, you cannot see what a user types in a form field, as Hotjar blanks this out.
Hotjar has a poll function, so you can have polls on your website.
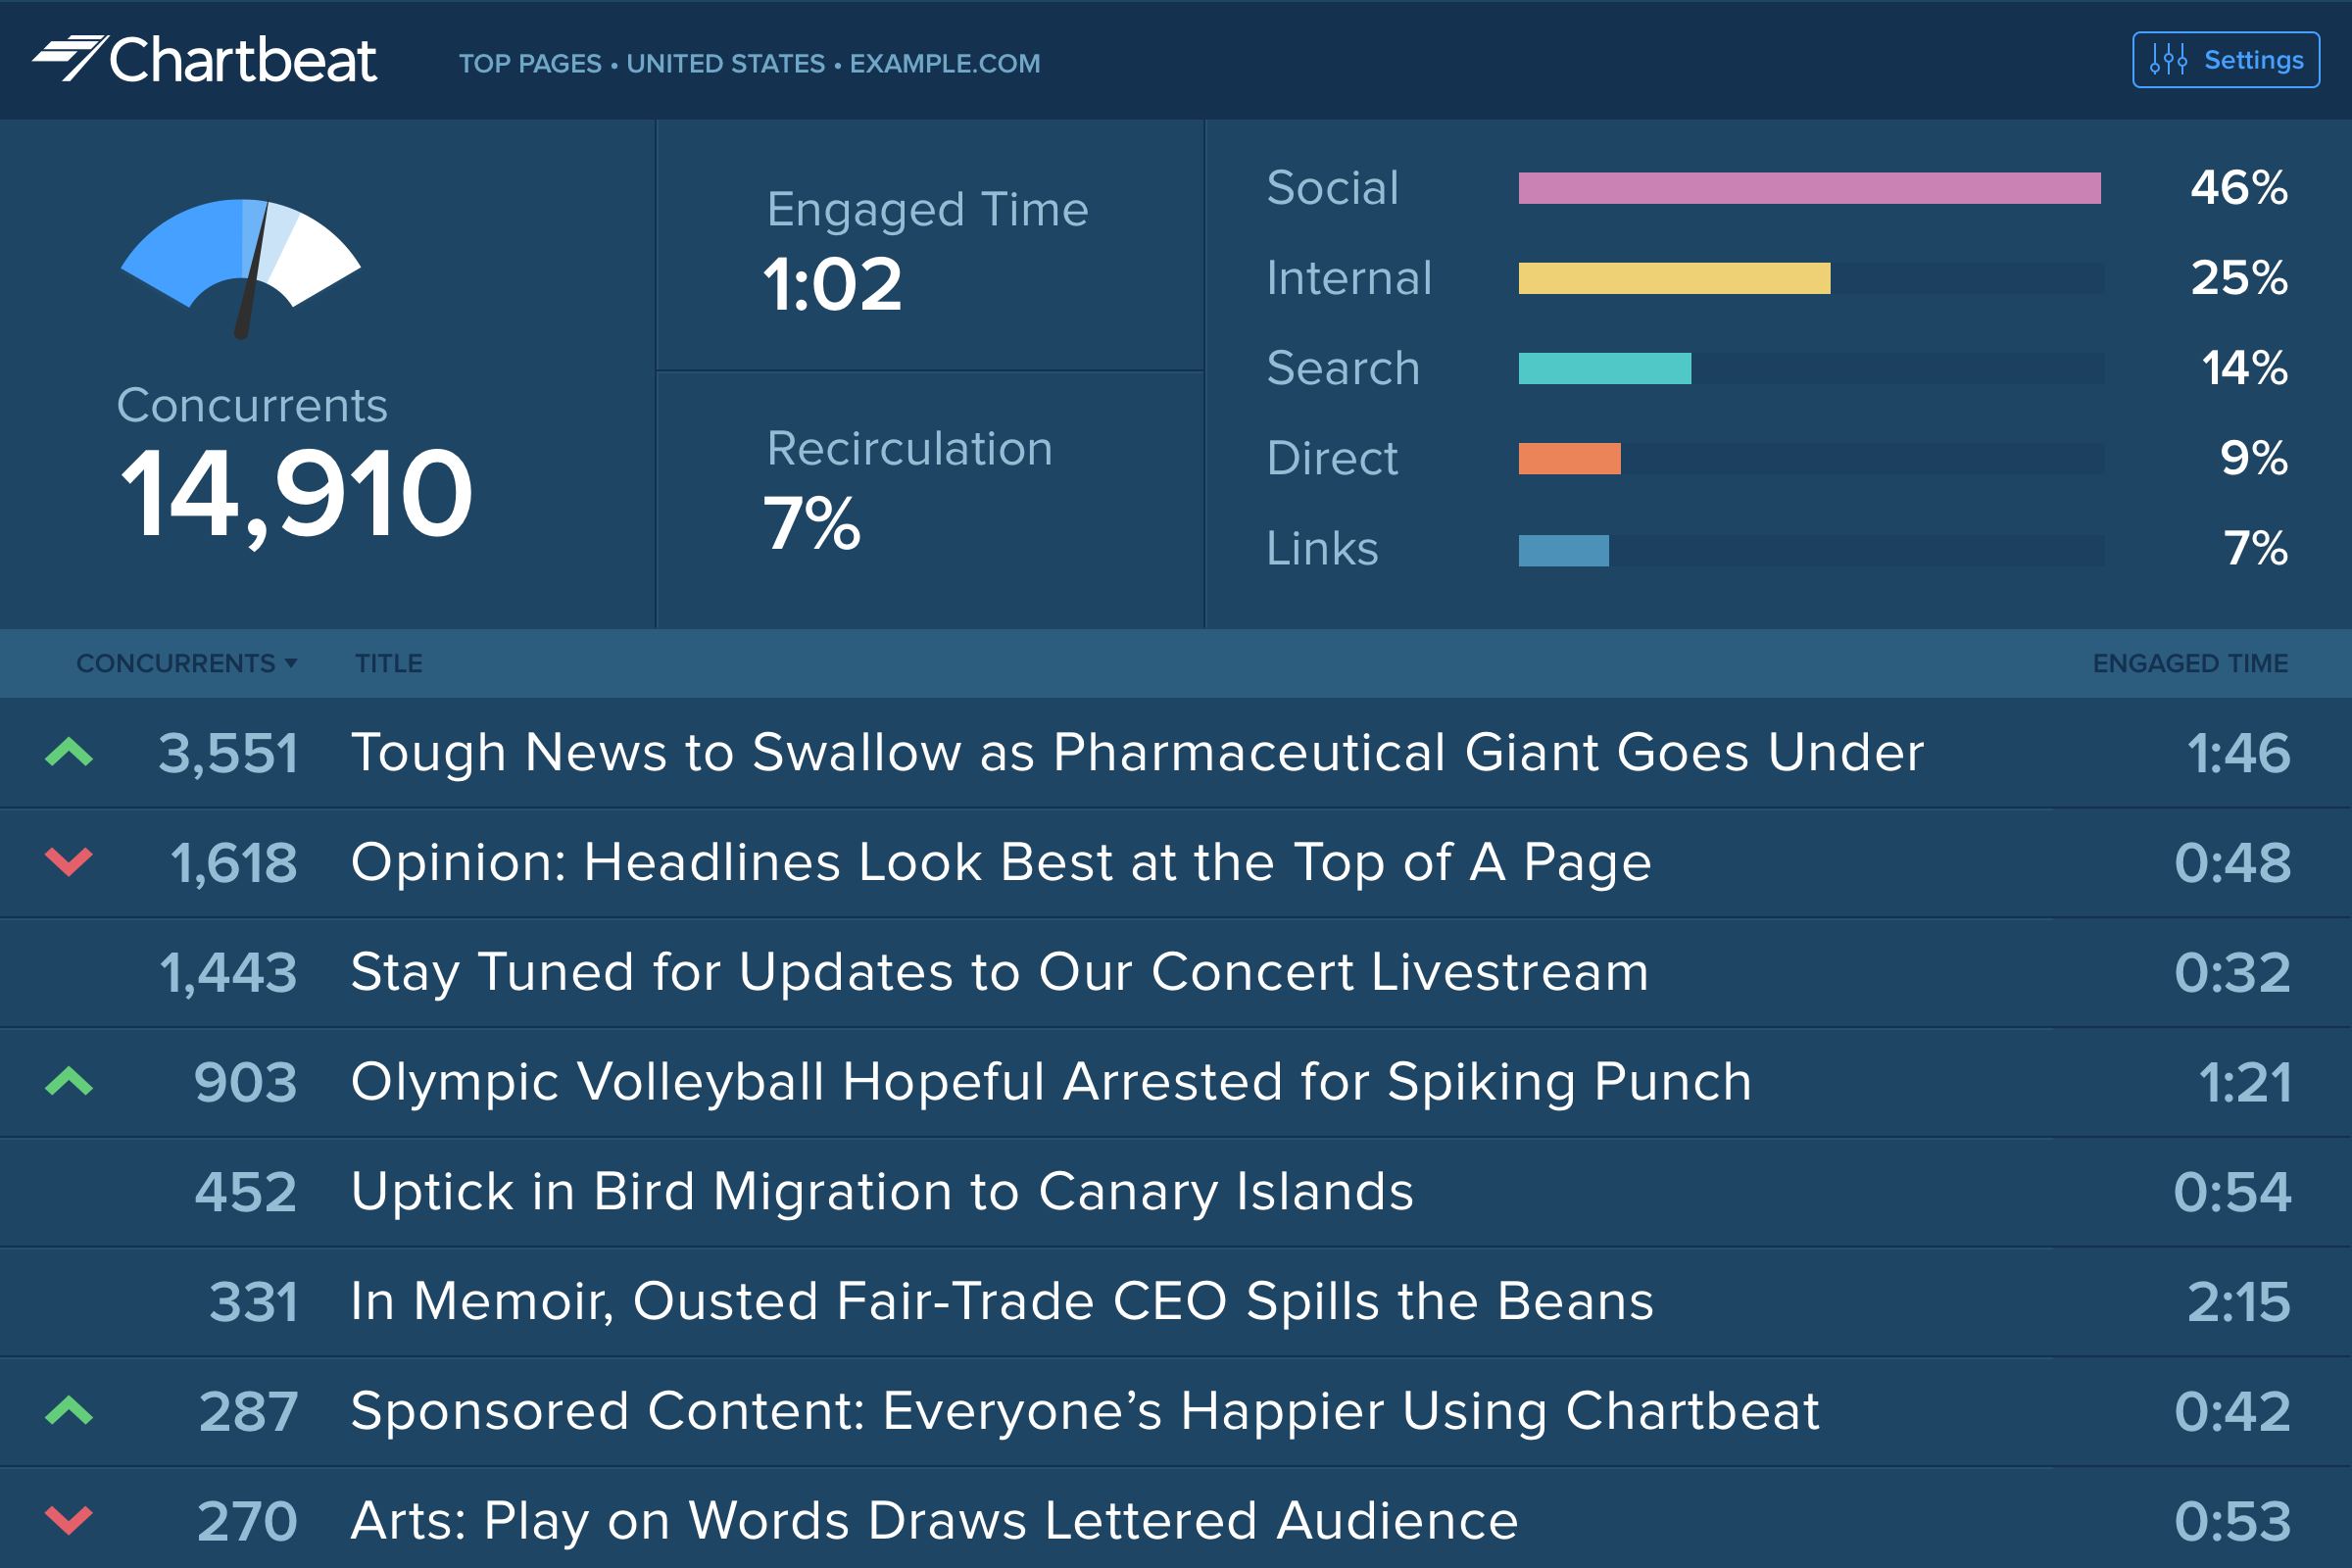
Source of traffic needs improvement. Search and social make sense, but "internal" and "links" is a grey area. It would be helpful to define those with an organization and provide an information icon so users can easily remember what each of those buckets is tracking.
More ways to customize the real-time board. For example, with video content, that's great that I can see a user has started a video, but what is the completion rate, was that only on O&O or can that track Facebook, too?
Would like to see demo (age) information included as a way to slice the data so I can see what's working with my older and younger demo.
The video recording feature is very slow to use. I know there is a very powerful process going on (saving your CSS and the DOM movements you make) but anyway it's slow to use.
Hotjar itself is heavy and has effects on your load times. This is a very important issue and I hope they're working on that.
Adding more segmentation would be nice. For example, being able to connect your API or more information to show relevant polls or feedback buttons to certain users. Aggregated info is hard to process.
I gave Chartbeat a 5 for a renewal rating, because, while it delivers clear and understandable content, Google Analytics also provides many of the same features for free. For a small to medium website, I believe it would be more cost effective to use Google Analytics. A website with a high amount of traffic, however, could merit spending the money on Chartbeat to maximize their potential.
Even though the heat maps and user recordings were useful, our website was significantly slowed down after we installed Hotjar, so much so, that it took over a minute for our blog to load. The data that we gathered was not worth the length that it took our website to load.
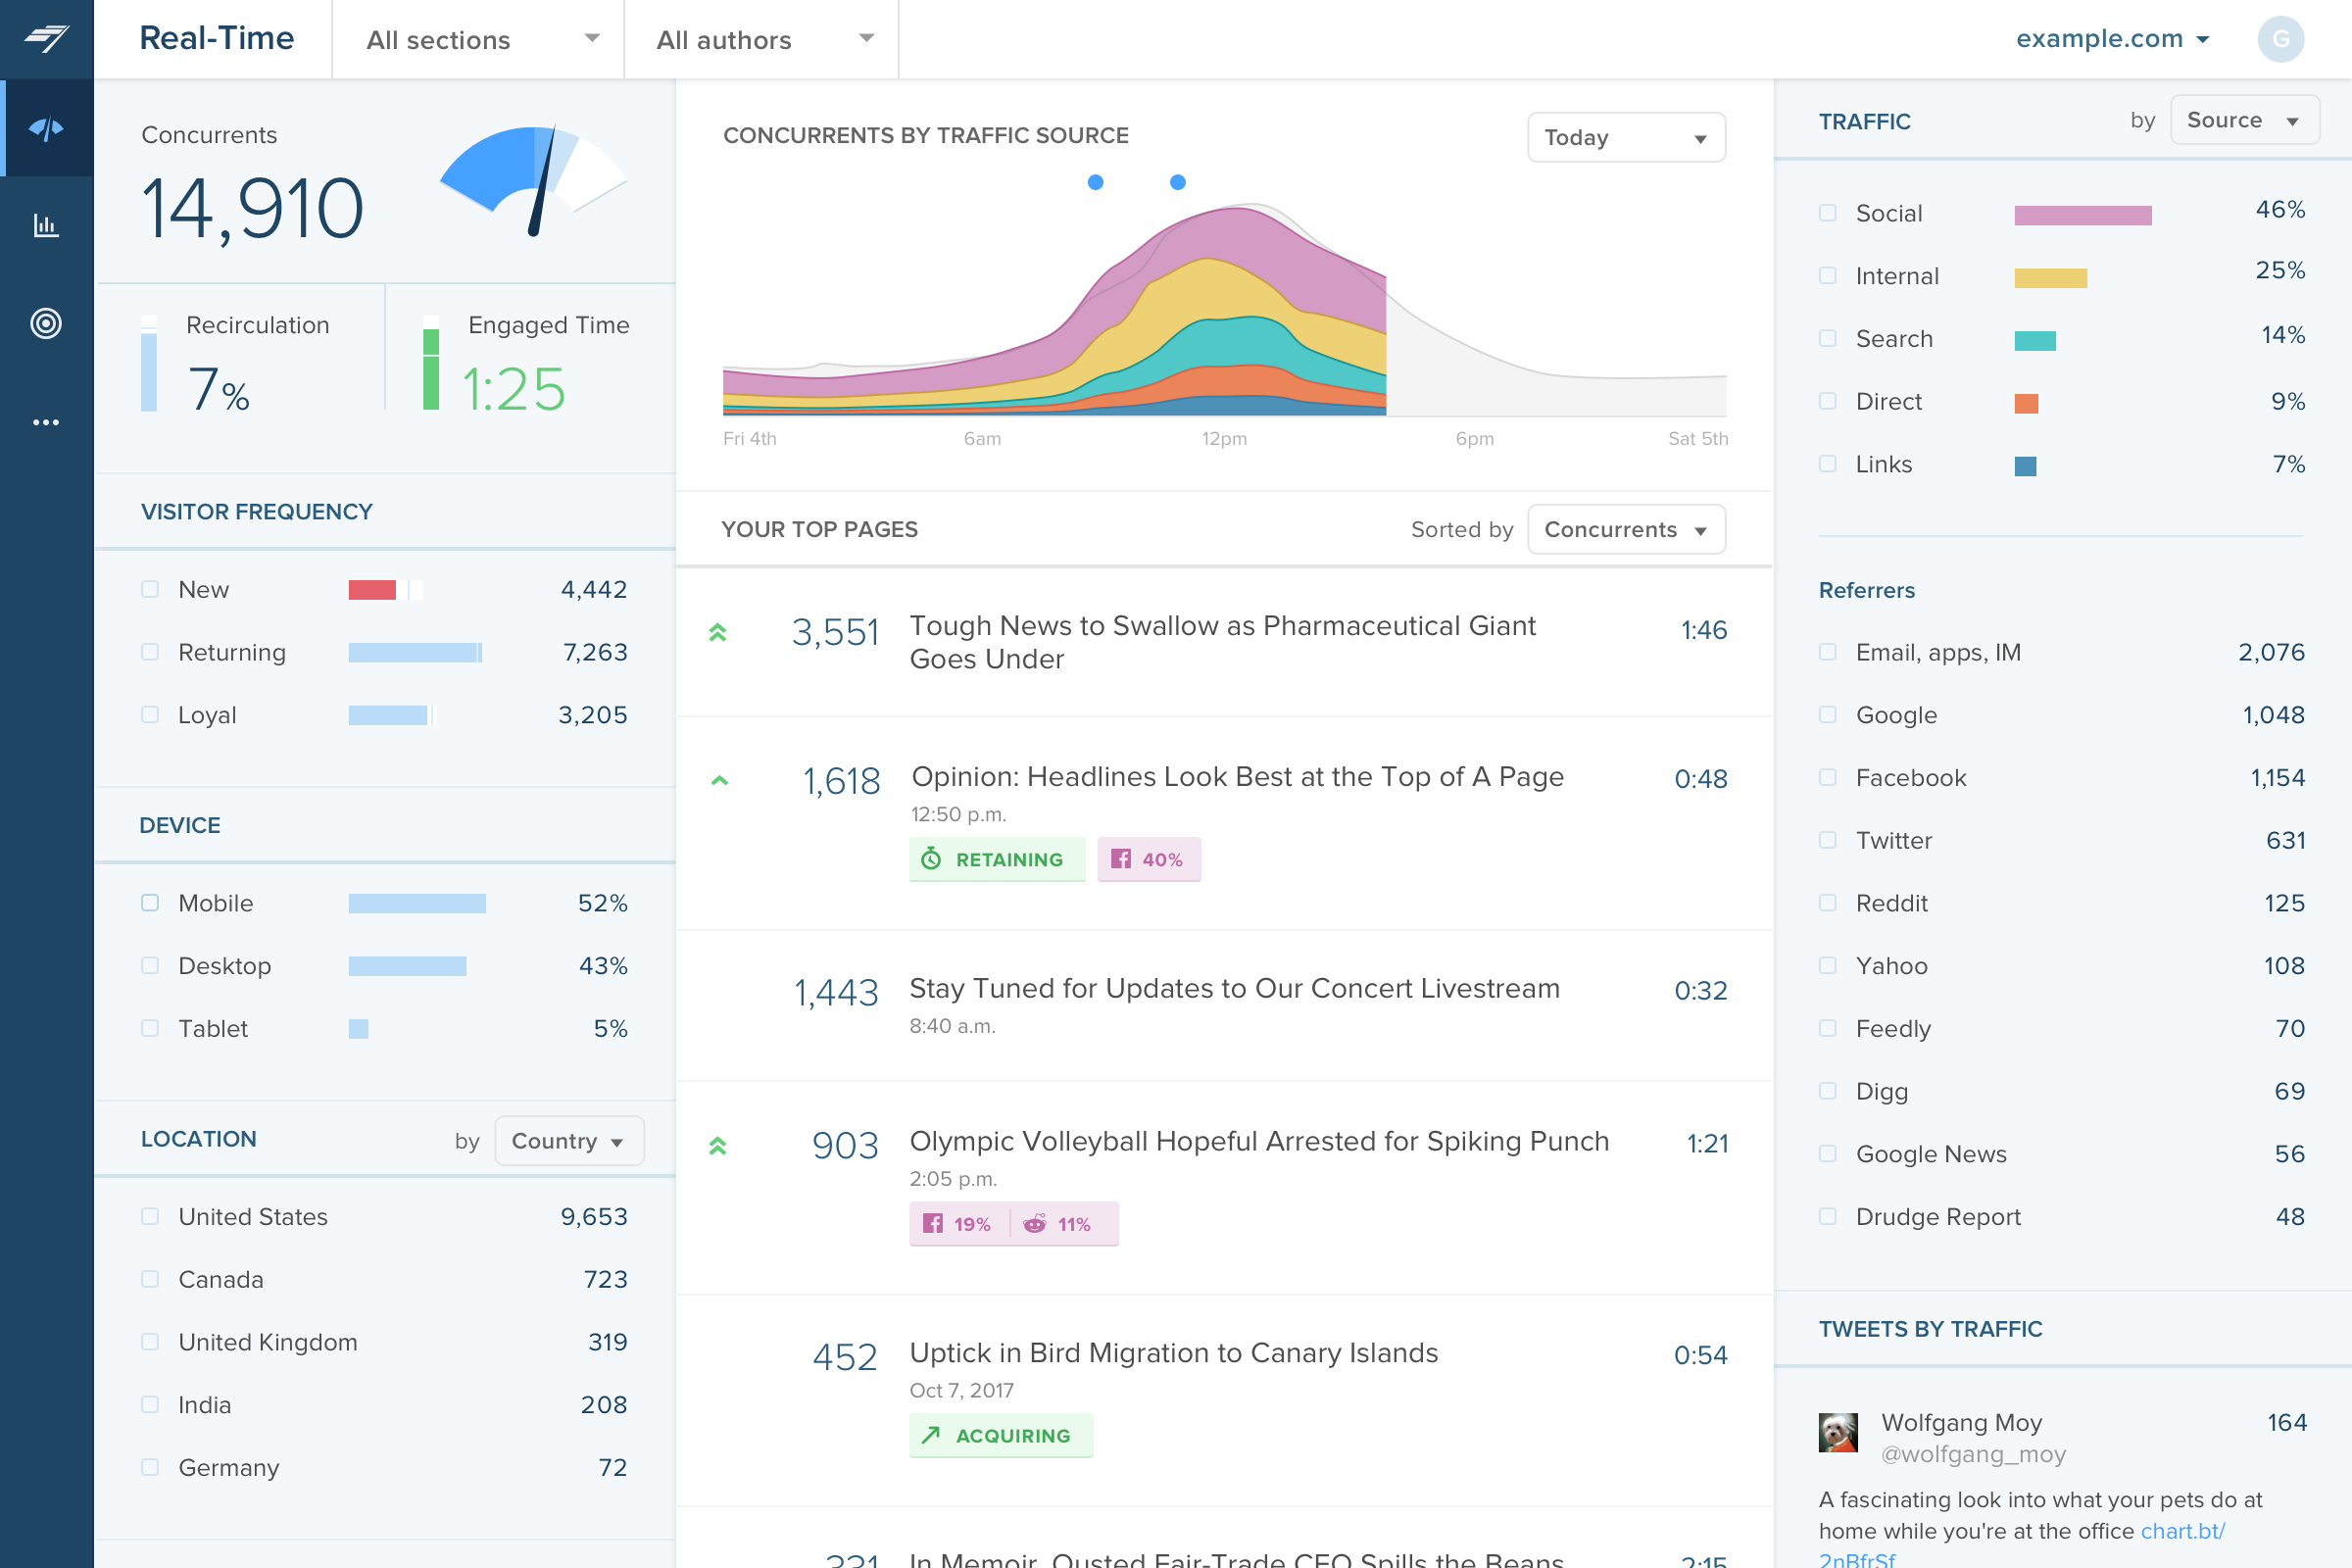
Chartbeat is really pretty straightforward. The only things that may cause confusion are the string of sidebar features and tools at the left of the screen. I mostly use the big leader board in real-time and the historical feature (looking at the monthly or weekly performance of my team's content) and then generate reports automatically from there.
So easy and simple to use! Straightforward anyone in the team is able to easily go in and set up anything in Hotjar. The UI is really simple. Whenever you give feedback to Hotjar they continously take on board the feedback and improve the tool.
I have had limited experience of support for Chartbeat but whenever I have needed help it has been there. Recently there was an issue of seeing different forms of data in real time - app and otherwise effectively, and the issue was being clearly dealt with and communicated back to us.
Hotjar is a SaaS-based company, and as such has a good support service. Users can quickly submit support tickets through Hotjar's online portal. Enterprise customers get access to additional support members and have SLAs to support their larger, more complex needs. Overall, Hotjar is extremely reliable and I've never had to reach out to customer support.
Google Analytics has gradually become much more difficult to use, and much slower in its realtime reporting. It was the changes that came in with Google Analytics 4 that gave us the final push to work with Chartbeat - a product some of us were already familiar with from previous jobs. Things are just much harder to find in GA, and when time is always tight you can't afford to spend a long time looking for particular data - it should be quick and easy to locate
Compared to Sprig and Usabilla, Hotjar has robust functionality. Again, as stated earlier, the ability to summarize rage clicks, trigger recordings for a/b experiments, and run intercept surveys on mobile is very useful. Hotjar is also noticeably more intuitive to use than Usabilla, with a cleaner interface and navigation.
Our UX team can now use hard data to back up and validate design decisions that we make. Our role as usability experts is becoming more respected and integral to business objectives because we now have data that can back up our field of study and prove that our roles are demonstrably useful and necessary.
HotJar allows our small team of 3 UX designers to get research data as if we were a much larger team. Instead of painstakingly using our time to do guerrilla research, endless user observations, and other types of manual testing, we can now get a significant portion of our data from HotJar.
Using HotJar is actually giving our team a sense of excitement and enjoyment in our day-to-day usability work. Instead of seeing UX as a chore, HotJar is making data gathering and analyzing more fun, because we can see tangible results from a much larger pool of user/user-data than we could in the past.