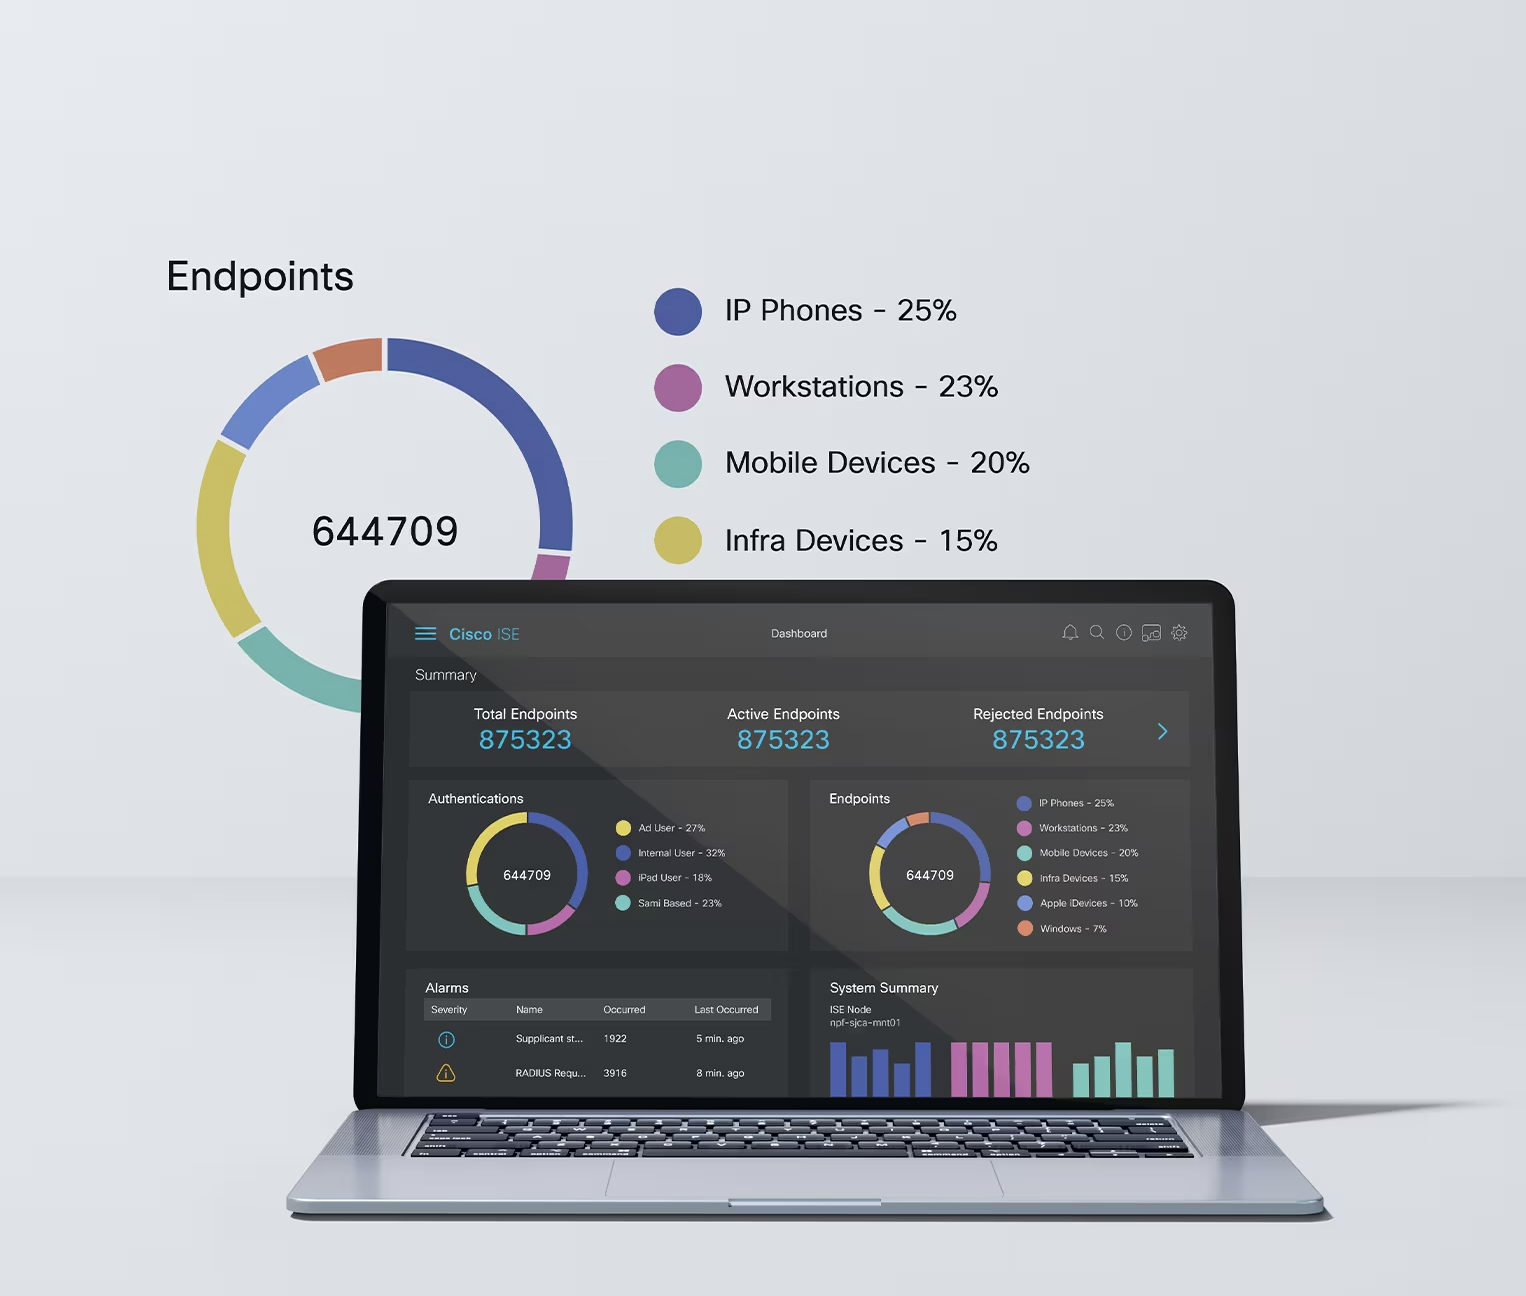
The Cisco Identity Services Engine (ISE) offers a network-based approach for adaptable, trusted access everywhere, based on context. It gives the user intelligent, integrated protection through intent-based policy and compliance solutions.
N/A
Datadog
Score 8.6 out of 10
N/A
Datadog is a monitoring service for IT, Dev and Ops teams who write and run applications at scale, and want to turn the massive amounts of data produced by their apps, tools and services into actionable insight.
$18
per month per host
SolarWinds Engineer's Toolset
Score 7.9 out of 10
N/A
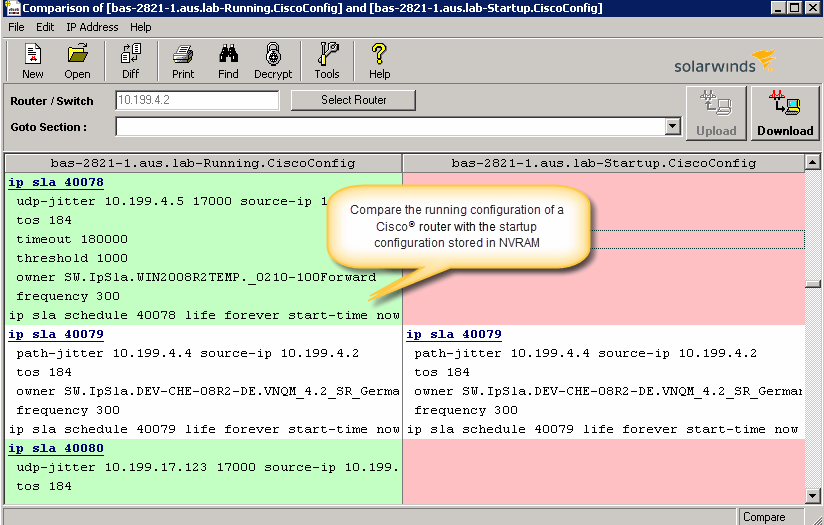
SolarWinds® Engineer’s Toolset (ETS) helps users monitor and troubleshoot a network with over 60 tools for network management. ETS allows users to monitor and receive alerts in real time on network availability and health, and perform network diagnostics for faster troubleshooting and resolution of complex
network issues. With ETS users can deploy an array of network discovery tools including Port Scanner, Switch Port Mapper or advanced Subnet Calculator, manage Cisco®
devices with specialized…
$1,585
Per Instance
Pricing
Cisco Identity Services Engine (ISE)
Datadog
SolarWinds Engineer's Toolset
Editions & Modules
No answers on this topic
Log Management
$1.27
per month (billed annually) per host
Infrastructure
$15.00
per month (billed annually) per host
Standard
$18
per month per host
Enterprise
$27
per month per host
DevSecOps Pro
$27
per month per host
APM
$31.00
per month (billed annually) per host
DevSecOps Enterprise
$41
per month per host
One Time Price
$1,585
Per Instance
Offerings
Pricing Offerings
Cisco Identity Services Engine (ISE)
Datadog
SolarWinds Engineer's Toolset
Free Trial
No
Yes
Yes
Free/Freemium Version
No
Yes
No
Premium Consulting/Integration Services
No
No
No
Entry-level Setup Fee
No setup fee
Optional
No setup fee
Additional Details
—
Discount available for annual pricing. Multi-Year/Volume discounts available (500+ hosts/mo).
Cisco ISE integrates will with a Cisco solution such as firewalls, network switches and routers. It does an incredible job of granting access based on the role that an individual or groups have, and the ability to remove access to that individual or group is also east. In our environment ISE is used to authenticate external users that have access by vpn, and also to manage access to the large network infrastructure
Datadog may be better suited for teams that have a more out-of-the-box infrastructure, on the primary platforms Datadog supports. You may also have better results if you have a bigger team dedicated to devops and/or a bigger budget. We found that trying to adapt it to our use case (small team, .NET on AWS Fargate) wasn't feasible. We continually ran into roadblocks that required us to dig through documentation (and at times, having to figure out some documentation was wrong), go back and forth with support, and in my opinion, waste money on excessive and unintended usages due to opaque pricing models and inaccurate usage reports, as well as broken/non-functional rate sampling controls.
I have found the toolset especially useful for scanning subnets to discover devices, and for setting up temporary real-time monitors when we are troubleshooting or setting up new connections. The most useful aspect has been the ability to apply the tools to help troubleshoot and pinpoint intermittent issues. More general tools like Orion often do not have the granularity to detect issues like intermittent packet loss which are especially impactful to applications like Voice. The toolset gives us another level of capability to dig into issues.
The most beneficial thing that I love about it, there are tons of things that I love about ISE and that it does well, but the most fascinating that I feel about is its integration with DNA center or Catalyst Center using PX Grid as the protocol wherein ISE acts as a policy server for the entire campus hand in hand with Catalyst Center to make sure that the policy policy follows the user and also in the background hand in hand with DNA Center or Catalyst Center makes sure microsegmentation is implemented so that east west traffic is blocked and takes care of the campus.
The thing which Datadog does really well, one of them are its broad range of services integrations and features which makes it one step observability solution for all. We can monitor all types of our application, infrastructure, hosts, databases etc with Datadog.
Its custom dashboard feature which helps us to visualize the data in a better way . It supports different types of charts through those charts we can create our dashboard more attractive.
Its AI powered alerting capability though that we can easily identify the root cause and also it has a low noise alerting capability which means it correlated the similar type of issues.
Alert windows cause lag in notifications (e.g. if the alert window is X errors in 1 hour, we won't get alerted until the end of the 1 hour range)
I would appreciate more supportive examples for how to filter and view metrics in the explorer
I would like a more clear interface for metrics that are missing in a time frame, rather than only showing tags/etc. for metrics that were collected within the currently viewed time frame
The unifying component that is intended to be the initial interface to the tools seems clunky. I prefer to start the tools individually rather than using it.
The port scanner could use some improvements to make it easier to use.
For us the solution is very easily useable on its own. Perhaps that has to do because we started using ISE in the 1.2 days and have seen it grow during the years. Policy creation, etc. is all very visible and thus easy to use. Deployment of multiple nodes is also incredibly easy and flexible. You can easily add or remove nodes as you wish.
There are so many features that it can be hard to figure out where you need to go for your own use case. For example, RUM monitoring us buried in a "Digital Experience" sidebar setting when this is one of our key use cases that I sometimes struggle to find in the application. It appears that ECS + Fargate monitoring was recently released which is great because we had to build a lambda reporting solution for ephemeral task monitoring. But this new feature was never on my radar until I starting clicking around the application.
We do have to occasionally reboot the servers when they get low on memory, but we're also a few versions behind. Availability has generally been pretty good though with no major outages in the time that we've had it implemented.
Cisco support is second to none, both in terms of how you access support but also the knowledge of the individual support teams. If you focus on one technology and provide "manufacturer support" then you can rest assured that you are accessing Cisco's top individuals. I feel like this is a USP for Cisco support.
The support team usually gets it right. We did have a rather complicate issue setting up monitoring on a domain controller. However, they are usually responsive and helpful over chat. The downside would be I don’t think they have any phone support. If that is important to you this might not be a good fit.
I think our system integrators lacks some competencies and this has led to an implementation that is still perfectible. (i.e. dedicating an interface for intra-cluster communication)
I think all give some visibility of device monitoring and management, but Cisco Identity Services Engine gives a good way to manage more details about the device in a centralized way that gives a wider range of monitoring and control than the other softwares individually. I don't think Cisco Identity Services Engine eliminates the need for these other software as of now, but there is potential for Cisco Identity Services Engine to be able to take over more of these roles.
Our logs are very important, and Datadog manages them exceptionally well. We frequently use Datadog services for our investigations. Use case: Monitor your apps, infrastructure, APIs, and user experience.
Key features:
Logs, metrics, and APM (Application Performance Monitoring)
Real-time alerting and dashboards
Supports Kubernetes, AWS, GCP, and other integrations
RUM (Real User Monitoring) and Synthetics
✅ Best for backend, server, and distributed systems monitoring.
I haven't compared any tools similar to SolarWinds Engineer's Toolset. This might be because I'm pretty biased when it comes to monitoring, and reporting solutions. I've found that SolarWinds provides the biggest bang for the buck in my opinion. I'm sure there are other solutions on the market that compete, but I haven't tried any of them because I've been very satisfied with SolarWinds.
It's fully customised and comprehensive. only thing is you need to know what you want. Proper research and planning would save lots of time and effort .
I don't know about negatives because we haven't seen it right now, but positive impact is one is the roadmap we have. And now since we are going ahead with doing the deployment of Cisco ISE, we see that we are getting closure to, so at the end of the day, we have to make sure that operationally we stay excellent. So that's where operational excellence comes in. Cisco ISE is basically addressing that for us. Right now we are in a situation if there is a WIFI issue or if there is an authentication issue, it gets really difficult to isolate the problem. But with Cisco ISE , this functionality is going to come in. So we believe that it would be a good ROI.