Overview
ProductRatingMost Used ByProduct SummaryStarting Price
Clear Analytics
Score 8.8 out of 10
Enterprise companies (1,001+ employees)
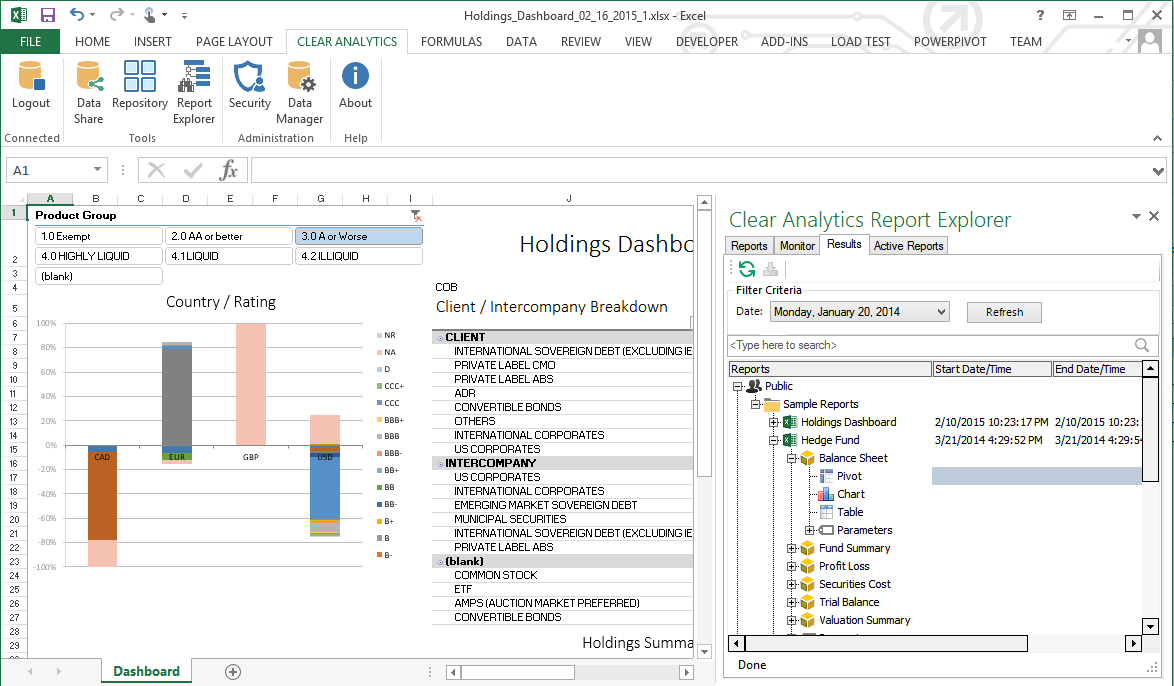
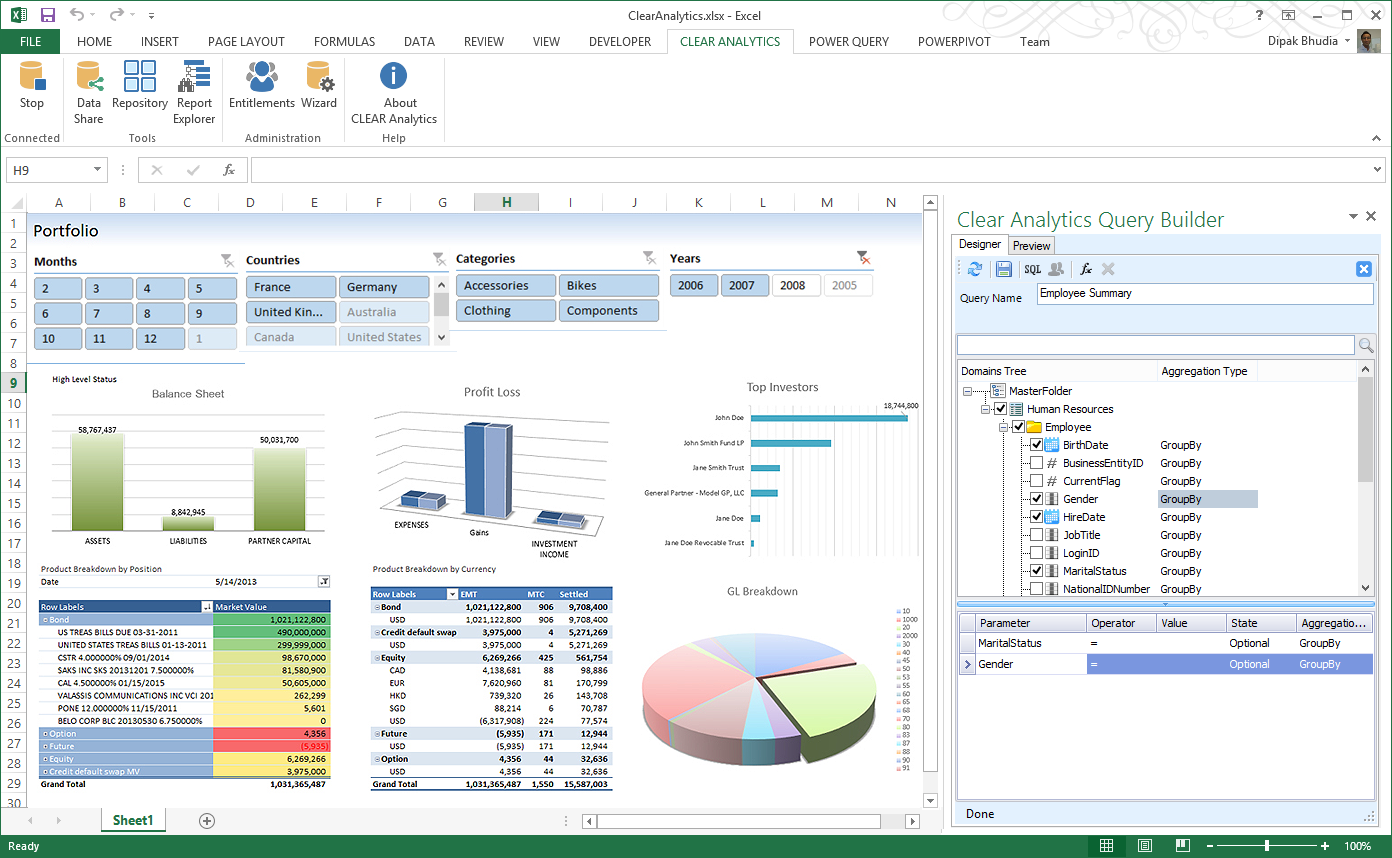
Clear Analytics is a business intelligence solution that enables non technical end users to perform analytics by leveraging existing knowledge of Excel coupled with a built in query builder. Some key features include: Dynamic Data Refresh, Data Share and In-Excel Collaboration.
$29
Per Seat per Month
Klipfolio Klips
Score 9.2 out of 10
Small Businesses (1-50 employees)
Klipfolio is a customizable dashboard and reporting platform that provides real-time business insights. It is used by small to mid-sized businesses and agencies to track performance metrics and create tailored reports, and to consolidate, transform, and visualize data.
$90
per month
Looker Studio
Score 8.1 out of 10
N/A
Looker Studio is a data visualization platform that transforms data into meaningful presentations and dashboards with customized reporting tools.
$9
per month per user per project
Pricing
Clear AnalyticsKlipfolio KlipsLooker Studio
Editions & Modules
Personal
$29
Per Seat per Month
Team
$165
upto 10 Seat per Month
Department
$265
upto 25 Seat per month
Organization
$565
Upto 100 per seat per month
Base
$90
per month
Grow
$190
per month
Team
$350
per month
Looker Studio Pro
$9
per month per user per project
Looker Studio
No charge
Offerings
Pricing Offerings
Clear AnalyticsKlipfolio KlipsLooker Studio
Free Trial
YesYesNo
Free/Freemium Version
NoNoYes
Premium Consulting/Integration Services
YesYesNo
Entry-level Setup Fee$800 Initial OnBoardingOptionalNo setup fee
Additional DetailsCertain Enterprise level features can be made available to Small Business edition at additional cost. Such services include Scheduler and OLAP connectivity. Custom adapters can also be created to connect to SaaS services.Discount available for annual pricing. There are various implementation and training options available, from a 60 Day Proof of Concept, to Onboarding & Training, or ongoing dedicated Data Hero support.
More Pricing Information
Community Pulse
Clear AnalyticsKlipfolio KlipsLooker Studio
Considered Multiple Products
Clear Analytics

No answer on this topic

Klipfolio Klips
Chose Klipfolio Klips
Over the years, I have been required to work with other platforms to collect and analyze data for a variety of ad agencies and clients that I have worked with. It really came down to a Goldilocks comparison where we consistently found that dashboard platforms were bloated with …
Chose Klipfolio Klips
Klipfolio had the best API. We could connect more MarTech with Klipfolio than any other BI tool we used. Klipfolio's API was also the most stable. We ran into connectivity issues with some of the competitors. The metrics wouldn't refresh because the API lost the connection …
Chose Klipfolio Klips

Klipfolio is certainly the best solution for dashboards. Compared to Power BI, Power BI is more of an analyst tool to build deep analysis and reports. Making and sharing dashboards in Power BI is a pain. Tableau is great but cost way more. Also, the skills needed to build …

Looker Studio
Features
Clear AnalyticsKlipfolio KlipsLooker Studio
BI Standard Reporting
Comparison of BI Standard Reporting features of Product A and Product B
Clear Analytics
9.0
8 Ratings
9% above category average
Klipfolio Klips
9.0
33 Ratings
11% above category average
Looker Studio
7.1
62 Ratings
13% below category average
Pixel Perfect reports9.08 Ratings9.13 Ratings6.743 Ratings
Customizable dashboards9.18 Ratings8.933 Ratings7.461 Ratings
Report Formatting Templates8.78 Ratings9.13 Ratings7.359 Ratings
Ad-hoc Reporting
Comparison of Ad-hoc Reporting features of Product A and Product B
Clear Analytics
8.9
8 Ratings
10% above category average
Klipfolio Klips
8.6
33 Ratings
10% above category average
Looker Studio
7.7
61 Ratings
1% below category average
Drill-down analysis9.28 Ratings8.35 Ratings7.151 Ratings
Formatting capabilities8.78 Ratings7.85 Ratings7.257 Ratings
Report sharing and collaboration8.98 Ratings9.133 Ratings9.759 Ratings
Integration with R or other statistical packages00 Ratings9.12 Ratings6.929 Ratings
Report Output and Scheduling
Comparison of Report Output and Scheduling features of Product A and Product B
Clear Analytics
9.0
8 Ratings
9% above category average
Klipfolio Klips
9.4
33 Ratings
14% above category average
Looker Studio
8.2
60 Ratings
0% above category average
Publish to Web9.08 Ratings8.931 Ratings8.353 Ratings
Publish to PDF9.17 Ratings9.228 Ratings8.853 Ratings
Report Versioning8.98 Ratings00 Ratings8.139 Ratings
Report Delivery Scheduling8.87 Ratings10.017 Ratings7.942 Ratings
Delivery to Remote Servers00 Ratings00 Ratings7.624 Ratings
Data Discovery and Visualization
Comparison of Data Discovery and Visualization features of Product A and Product B
Clear Analytics
9.0
8 Ratings
12% above category average
Klipfolio Klips
9.3
33 Ratings
18% above category average
Looker Studio
6.6
60 Ratings
16% below category average
Pre-built visualization formats (heatmaps, scatter plots etc.)8.98 Ratings8.932 Ratings7.360 Ratings
Location Analytics / Geographic Visualization9.18 Ratings9.133 Ratings7.857 Ratings
Predictive Analytics00 Ratings10.01 Ratings5.230 Ratings
Pattern Recognition and Data Mining00 Ratings00 Ratings6.16 Ratings
Access Control and Security
Comparison of Access Control and Security features of Product A and Product B
Clear Analytics
9.3
8 Ratings
9% above category average
Klipfolio Klips
-
Ratings
Looker Studio
-
Ratings
Multi-User Support (named login)9.48 Ratings00 Ratings00 Ratings
Role-Based Security Model9.08 Ratings00 Ratings00 Ratings
Multiple Access Permission Levels (Create, Read, Delete)9.48 Ratings00 Ratings00 Ratings
Mobile Capabilities
Comparison of Mobile Capabilities features of Product A and Product B
Clear Analytics
8.6
6 Ratings
11% above category average
Klipfolio Klips
-
Ratings
Looker Studio
-
Ratings
Mobile Application8.54 Ratings00 Ratings00 Ratings
Dashboard / Report / Visualization Interactivity on Mobile8.76 Ratings00 Ratings00 Ratings
Best Alternatives
Clear AnalyticsKlipfolio KlipsLooker Studio
Small Businesses
Yellowfin
Yellowfin
Score 8.7 out of 10
Supermetrics
Supermetrics
Score 9.7 out of 10
Supermetrics
Supermetrics
Score 9.7 out of 10
Medium-sized Companies
Reveal
Reveal
Score 10.0 out of 10
Supermetrics
Supermetrics
Score 9.7 out of 10
Supermetrics
Supermetrics
Score 9.7 out of 10
Enterprises
Kyvos Semantic Layer
Score 9.5 out of 10
IBM Analytics Engine
Score 7.2 out of 10
IBM Analytics Engine
Score 7.2 out of 10
All AlternativesView all alternativesView all alternativesView all alternatives
User Ratings
Clear AnalyticsKlipfolio KlipsLooker Studio
Likelihood to Recommend
9.0
(8 ratings)
8.8
(35 ratings)
8.6
(56 ratings)
Likelihood to Renew
-
(0 ratings)
-
(0 ratings)
9.0
(1 ratings)
Usability
9.1
(8 ratings)
9.5
(13 ratings)
8.5
(7 ratings)
Support Rating
9.5
(8 ratings)
9.1
(12 ratings)
6.7
(10 ratings)
Implementation Rating
-
(0 ratings)
8.2
(1 ratings)
-
(0 ratings)
User Testimonials
Clear AnalyticsKlipfolio KlipsLooker Studio
Likelihood to Recommend
Clear Analytics
Clear Analytics has almost all the features which are mostly required by the organizations for their data analytics and transformation activities. Clear Analytics is built on the support of a parallel query engine which makes it handle large volume requests and also provides optimized results. However, every solution has some limitations, Clear Analytics lacks advanced features such as Predictive Analytics which is a very demanding feature in the market as most organizations are adopting AI/ML automation for their businesses. Also, it needs to add a lot of advanced visualizations so that the user has the choice of selection. Overall a good solution to be recommended.
Read full review
Klipfolio
Using Klipfolio is one of the finest ways we can expand our business because it is so simple to use and always has new features that make it better. We also appreciate the excellent customer service they offer. There are several benefits to making this investment in your company's efficiency and profitability. We think it's worth the money.
Read full review
Google
Visualizing cross-channel campaign performance can blend data from a few different sources to compare performance metrics like spend, clicks, and conversions side-by-side in a single view, which helps in quick budget reallocation decisions. When dealing with massive volumes of data (millions of rows) or highly complex queries, Looker Studio dashboards can become slow, laggy, or even crash. Performance issues are a frequent complaint when working with large datasets, making it unsuitable for enterprise-level companies
Read full review
Pros
Clear Analytics
  • Quick management of the data through Excel thanks to the tools Clear Analytics provides such as filtering different information for an easier view.
  • Ability to add new KPIs to measure different areas of our business.
  • Drag and drop tool which makes an easier usage of Excel.
  • Cost-effective. I find Clear Analytics to be affordable considering the number of features added and the unlimited sharing and editing it provides.
Read full review
Klipfolio
  • All my reporting requirements have been met.
  • Salesforce, HubSpot, Mailchimp, Google Drive, and other business applications are quite easy to integrate with.
  • The information you need is at your fingertips in a matter of seconds.
  • Whenever I have a question, the customer service is always there to answer it.
Read full review
Google
  • Breath of data - the number of ways to interrogate the data is endless, and the options to view metrics alongside each other make for comprehensive datasets.
  • Data visualisation and customisation - the options for presenting data and separating out across pages allow for clean visuals and segmented information.
  • Easy shareability/usability - a quick and simple tool to introduce colleagues to, and easy to grant access for them to be able to view the data, without having to understand the setup itself.
Read full review
Cons
Clear Analytics
  • For Charts and Graphs , getting the Power Point Deck would be helpful. As of now we use the data from Excel Reports
Read full review
Klipfolio
  • While Klipfolio covers so many of the bases, one area where I would like to see expansion would be offering additional design and graphics themes for even more customization.
  • Klipfolio has an extensive offering but might be even better if there were a way that we could integrate with some small to mid-sized CRM solutions for audience list segmentation and marketing integrations.
  • It would be interesting if Klipfolio could enable us to overlay the data learnings for cross-referencing of multiple client campaigns for comparative insights.
Read full review
Google
  • It needs better handling of complex logic. We often need workarounds to perform complex custom calculations, and it can be really unpleasant at times.
  • Felt it got slow with a larger data set, and in one minor report, we had to set up time filters so that calculations during spikes could be traced more quickly.
  • Compare to competition they need to improve with notification things.
Read full review
Likelihood to Renew
Clear Analytics
No answers on this topic
Klipfolio
No answers on this topic
Google
It is the simplest and least expensive way for us to automate our reporting at this time. I like the ability to customize literally everything about each report, and the ability to send out reports automatically in emails. The only issue we have been having recently is a technical glitch in the automatic email report. Sadly, there is almost no support for this tool from Google, but is also free, so that is important to take into consideration
Read full review
Usability
Clear Analytics
I have really enjoyed working with Clear Analytics. This platform has contributed to increased production and reliable data control processes. It has flexible user interface that can be operated by any organization member. Reports are shared on simple and transparent way in the dashboard for easy access. Data analytics from all departments have created manageable working environment that have increased production.
Read full review
Klipfolio
My initial impressions of the software have been extremely positive. There are YouTube tutorials that explain how to make klips. The intuitive design of the UI It appears that everything in this software has been thoroughly tested to create all the visualizations that can be imagined as well as the user input controls that allow users to have exactly the data they want to be displayed in seconds, considering the various functions and formulas available in the Excel integrations and the extensive list of other services that can be integrated.
Read full review
Google
Looker Studio is easy to use, and it offers a sufficient variety of predefined visualizations to choose from. It's easy for us, and anyone can set up basic reporting without extensive data visualization skills. The interface layout is easy to understand, and it doesn't take long to get used to.
Read full review
Support Rating
Clear Analytics
I have had multiple scenarios where I had to reach out to the support team of Clear Analytics, be it access-related, general queries, during initial implementation, etc. My overall experience has always been good. I got the needed support every time without any delay. I can definitely recommend Clear Analytics simply on the basis of its excellent support team.
Read full review
Klipfolio
It provides all the necessary information to be able to carry out the analysis of any type of business, to know how money is managed virtually, what to do to have greater visibility, in addition to being a platform that is always accessible and allows continuous and efficient work.
Read full review
Google
I give it a lower support rating because it seems like our Dev team hasn't gotten the support they need to set up our database to connect. Seems like we hit a roadblock and the project got put on pause for dev. That sucks for me because it is harder to get the dev team to focus on it if they don't get the help they need to set it up.
Read full review
Implementation Rating
Clear Analytics
No answers on this topic
Klipfolio
None at all; just be sure of what information you will need for working.
Read full review
Google
No answers on this topic
Alternatives Considered
Clear Analytics
There are other great tools that are out there but Clear Analytics is reasonable for our business and provides a lot of features that we specifically needed
Read full review
Klipfolio
These and many other BI tools are the most direct competitors. I only have experience with Klipfolio and Tableau. Tableau is definitely more capable, but much more difficult to learn and use. Klipfolio is simple and really packs a punch for its simplicity. I have yet to run into a major problem with it lacking a needed functionality.
Read full review
Google
Looker Studio is far easier to implement, stand up, and learn. The interface is simpler and user-friendly for various levels of data visualization/analysis knowledge and experience. The biggest benefit of Looker Studio, however, is its ease of connection to GA data and speed. Furthermore, since it is an online program/tool, it requires less CPU/battery/storage on the user's device.
Read full review
Return on Investment
Clear Analytics
  • Super useful to get started immediately
  • Didn't have to rely on migrating data
  • Easy to add members
  • Easy to learn and build charts
Read full review
Klipfolio
  • It made reporting a breeze as we didn't have to spend time creating the reports
  • The reporting forum really helped give our team more metrics to add to reporting
  • Always ready to view Dashboard meant stakeholders could view reports at any given time
Read full review
Google
  • Free, so the only investment is time
  • Because it doesn't have native support of non-Google sources, it can cost more money than Tableau
  • The time spent formatting the templates or building connectors can have a negative impact on ROI
  • As a agency, charging for the reporting service is profitable after the first month or two after building the dashboard.
Read full review
ScreenShots

Clear Analytics Screenshots

Screenshot of Clear Analytics integrated Excel panel essentially transforms standalone Excel into an enterprise strength, fully auditable, collaborative and centralized business intelligence platform.Screenshot of Users have the ability to dynamically query systems and render that data in any way they like.  No more waiting on IT to create reports.Screenshot of Your firms existing knowledge of Excel enables the firm to be product from day 1. Use the skills already present in your organization and don't pay for outside reporting consultants to create reports for you.Screenshot of Leverage the integration capability of Microsoft's Power BI to extend the reach of your data to web and mobile devices.Screenshot of Leverage all of Excels capabilities, from it's slicers to miniature spark-line charts to create incredibly informative and responsive dashboards.

Klipfolio Klips Screenshots

Screenshot of an example of a customized dashboard. For showcasing KPIs, tracking performance, or telling complex data stories, Klips lets the user tailor layouts, visuals, and insights, ensuring dashboards are suitable for internal teams or external stakeholders.Screenshot of visualizations, with descriptive text blocks and live data to communicate more than just numbers. Klips lets users insert real-time data directly into text to add context, improving interpretation. Progress towards goals and trends can be tracked using vibrant charts, colors, and text descriptions.Screenshot of one example of the over 30 chart types available, some including bar graphs, pie charts, and heatmaps. The library of pre-built Klip templates connect to popular data sources like Google Analytics, HubSpot, or Salesforce. These templates can be modified.Screenshot of Klipfolio’s formula engine. Similar to Excel, the Klip Editor can be used to clean, transform, and analyze data using functions. Users can perform complex calculations, manipulate dates or text, and add logic or statistical formulas.Screenshot of the Klip editor, used to take precise control over visual properties, customizing font sizes, colors, and styles to match a brand, or to emphasize key metrics. Set decimal places for numerical data, and add prefixes or suffixes—such as currency symbols or percentages—for clear and professional formatting. It also supports conditional formatting, and dynamic colors or icons to highlight trends, anomalies, or thresholds. These tools allow the user to craft Klips that not only deliver insights but also communicate them at a glance.Screenshot of a Klipfolio Klips dashboard. These allow users to customize every aspect, from layouts and fonts to colors and chart styles, ensuring that dashboards align with a brand. For presenting on a laptop, a big-screen TV, or by sharing published links, dashboards are designed to look exceptional in both light and dark modes.