Datadog is a monitoring service for IT, Dev and Ops teams who write and run applications at scale, and want to turn the massive amounts of data produced by their apps, tools and services into actionable insight.
$18
per month per host
Grafana Cloud
Score8.6 out of 10
N/A
Grafana Cloud is a fully managed Observability Platform designed to aggregate, visualize, and analyze telemetry data across distributed architectures. The platform provides a unified environment for Metrics, Logs, Traces, and Continuous Profiling, utilizing the LGTM (Loki, Grafana, Tempo, Mimir) and Pyroscope stack to provide high-cardinality analysis of system state.
$0
Rational BI
Score7.7 out of 10
Enterprise companies (1,001+ employees)
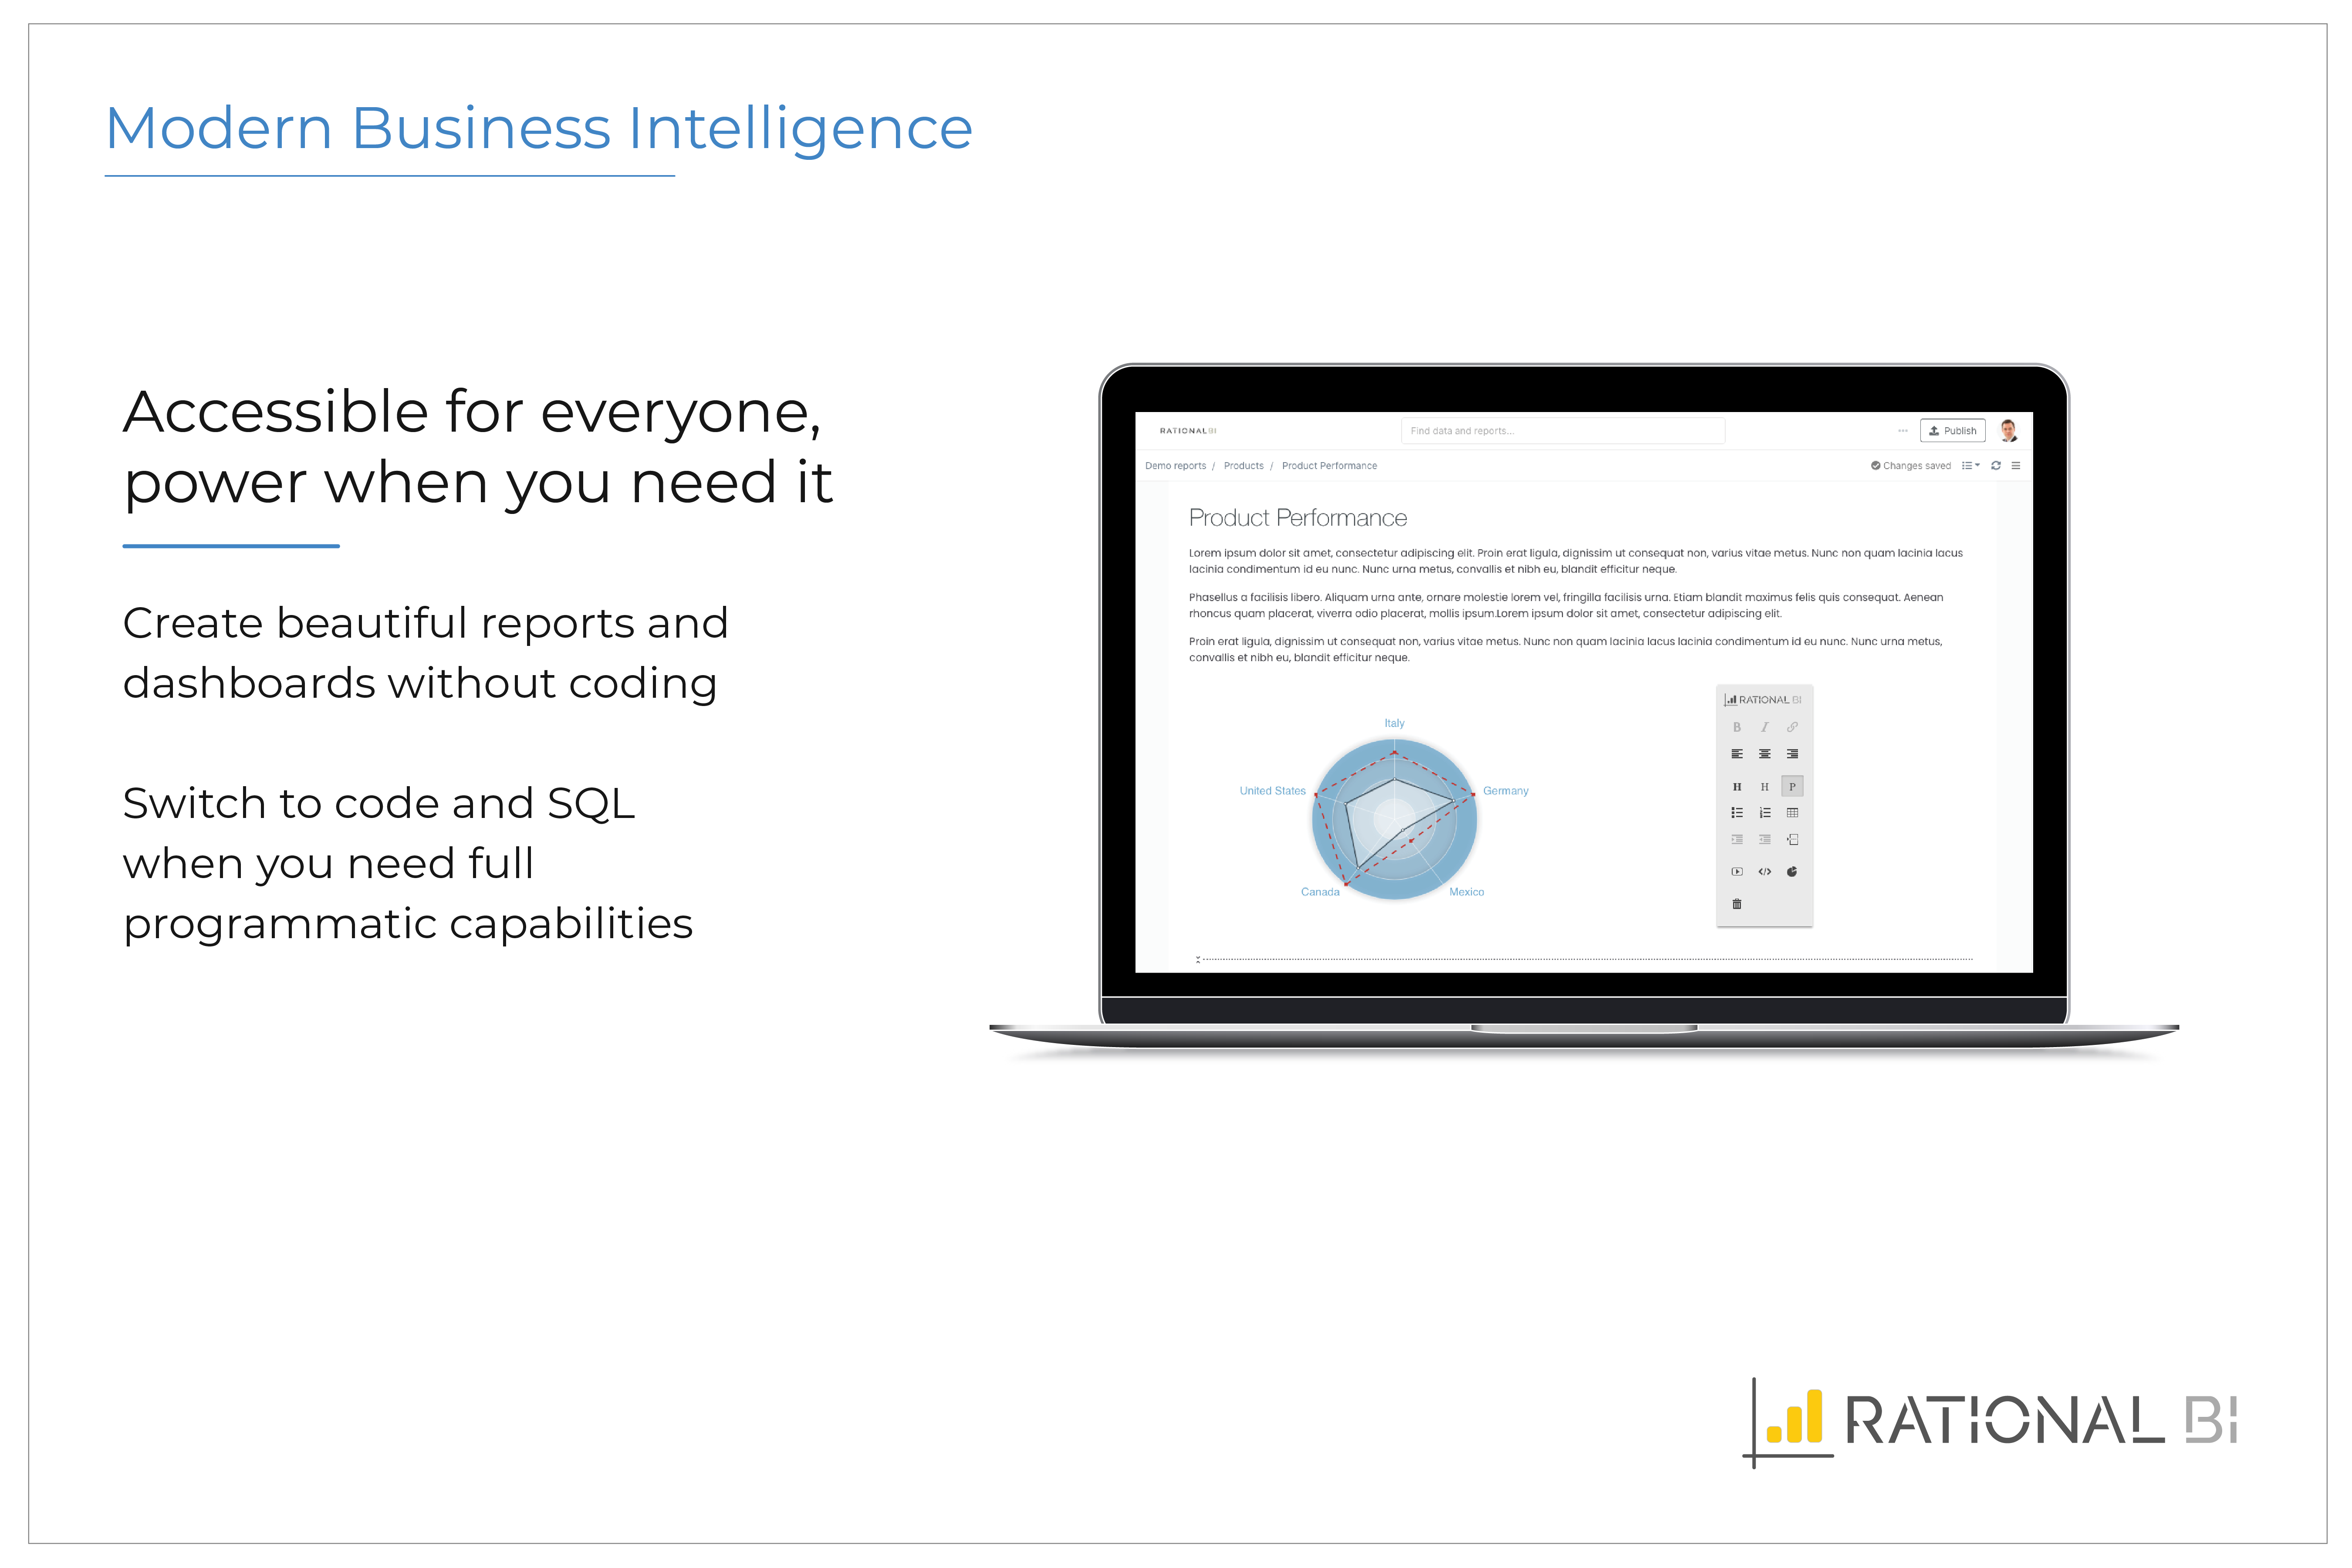
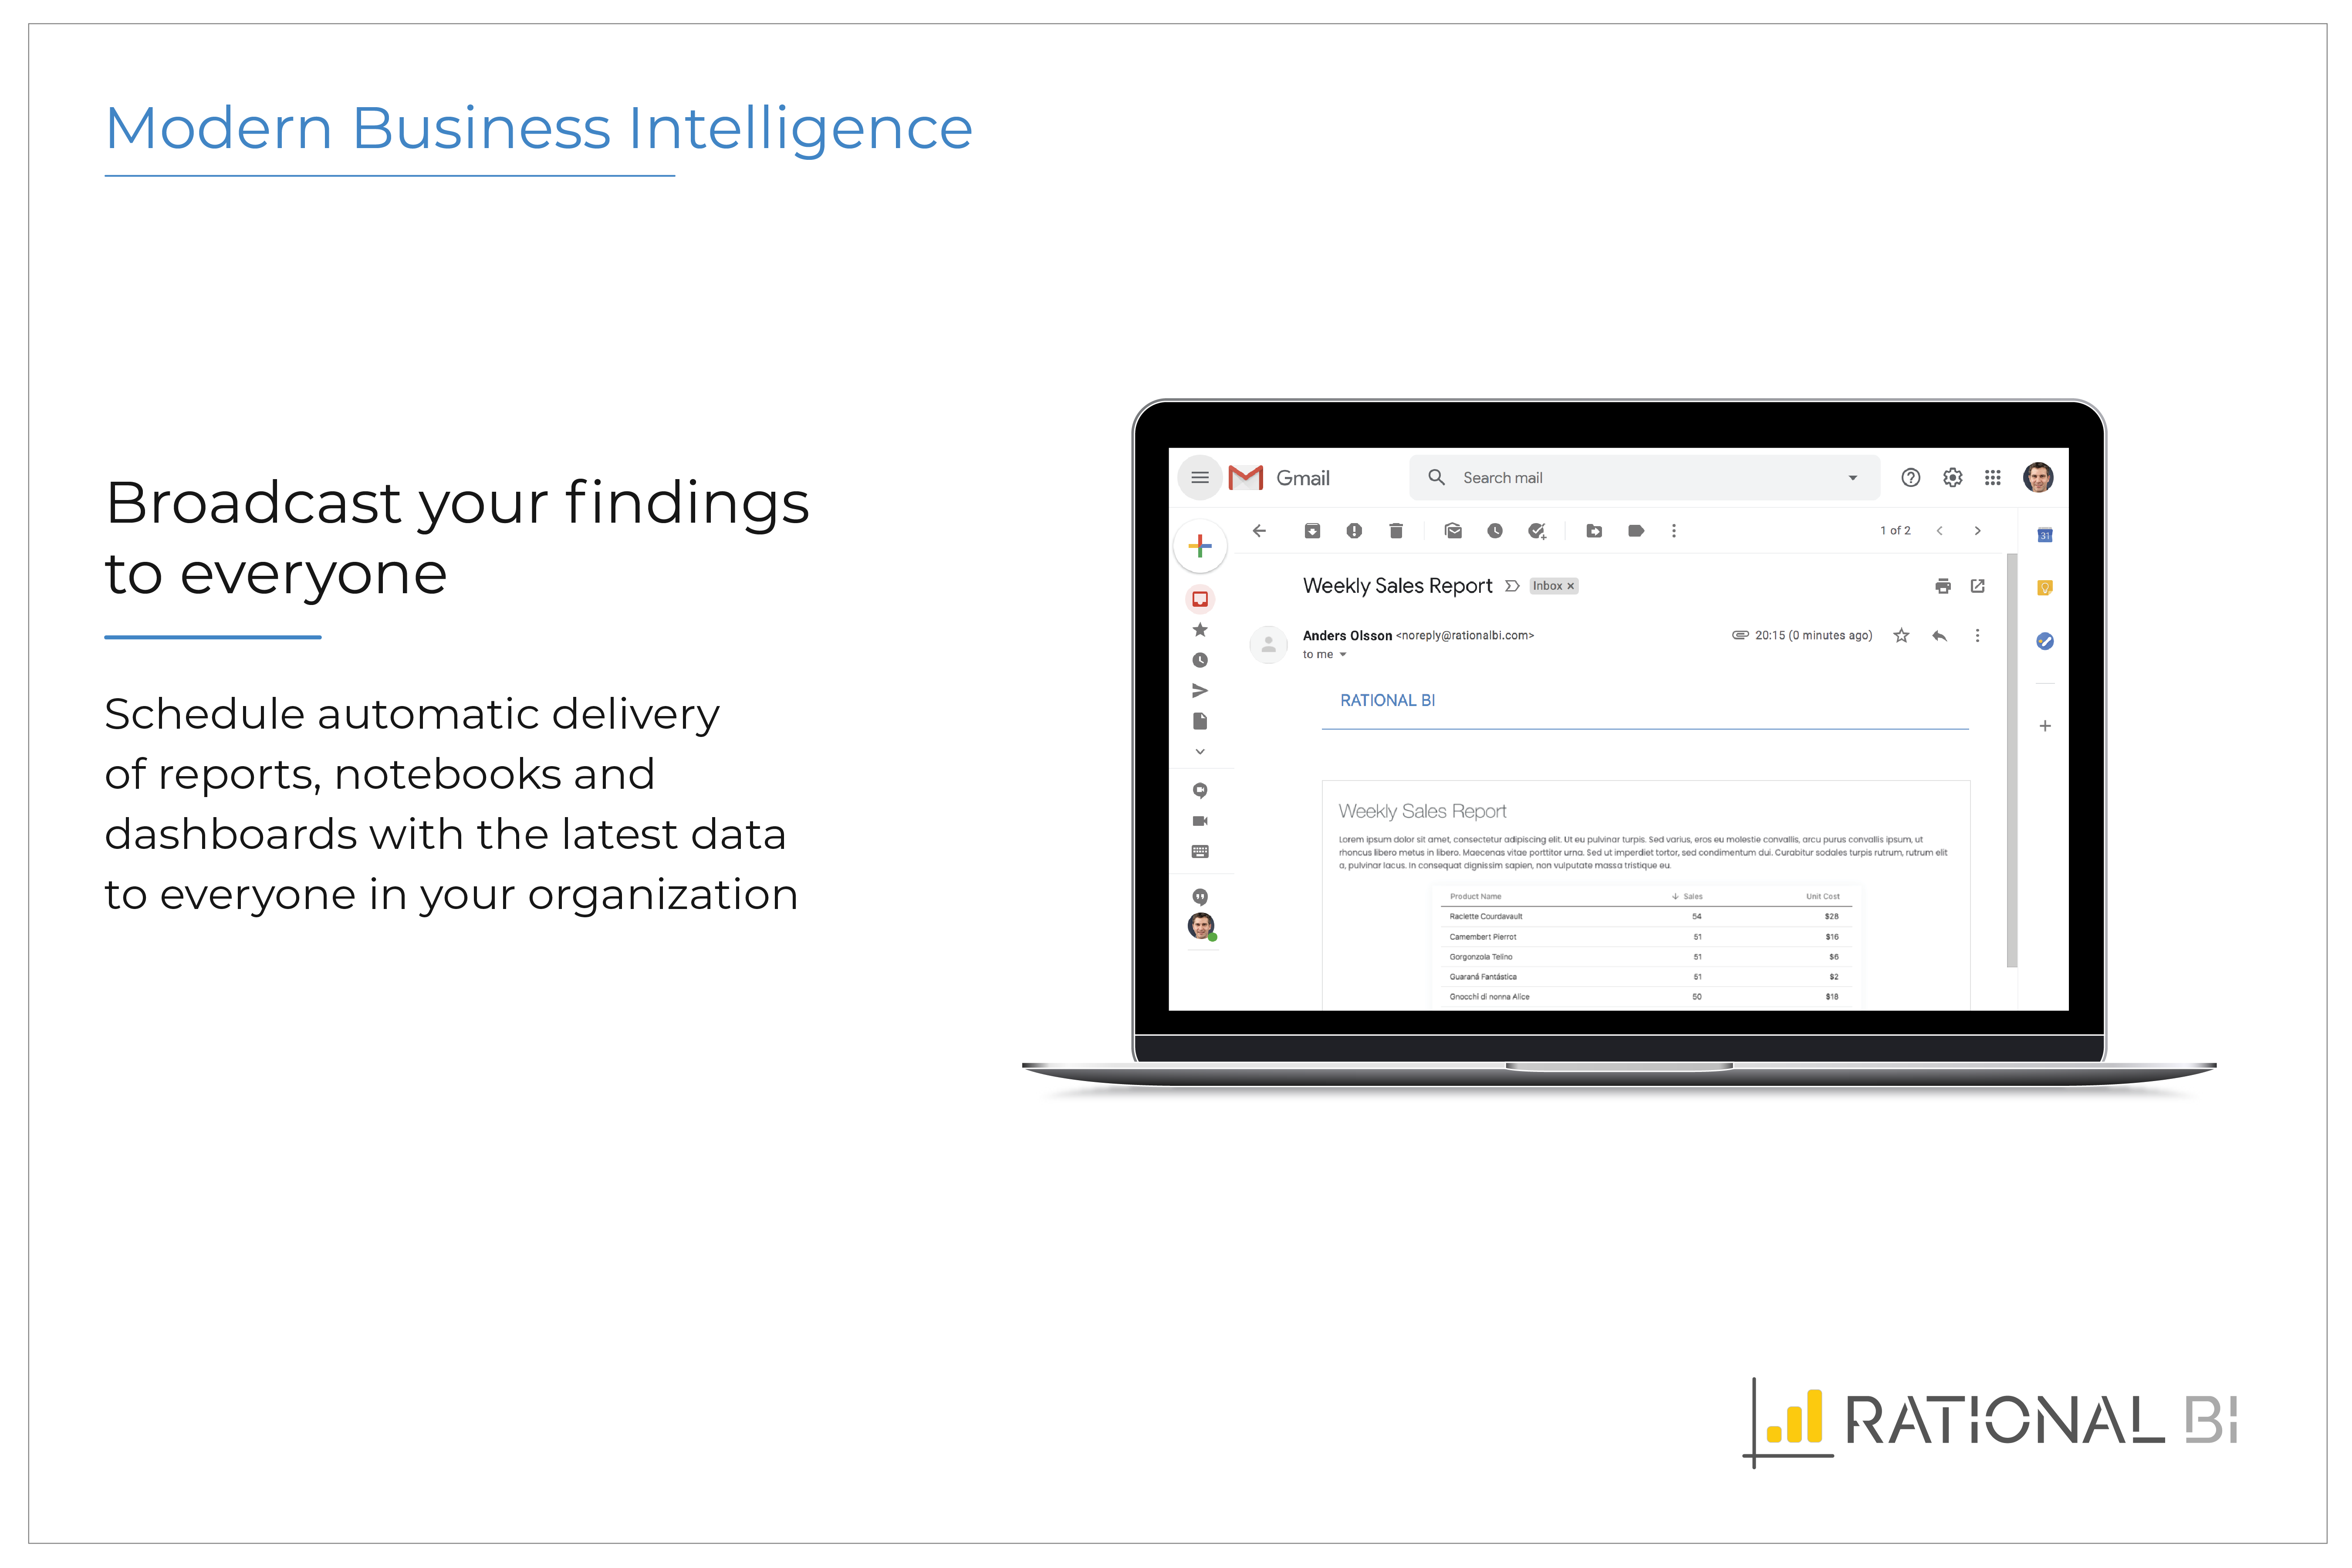
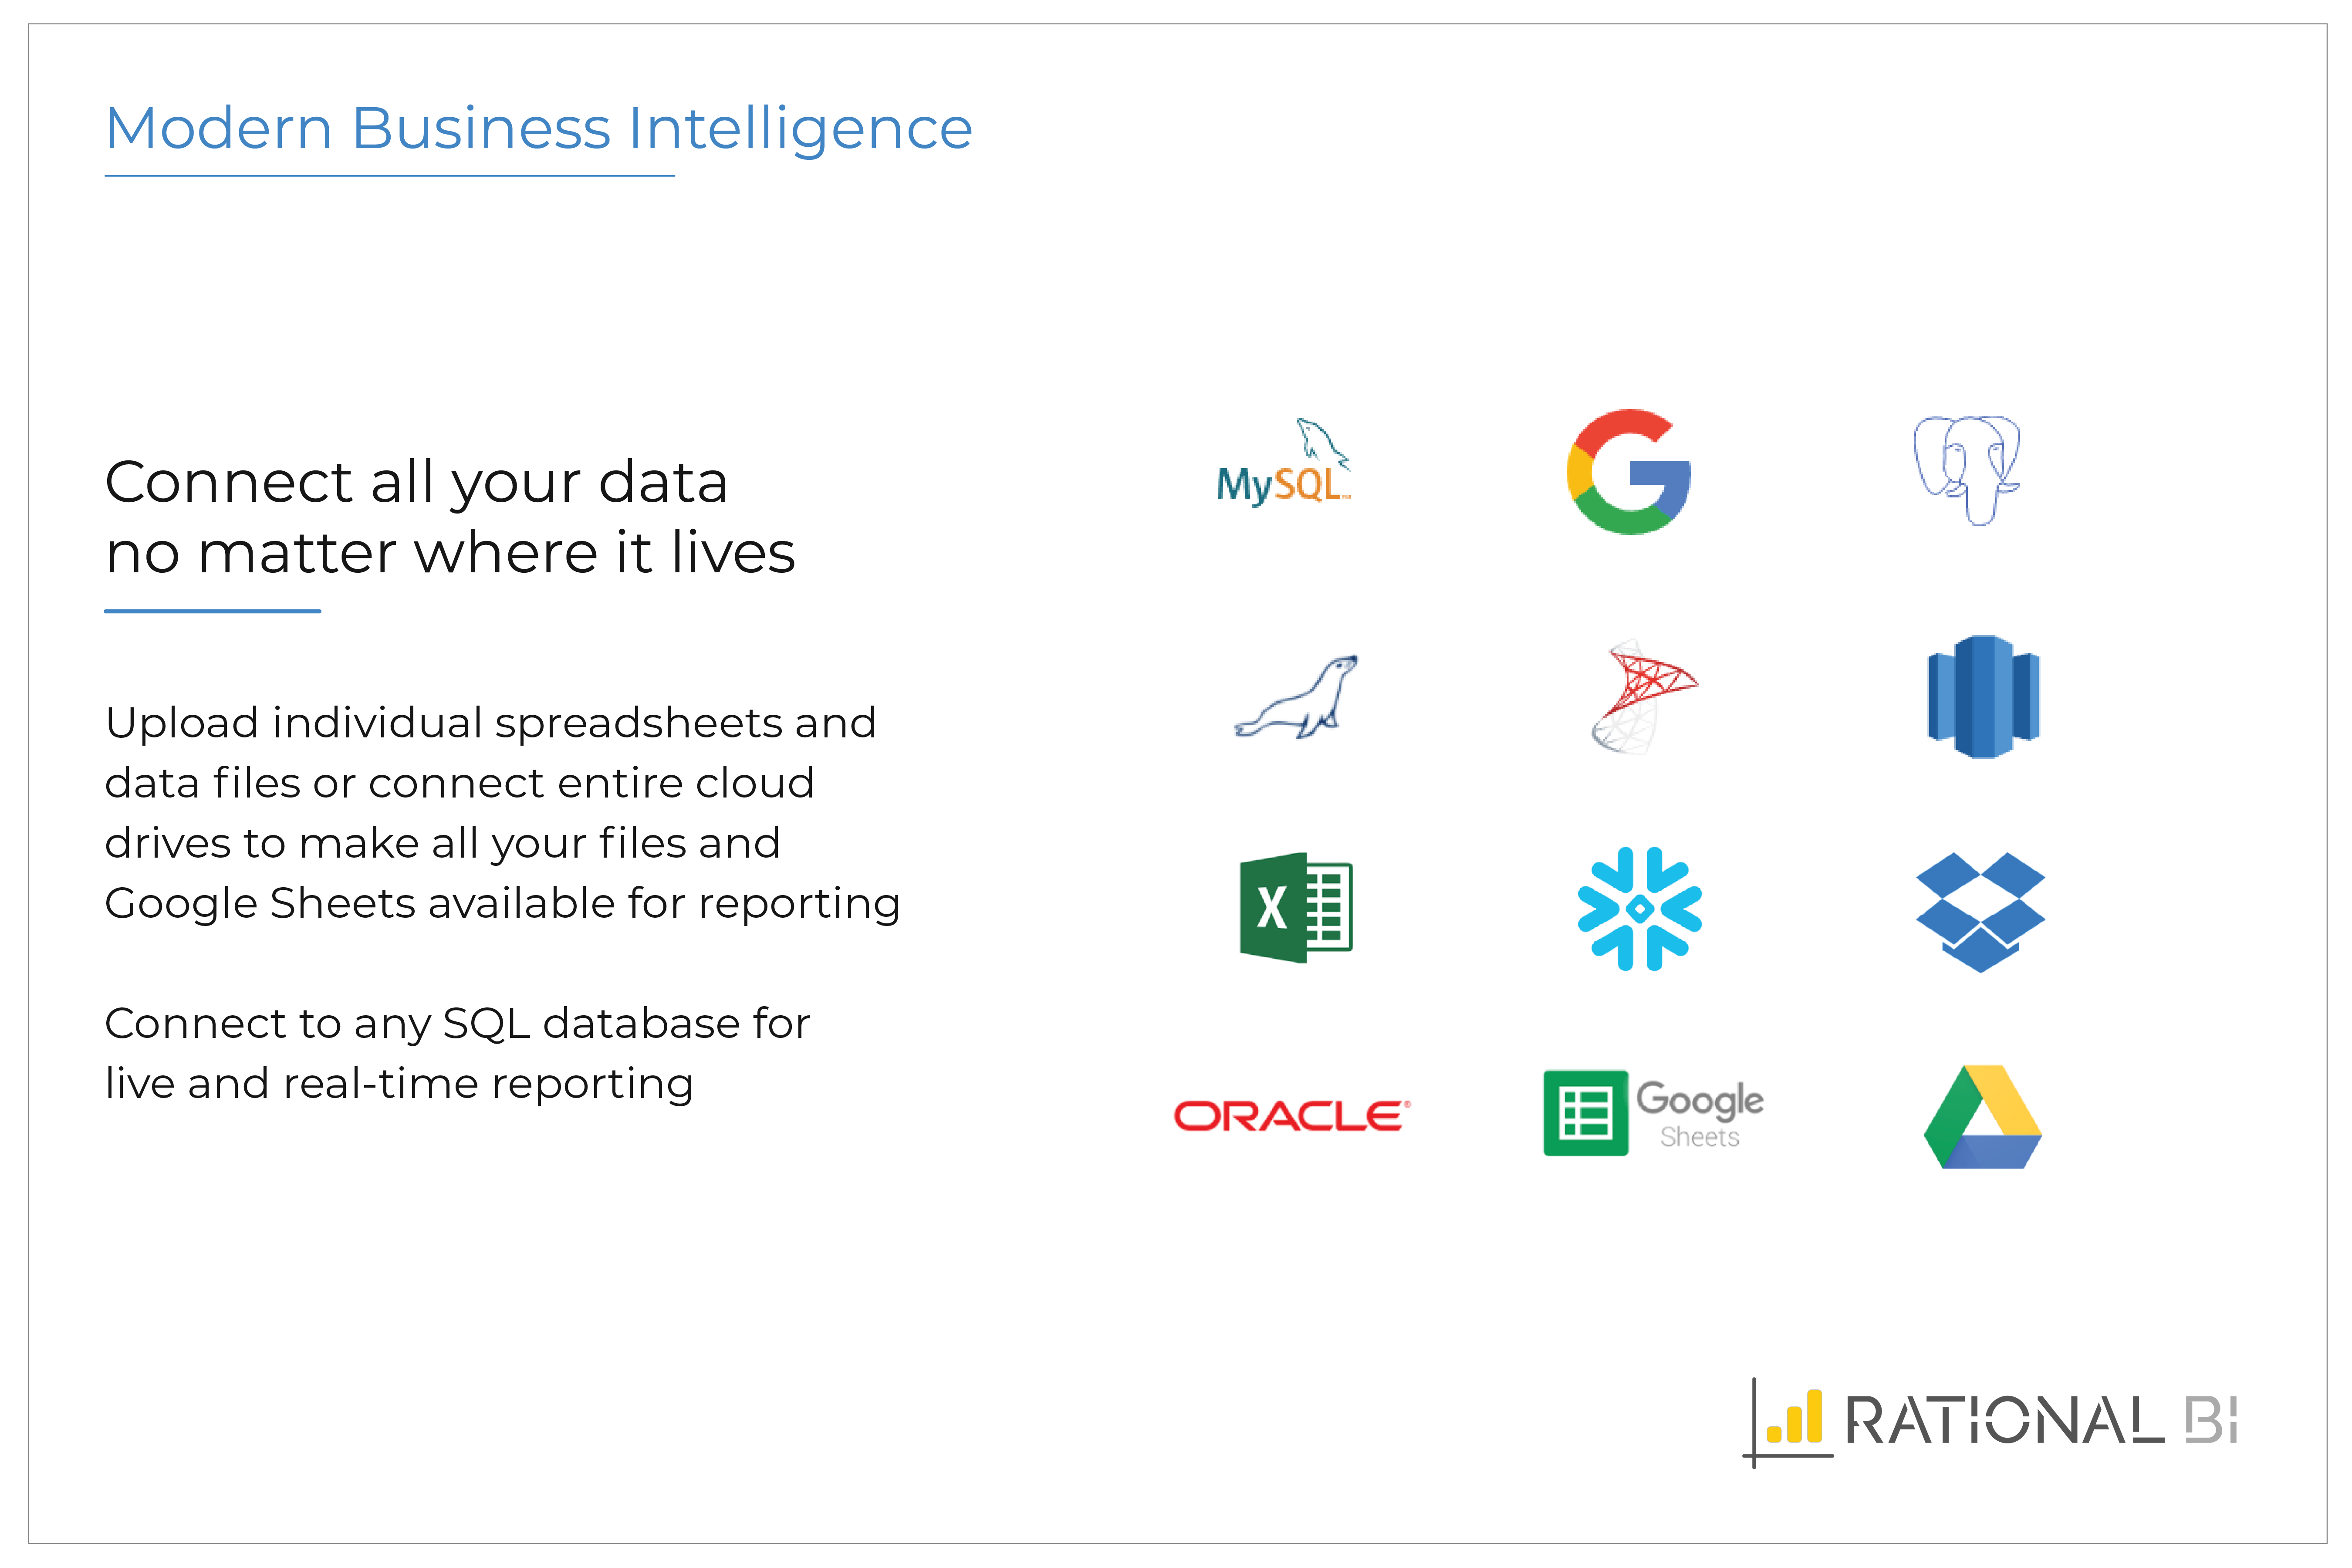
Rational BI provides analytics, data science and business intelligence in an analytical platform that connects to databases, data files and cloud drives including AWS and Azure data sources, enabling users to explore and visualize data. Users can build real-time notebook-style reports directly in a web browser with JavaScript and SQL with direct and live connections to data. Filter and query data with an SQL database embedded in the client, without network…
$0
single user
Pricing
Datadog
Grafana Cloud
Rational BI
Editions & Modules
Log Management
$1.27
per month (billed annually) per host
Infrastructure
$15.00
per month (billed annually) per host
Standard
$18
per month per host
Enterprise
$27
per month per host
DevSecOps Pro
$27
per month per host
APM
$31.00
per month (billed annually) per host
DevSecOps Enterprise
$41
per month per host
Grafana Cloud - Pro
$8
per month up to 1 active user
Grafana Cloud - Free
Free
10k metrics + 50GB logs + 50GB traces up to 3 active users
Grafana Cloud - Advanced
Volume Discounts
custom data usage custom active users
Grafana - Enterprise Stack
Custom Pricing
Free
$0
single user
Professional
$129
single user
Enterprise
Varies
single user
Offerings
Pricing Offerings
Datadog
Grafana Cloud
Rational BI
Free Trial
Yes
Yes
Yes
Free/Freemium Version
Yes
Yes
Yes
Premium Consulting/Integration Services
No
No
Yes
Entry-level Setup Fee
Optional
No setup fee
Optional
Additional Details
Discount available for annual pricing. Multi-Year/Volume discounts available (500+ hosts/mo).
—
Additional cost per extra user (varies by edition)
Sr SWE in Engineering at Unnatural Products Inc (Biotechnology, 11-50 employees)
Chose Datadog
Datadog is a more complex but complete solution than any of the other Log Aggregation, monitoring, or general observabilty tools that we have trialed. I found it easier to setup following useful and up-to-date documentation provided directly by Datadog instead of scattered …
A de minimis incentive was given to thank the reviewer for their time. The incentive was not used to bias or drive a particular response, nor was the incentive contingent on a positive endorsement. More Info
Sr. DevOps Engineer in Engineering at Bectran (Financial Services, 51-200 employees)
Chose Datadog
First think first - it's easy to use, and very easy to implement in any infrastructure. It provides a custom dashboard and monitors. I’ve used or evaluated Grafana, Prometheus, Amazon CloudWatch, and Dynatrace, and each tool has strong capabilities. Prometheus + Grafana provide …
A de minimis incentive was given to thank the reviewer for their time. The incentive was not used to bias or drive a particular response, nor was the incentive contingent on a positive endorsement. More Info
Verified User
Chose Datadog
All other tools dont have all the features which Datadog provides. Easy to use from UI where other may have complicated UI or no UI at all to create monitors. Consider like AWS Grafana, we have limitation to create monitors from UI. There is no recurring downtime for monitors. …
A de minimis incentive was given to thank the reviewer for their time. The incentive was not used to bias or drive a particular response, nor was the incentive contingent on a positive endorsement. TR verified that a representative sample of customers was invited. More Info
Software Engineer in Engineering at Kore.ai (Information Technology & Services, 501-1000 employees)
Chose Datadog
we primarily use Kubernetes, and Prometheus is great for collecting time series metrics, especially in Kubernetes. and Grafana is used for dashboards. As these are open source, we host them and manage them internally. We choose Datadog because of its logs, traces, and …
A de minimis incentive was given to thank the reviewer for their time. The incentive was not used to bias or drive a particular response, nor was the incentive contingent on a positive endorsement. More Info
Software Engineer in Information Technology at Kore.ai (Information Technology & Services, 1001-5000 employees)
Chose Datadog
1. Grafana is good, but a lot of integration is required for it to work. .that not the case of Datadog 2. Faster to set up Datadog instead of Grafana 3. Alerting in Datadog feels much easier thanin Grafana.
A de minimis incentive was given to thank the reviewer for their time. The incentive was not used to bias or drive a particular response, nor was the incentive contingent on a positive endorsement. TR verified that a representative sample of customers was invited. More Info
Verified User
Chose Datadog
Dynatrace was cheaper but, in my opinion, its setup, features, and overall user experience do not come close to what Datadog can offer, making it more of a pain to use and not worth the cheaper cost over Datadog (especially if migrating away from Datadog to Dynatrace).
A de minimis incentive was given to thank the reviewer for their time. The incentive was not used to bias or drive a particular response, nor was the incentive contingent on a positive endorsement. More Info
Verified User
Chose Datadog
Its the Enterprise level decision, definitely usability and features perspective Datadog is much more advanced.
A de minimis incentive was given to thank the reviewer for their time. The incentive was not used to bias or drive a particular response, nor was the incentive contingent on a positive endorsement. More Info
Verified User
Chose Datadog
I use Datadog because it concentrates all these features into a single tool, facilitating the learning curve that my platform and development engineering team needs in order to be able to set up the monitors/alerts/SLIs/SLOs as well as to diagnose a production issue. Its easier …
A de minimis incentive was given to thank the reviewer for their time. The incentive was not used to bias or drive a particular response, nor was the incentive contingent on a positive endorsement. TR verified that a representative sample of customers was invited. More Info
Verified User
Chose Datadog
Kibana Datadog … because within our usecase we have all the events in Kibana but sampled traces in Datadog … but if we had all the traces it would have been much more useful
A de minimis incentive was given to thank the reviewer for their time. The incentive was not used to bias or drive a particular response, nor was the incentive contingent on a positive endorsement. More Info
A de minimis incentive was given to thank the reviewer for their time. The incentive was not used to bias or drive a particular response, nor was the incentive contingent on a positive endorsement. More Info
Verified User
Chose Datadog
I selected Datadog because of its features and the wide range of integration support. As I already told it supports more that 600+ integrations which helps and organization to keep everything in a single place and also its AI feature which is reducing the time for root cause …
A de minimis incentive was given to thank the reviewer for their time. The incentive was not used to bias or drive a particular response, nor was the incentive contingent on a positive endorsement. TR verified that a representative sample of customers was invited. More Info
Verified User
Chose Datadog
Datadog is best for cloud-native and fast-setup. It is more mature for infrastructure and real-time observability. The UI is more user-friendly and provides wide coverage of app insights.
A de minimis incentive was given to thank the reviewer for their time. The incentive was not used to bias or drive a particular response, nor was the incentive contingent on a positive endorsement. TR verified that a representative sample of customers was invited. More Info
DevOps Engineer in Engineering at Finch (Information Technology & Services, 51-200 employees)
Chose Datadog
ease of use and implementation, other than New Relic (which I think is terrible in every possible way), the other two support opentelemetry better, have more manageable costs and comparable basic services, but they do not have the breadt of services dd does.
A de minimis incentive was given to thank the reviewer for their time. The incentive was not used to bias or drive a particular response, nor was the incentive contingent on a positive endorsement. More Info
Verified User
Chose Datadog
Better performance and visibility than what I was able to obtain out of AppDynamics
Their OnCall offering is very fresh still, but is already almost at parity with Splunk On Call (VictorOps)
A de minimis incentive was given to thank the reviewer for their time. The incentive was not used to bias or drive a particular response, nor was the incentive contingent on a positive endorsement. More Info
DevOps Engineer in Engineering at Freecharge (Information Technology & Services, 201-500 employees)
Chose Datadog
It's a one-stop solution for all our needs whereas in other open-source tools, we have an operational overhead to keep and manage the uptime of these tools as well and also manage their versioning, upgrade, and patching cycle. Also if there are any bugs then we have to raise an …
A de minimis incentive was given to thank the reviewer for their time. The incentive was not used to bias or drive a particular response, nor was the incentive contingent on a positive endorsement. More Info
infastructure consultant in Information Technology at Vetasi Limited (Information Technology & Services, 51-200 employees)
Chose Grafana Cloud
Grafana has a direct plugin to Icinga monitoring solution and allowed for easy configuration for us. At the time of implementation, other services did not have such an integration. As we already had a very customized and heavily introduced monitoring solution in place, we …
A de minimis incentive was given to thank the reviewer for their time. The incentive was not used to bias or drive a particular response, nor was the incentive contingent on a positive endorsement. More Info
Datadog may be better suited for teams that have a more out-of-the-box infrastructure, on the primary platforms Datadog supports. You may also have better results if you have a bigger team dedicated to devops and/or a bigger budget. We found that trying to adapt it to our use case (small team, .NET on AWS Fargate) wasn't feasible. We continually ran into roadblocks that required us to dig through documentation (and at times, having to figure out some documentation was wrong), go back and forth with support, and in my opinion, waste money on excessive and unintended usages due to opaque pricing models and inaccurate usage reports, as well as broken/non-functional rate sampling controls.
A de minimis incentive was given to thank the reviewer for their time. The incentive was not used to bias or drive a particular response, nor was the incentive contingent on a positive endorsement. TR verified that a representative sample of customers was invited. More Info
Just about any organization with more than one server and more than one cluster as it scales very well. Configuration of the application takes time and finesse to fine tune to where the balance of load time and getting data quickly meets. The plugins add load time but fine tuning for the application to meet demand needs nailed down at implementation
A de minimis incentive was given to thank the reviewer for their time. The incentive was not used to bias or drive a particular response, nor was the incentive contingent on a positive endorsement. More Info
Definitely well suited for small companies, but again many of their competitors are also well suited in this segment. We were in general happy with the solution provided, but I'm not blown away by their solution or support. If you want to get more data-driven visual boards with data displayed in nice graphics is in my opinion a good start, and here Rational BI delivers what it should.
A de minimis incentive was given to thank the reviewer for their time. The incentive was not used to bias or drive a particular response, nor was the incentive contingent on a positive endorsement. More Info
The thing which Datadog does really well, one of them are its broad range of services integrations and features which makes it one step observability solution for all. We can monitor all types of our application, infrastructure, hosts, databases etc with Datadog.
Its custom dashboard feature which helps us to visualize the data in a better way . It supports different types of charts through those charts we can create our dashboard more attractive.
Its AI powered alerting capability though that we can easily identify the root cause and also it has a low noise alerting capability which means it correlated the similar type of issues.
A de minimis incentive was given to thank the reviewer for their time. The incentive was not used to bias or drive a particular response, nor was the incentive contingent on a positive endorsement. TR verified that a representative sample of customers was invited. More Info
A de minimis incentive was given to thank the reviewer for their time. The incentive was not used to bias or drive a particular response, nor was the incentive contingent on a positive endorsement. More Info
A de minimis incentive was given to thank the reviewer for their time. The incentive was not used to bias or drive a particular response, nor was the incentive contingent on a positive endorsement. More Info
Alert windows cause lag in notifications (e.g. if the alert window is X errors in 1 hour, we won't get alerted until the end of the 1 hour range)
I would appreciate more supportive examples for how to filter and view metrics in the explorer
I would like a more clear interface for metrics that are missing in a time frame, rather than only showing tags/etc. for metrics that were collected within the currently viewed time frame
A de minimis incentive was given to thank the reviewer for their time. The incentive was not used to bias or drive a particular response, nor was the incentive contingent on a positive endorsement. More Info
A de minimis incentive was given to thank the reviewer for their time. The incentive was not used to bias or drive a particular response, nor was the incentive contingent on a positive endorsement. More Info
A de minimis incentive was given to thank the reviewer for their time. The incentive was not used to bias or drive a particular response, nor was the incentive contingent on a positive endorsement. TR verified that a representative sample of customers was invited. More Info
There are so many features that it can be hard to figure out where you need to go for your own use case. For example, RUM monitoring us buried in a "Digital Experience" sidebar setting when this is one of our key use cases that I sometimes struggle to find in the application. It appears that ECS + Fargate monitoring was recently released which is great because we had to build a lambda reporting solution for ephemeral task monitoring. But this new feature was never on my radar until I starting clicking around the application.
A de minimis incentive was given to thank the reviewer for their time. The incentive was not used to bias or drive a particular response, nor was the incentive contingent on a positive endorsement. More Info
It is infinitely flexible. If you can imagine it, Grafana can almost certainly do it. Usability may be in the eye of the beholder however, as there is time needed to curate the experience and get the dashboards customized to how it makes sense to you. I know one thing they are working on are more templates, based on data sources
A de minimis incentive was given to thank the reviewer for their time. The incentive was not used to bias or drive a particular response, nor was the incentive contingent on a positive endorsement. More Info
Overall Rational BI is a valuable enterprise reporting tool for any data driven organization. It offers great depth and breadth of features for reporting and analytics that can lead to better business outcomes. Its easy to use and highly configurable to evolve to changing reporting needs of organizations of any scale.
A de minimis incentive was given to thank the reviewer for their time. The incentive was not used to bias or drive a particular response, nor was the incentive contingent on a positive endorsement. More Info
The support team usually gets it right. We did have a rather complicate issue setting up monitoring on a domain controller. However, they are usually responsive and helpful over chat. The downside would be I don’t think they have any phone support. If that is important to you this might not be a good fit.
A de minimis incentive was given to thank the reviewer for their time. The incentive was not used to bias or drive a particular response, nor was the incentive contingent on a positive endorsement. More Info
I haven't used the support myself, but my colleagues have been satisfied with the support. As I have understood from my colleagues the support is as you could expect. Still, the documentation could be better and that could avoid the need to contact their support, but overall we're still happy with the support as well.
A de minimis incentive was given to thank the reviewer for their time. The incentive was not used to bias or drive a particular response, nor was the incentive contingent on a positive endorsement. More Info
A de minimis incentive was given to thank the reviewer for their time. The incentive was not used to bias or drive a particular response, nor was the incentive contingent on a positive endorsement. TR verified that a representative sample of customers was invited. More Info
Our logs are very important, and Datadog manages them exceptionally well. We frequently use Datadog services for our investigations. Use case: Monitor your apps, infrastructure, APIs, and user experience.
Key features:
Logs, metrics, and APM (Application Performance Monitoring)
Real-time alerting and dashboards
Supports Kubernetes, AWS, GCP, and other integrations
RUM (Real User Monitoring) and Synthetics
✅ Best for backend, server, and distributed systems monitoring.
A de minimis incentive was given to thank the reviewer for their time. The incentive was not used to bias or drive a particular response, nor was the incentive contingent on a positive endorsement. More Info
Grafana blows Nagios out of the water when it comes to customization. The ability to feed almost any data source makes it very versatile and the cost is great.
A de minimis incentive was given to thank the reviewer for their time. The incentive was not used to bias or drive a particular response, nor was the incentive contingent on a positive endorsement. More Info
Rational BI allows a deeper data analysis with respect to the other software I experimented with. The velocity to perform the analysis is similar to the other one. The predictive analysis could be very useful, but at the moment I do not use it in my activities. Dashboards are nice and easy to understand.
A de minimis incentive was given to thank the reviewer for their time. The incentive was not used to bias or drive a particular response, nor was the incentive contingent on a positive endorsement. More Info
A de minimis incentive was given to thank the reviewer for their time. The incentive was not used to bias or drive a particular response, nor was the incentive contingent on a positive endorsement. More Info
A de minimis incentive was given to thank the reviewer for their time. The incentive was not used to bias or drive a particular response, nor was the incentive contingent on a positive endorsement. More Info
A de minimis incentive was given to thank the reviewer for their time. The incentive was not used to bias or drive a particular response, nor was the incentive contingent on a positive endorsement. More Info