Datadog is a monitoring service for IT, Dev and Ops teams who write and run applications at scale, and want to turn the massive amounts of data produced by their apps, tools and services into actionable insight.
$18
per month per host
IBM SevOne
Score 8.2 out of 10
N/A
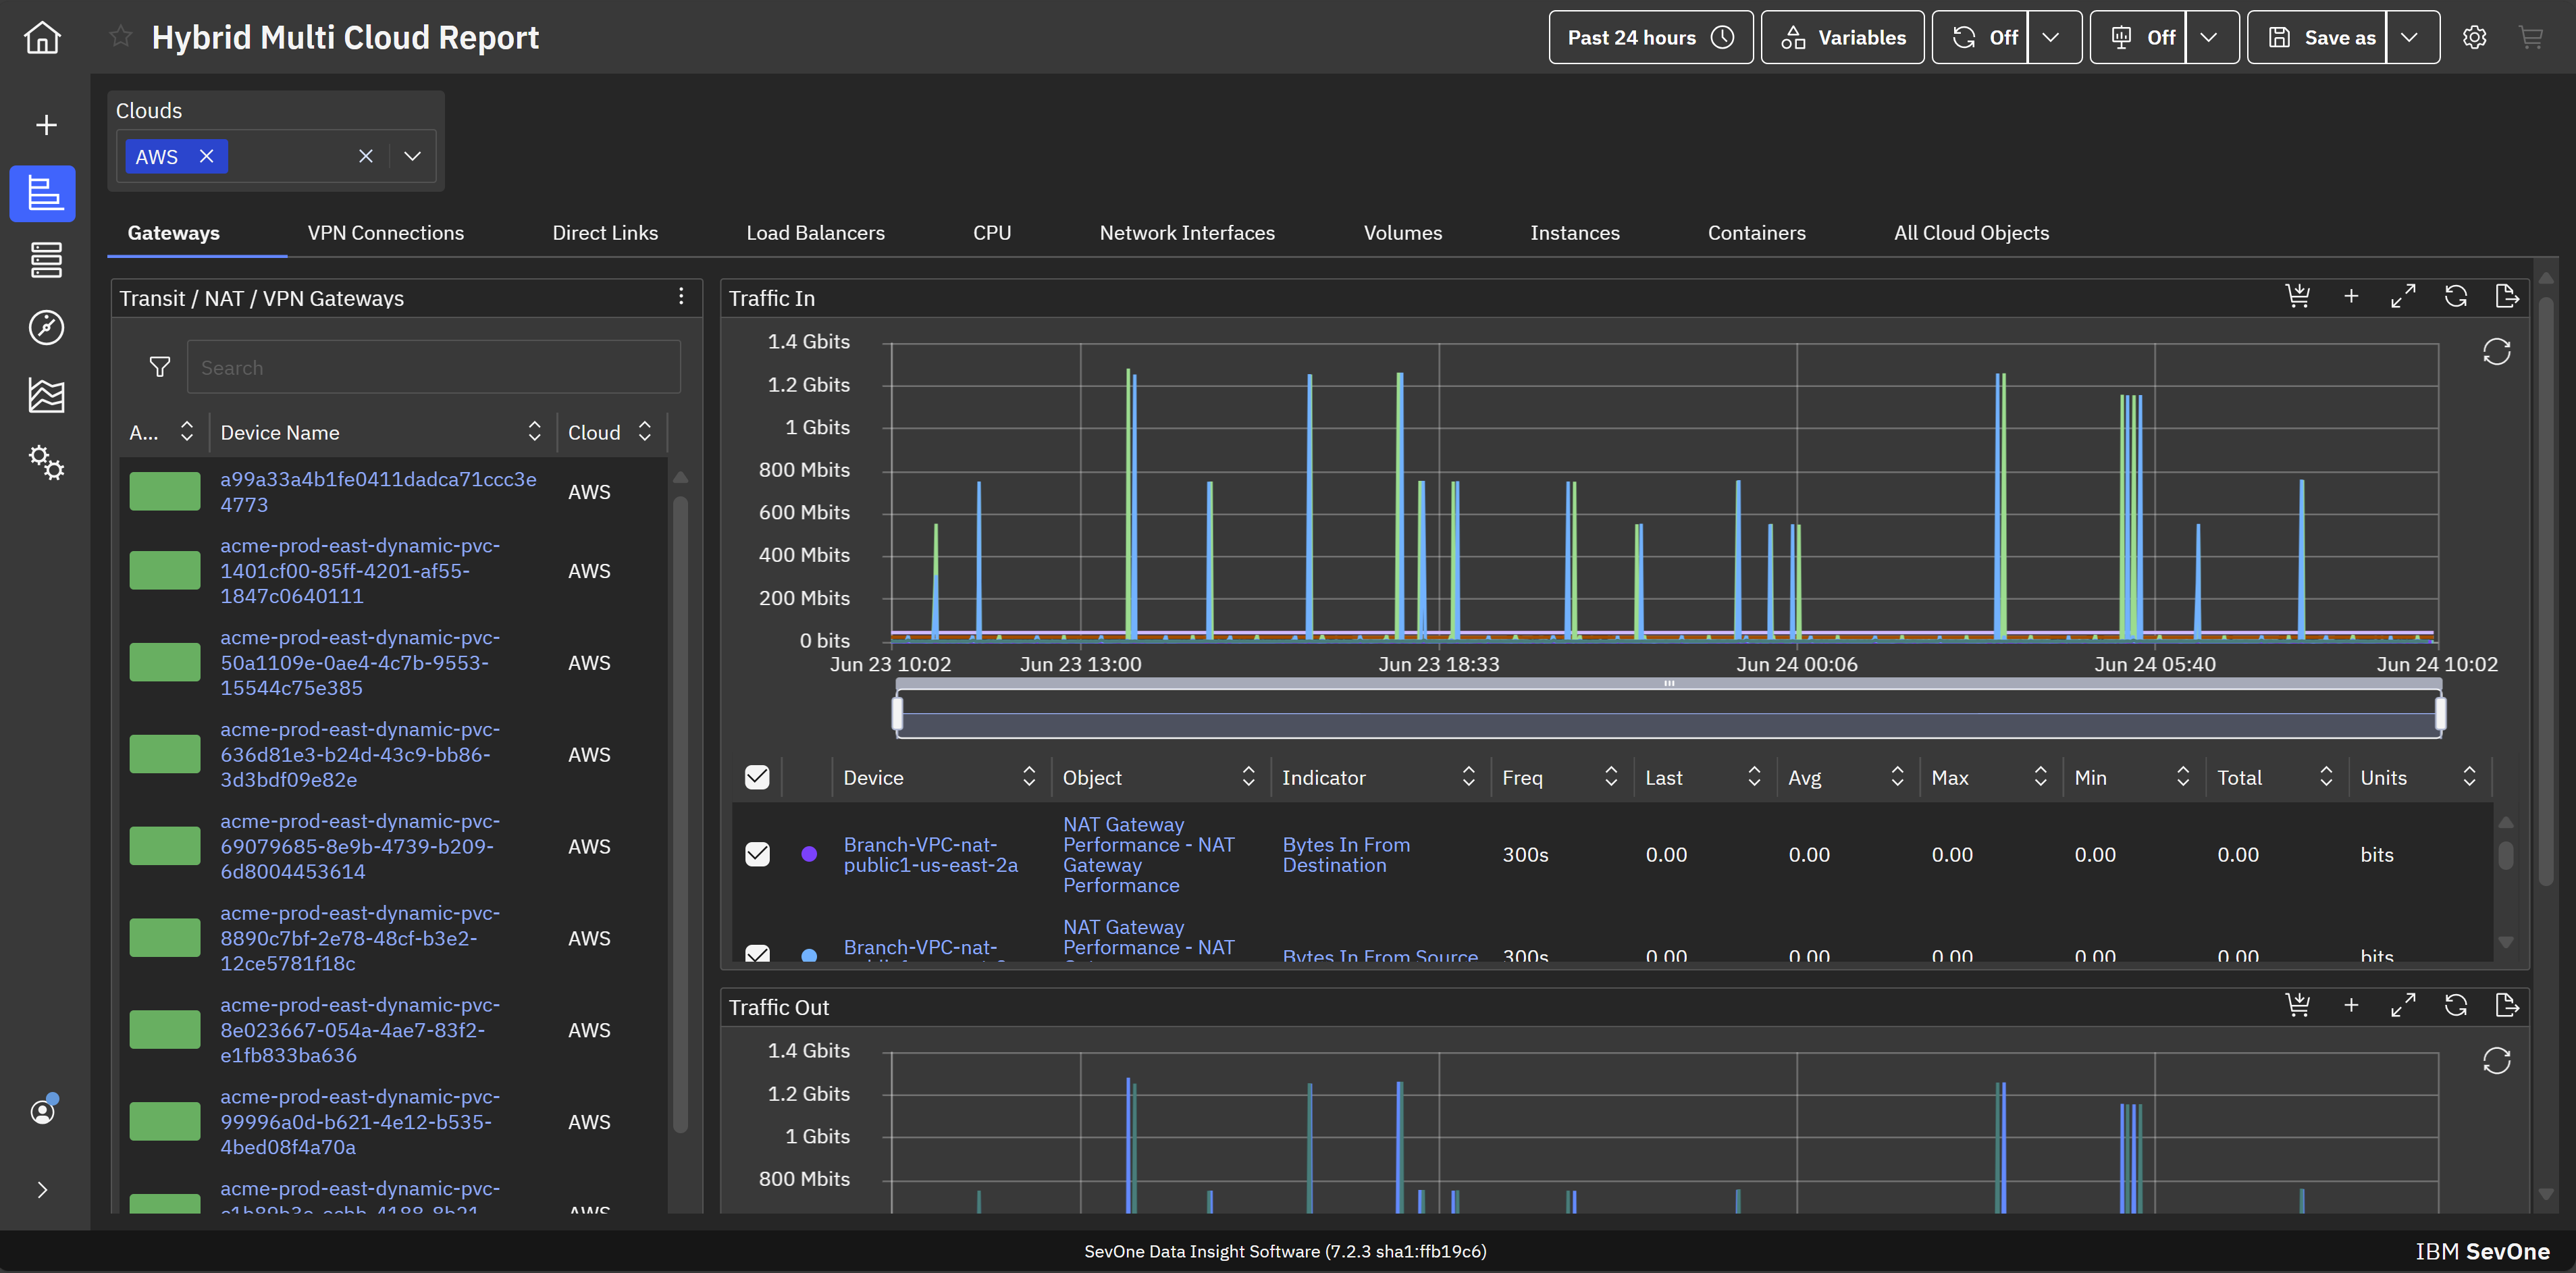
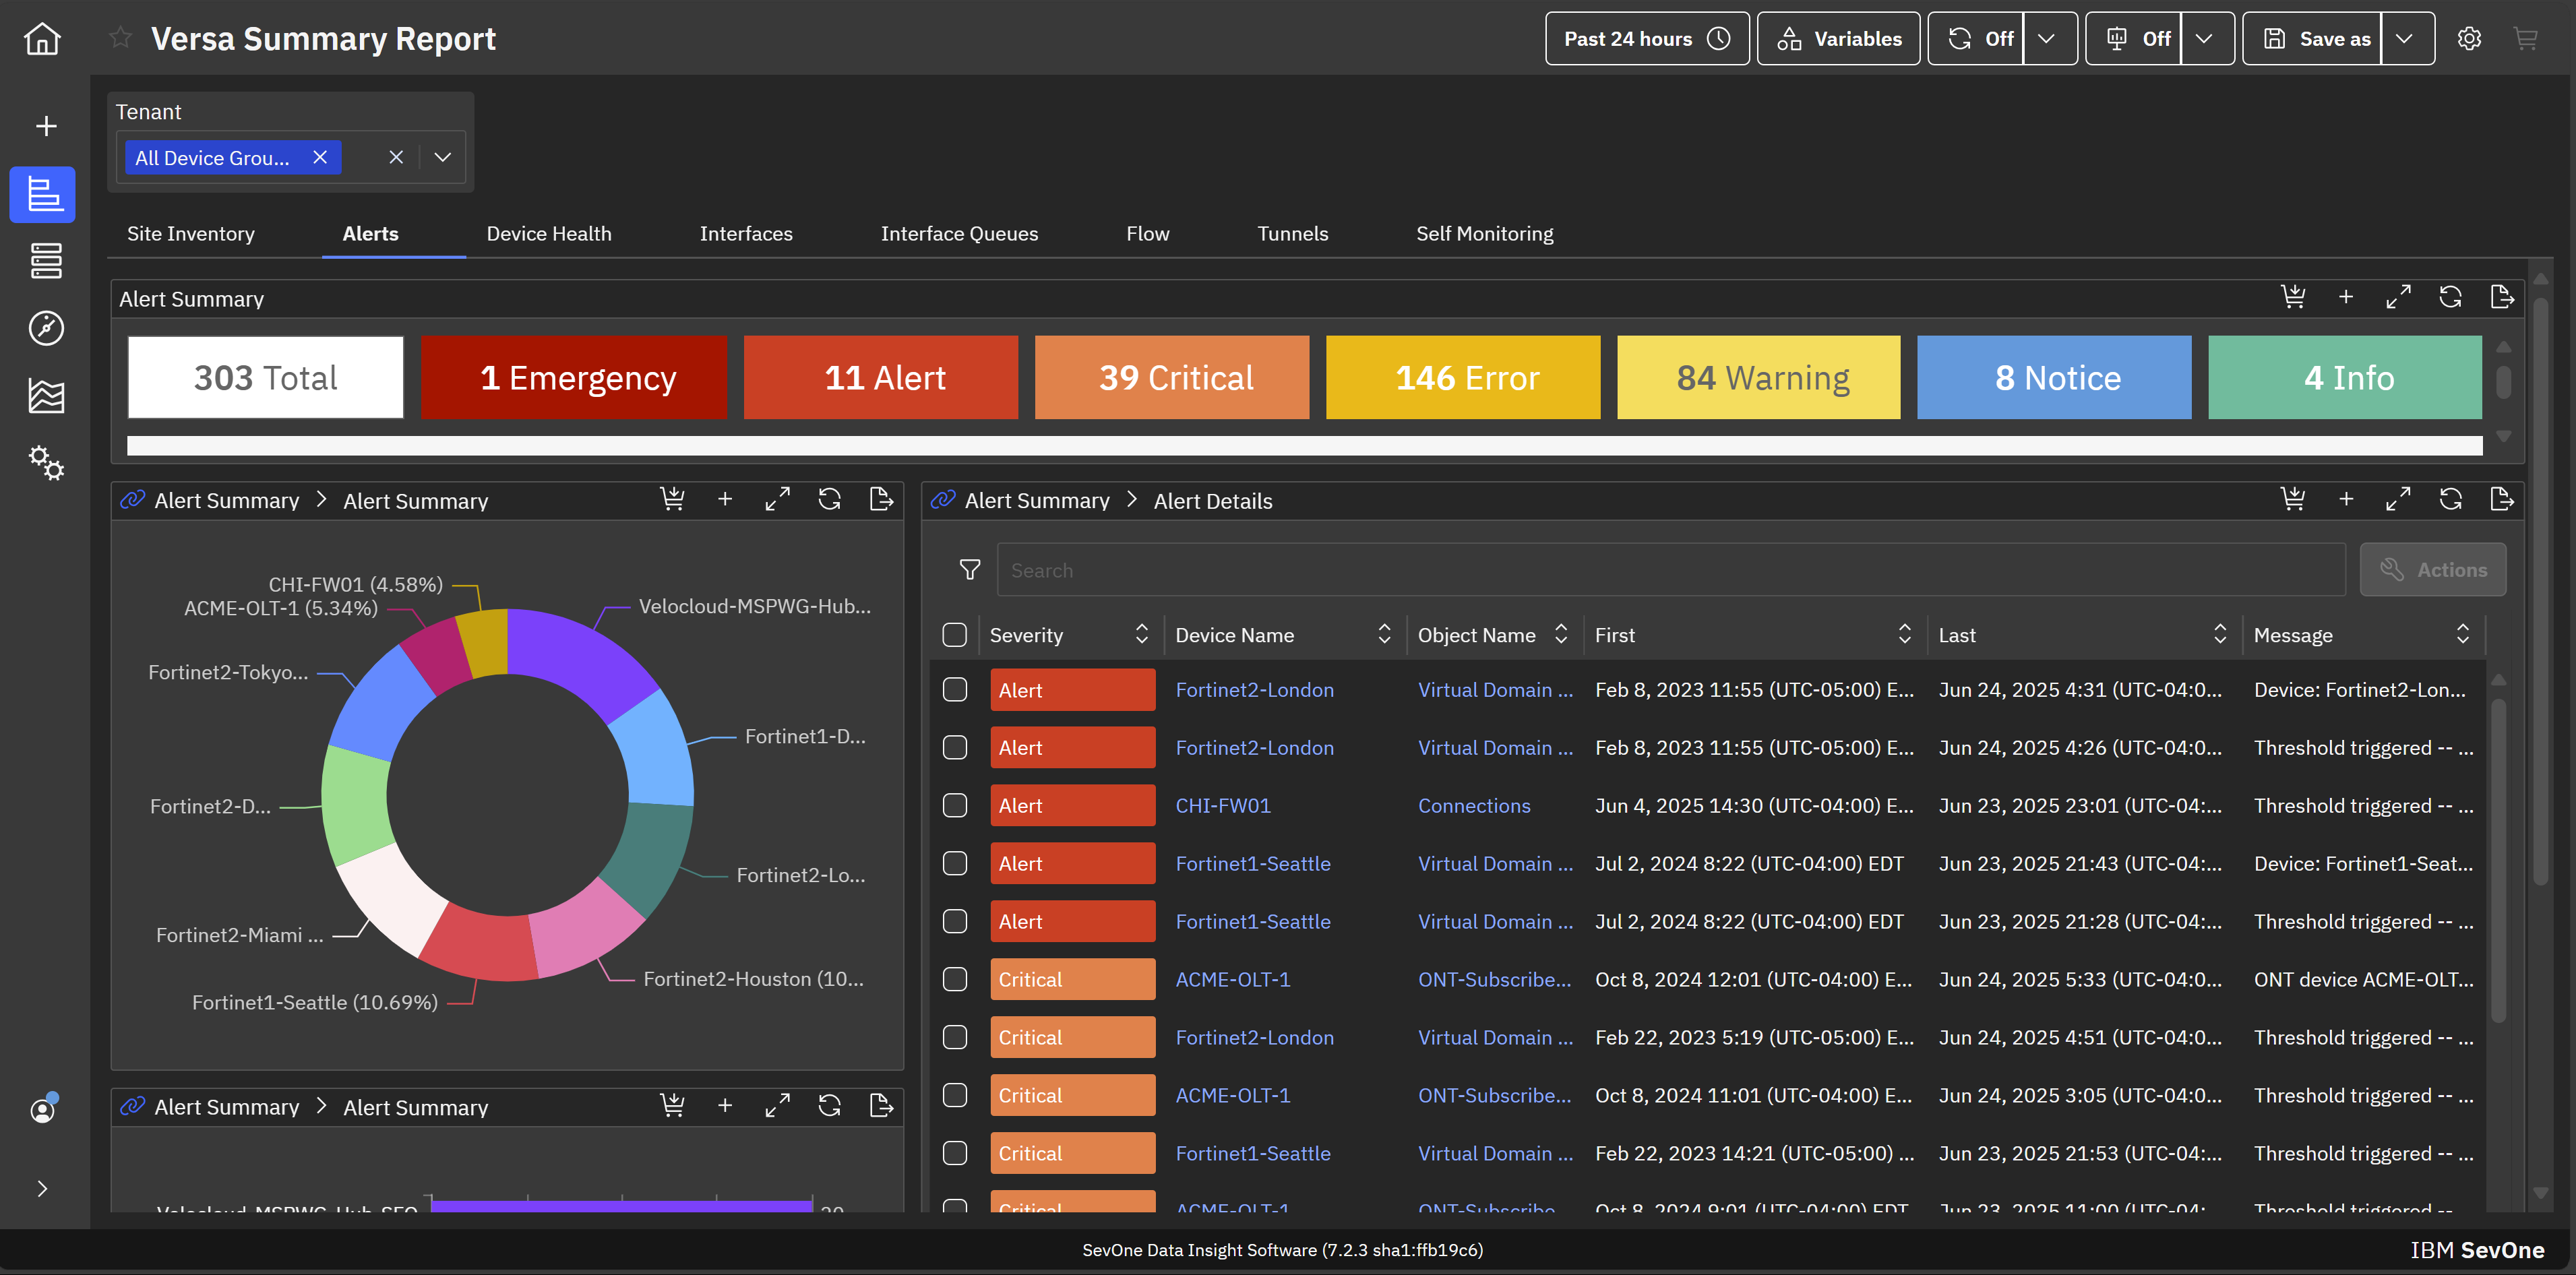
IBM SevOne’s app-centric, hybrid network observability empowers NetOps teams with ML-driven insights, enabling proactive issue prevention and resolution. With a single source of truth for network performance, it delivers visibility to optimize operations and support agility in complex, multi-cloud environments.
N/A
Pricing
Datadog
IBM SevOne
Editions & Modules
Log Management
$1.27
per month (billed annually) per host
Infrastructure
$15.00
per month (billed annually) per host
Standard
$18
per month per host
Enterprise
$27
per month per host
DevSecOps Pro
$27
per month per host
APM
$31.00
per month (billed annually) per host
DevSecOps Enterprise
$41
per month per host
No answers on this topic
Offerings
Pricing Offerings
Datadog
IBM SevOne
Free Trial
Yes
No
Free/Freemium Version
Yes
No
Premium Consulting/Integration Services
No
Yes
Entry-level Setup Fee
Optional
No setup fee
Additional Details
Discount available for annual pricing. Multi-Year/Volume discounts available (500+ hosts/mo).
IBM® SevOne® uses Managed Device (MD) and Managed Client Device (MCD) as pricing metrics. These can be mapped to managed devices for physical, virtualized and containerized functions in the managed environment.
May lack some of the advanced analytics, big-data scale, depth of historical performance, or baseline anomaly detection that SevOne provides. UI / advanced features are less polished. Datadog is strong in cloud-native, full-stack observability; good dashboards; good …
IBM SevOne was selected instead of Datadog because it is perfect for large insurance networks and also connects trouble-free between the on-premise and cloud environments. Its alerts are in real-time, it offers comprehensive dashboards and it allows to gain a better grip on the …
Datadog may be better suited for teams that have a more out-of-the-box infrastructure, on the primary platforms Datadog supports. You may also have better results if you have a bigger team dedicated to devops and/or a bigger budget. We found that trying to adapt it to our use case (small team, .NET on AWS Fargate) wasn't feasible. We continually ran into roadblocks that required us to dig through documentation (and at times, having to figure out some documentation was wrong), go back and forth with support, and in my opinion, waste money on excessive and unintended usages due to opaque pricing models and inaccurate usage reports, as well as broken/non-functional rate sampling controls.
The software is handy and really helps us track all the issues that may occur in our network, allowing us to rectify them before any significant problems with our server can arise. It also enhances the overall performance of all our servers and networks, but, as I mentioned earlier, it will take considerable time for a beginner to become familiar with every feature of the software.
The thing which Datadog does really well, one of them are its broad range of services integrations and features which makes it one step observability solution for all. We can monitor all types of our application, infrastructure, hosts, databases etc with Datadog.
Its custom dashboard feature which helps us to visualize the data in a better way . It supports different types of charts through those charts we can create our dashboard more attractive.
Its AI powered alerting capability though that we can easily identify the root cause and also it has a low noise alerting capability which means it correlated the similar type of issues.
Alert windows cause lag in notifications (e.g. if the alert window is X errors in 1 hour, we won't get alerted until the end of the 1 hour range)
I would appreciate more supportive examples for how to filter and view metrics in the explorer
I would like a more clear interface for metrics that are missing in a time frame, rather than only showing tags/etc. for metrics that were collected within the currently viewed time frame
Documentation for the embedded help pages in NMS and more. In my opinion, these do not provide anything of any depth or maybe anything helpful at all. If anything it just seems to be a guide of what actually exists on the page. It is nicely searchable documentation though.
It is very surprising and disappointing for us to learn that it isn't until the latest version of IBM SevOne that bulk editing was introduced. I think this is such a basic and foundational feature that should have been a part of the original rollout. My team is still trying to configure the REST API.
It was disappointing for the webinar to start with a speaker who had a thick accent and simply read from slides. To me, it felt hopeless until the second speaker, who was engaging and easy to understand. It's as if this fact wasn't considered. I'm sure the first speaker lost a lot of viewers who didn't stick around to discover the 2nd speaker.
I asked three different questions during the webinar and none were answered.
There are so many features that it can be hard to figure out where you need to go for your own use case. For example, RUM monitoring us buried in a "Digital Experience" sidebar setting when this is one of our key use cases that I sometimes struggle to find in the application. It appears that ECS + Fargate monitoring was recently released which is great because we had to build a lambda reporting solution for ephemeral task monitoring. But this new feature was never on my radar until I starting clicking around the application.
The support team usually gets it right. We did have a rather complicate issue setting up monitoring on a domain controller. However, they are usually responsive and helpful over chat. The downside would be I don’t think they have any phone support. If that is important to you this might not be a good fit.
Our logs are very important, and Datadog manages them exceptionally well. We frequently use Datadog services for our investigations. Use case: Monitor your apps, infrastructure, APIs, and user experience.
Key features:
Logs, metrics, and APM (Application Performance Monitoring)
Real-time alerting and dashboards
Supports Kubernetes, AWS, GCP, and other integrations
RUM (Real User Monitoring) and Synthetics
✅ Best for backend, server, and distributed systems monitoring.
IBM SevOne was selected instead of Datadog because it is perfect for large insurance networks and also connects trouble-free between the on-premise and cloud environments. Its alerts are in real-time, it offers comprehensive dashboards and it allows to gain a better grip on the network issues, thus helping to keep the downtime small and the operations well managed thanks to the good communication.