Dynatrace is an APM scaled for enterprises with cloud, on-premise, and hybrid application and SaaS monitoring. Dynatrace uses AI-supported algorithms to provide continual APM self-learning and predictive alerts for proactive issue resolution.
$0
per synthetic request
Redgate Monitor
Score 8.0 out of 10
N/A
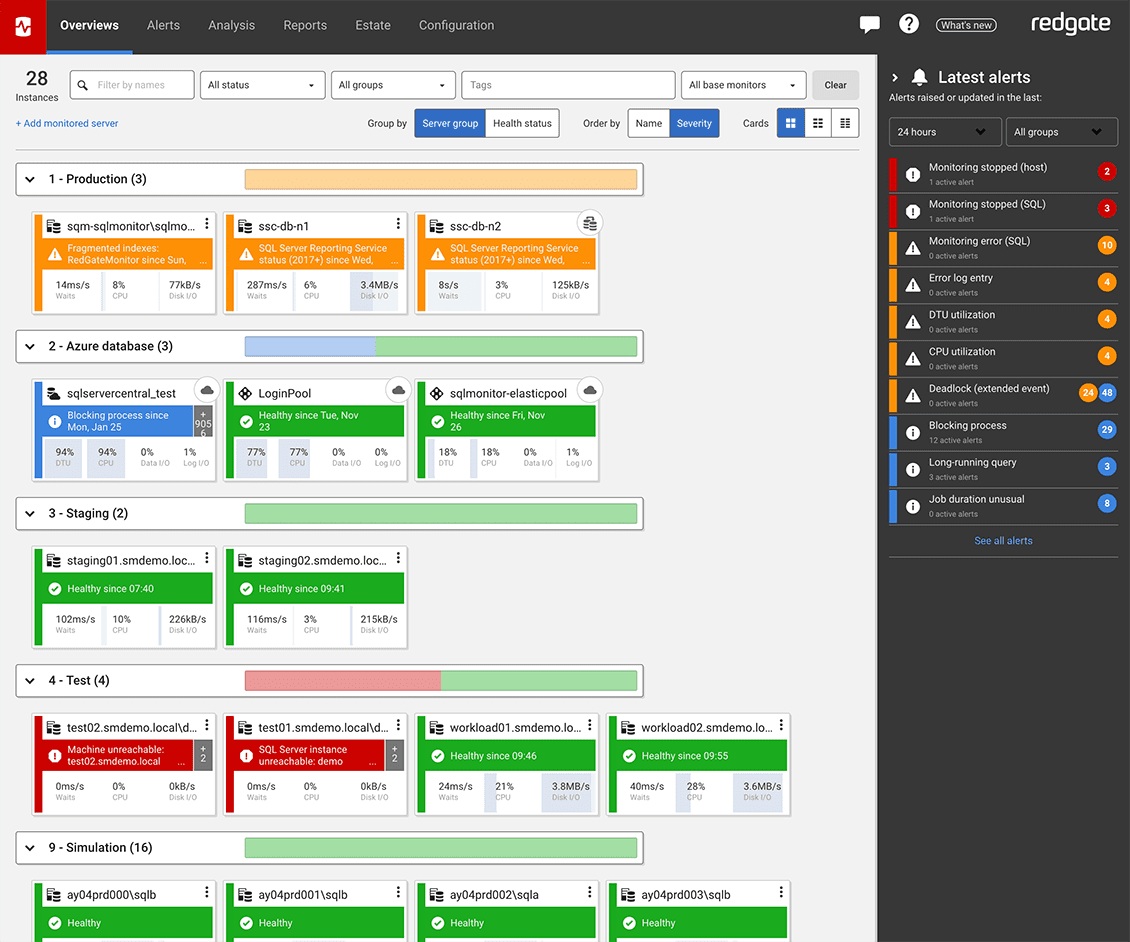
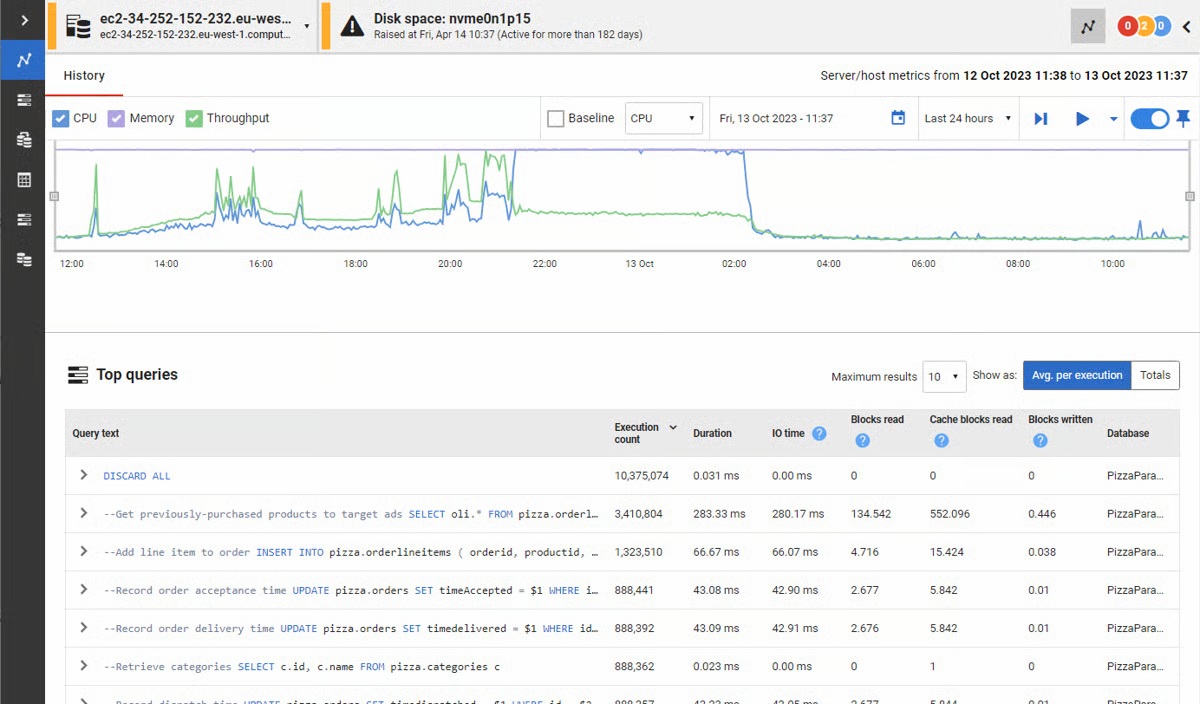
Redgate’s SQL Monitor helps teams looking after SQL servers be more proactive. SQL Monitor enables monitoring environments custom to the user’s SQL server to recognize issues before they impact users. It supports monitoring on-premises and cloud-based servers from a single interface.
$1,164
per year per server
Pricing
Dynatrace
Redgate Monitor
Editions & Modules
Synthetic Monitoring
$0.001
per synthetic request
Kubernetes Platform Monitoring
$0.002
per hour for any size pod
Real User Monitoring
$0.00225
per session
Application Security
$0.018
per hour for 8 GIB host
Infrastructure Monitoring
$0.04
per hour for any size host
Full-Stack Monitoring
$0.08
per hour for 8 GIB host
No answers on this topic
Offerings
Pricing Offerings
Dynatrace
Redgate Monitor
Free Trial
No
Yes
Free/Freemium Version
No
No
Premium Consulting/Integration Services
No
Yes
Entry-level Setup Fee
No setup fee
Optional
Additional Details
—
All prices are per server and include one year’s support and upgrades.
More Pricing Information
Community Pulse
Dynatrace
Redgate Monitor
Considered Both Products
Dynatrace
Verified User
Manager
Chose Dynatrace
SCOM is more a component monitoring tool, whereas Dynatrace's strength is toward application monitoring.
Dynatrace is well suited to a number of tasks. It is important to determine who the end users are and gather good information to tailor their experience accordingly. For instance, business/marketing should not have access to some of the more technical data, and business metrics can be a distraction for IT operations personnel.
With mission-critical SQL Server instances at multiple physical locations and in the cloud, it's critical for us to know immediately when there are performance issues or outages. The Redgate SQL Monitor provides an intuitive dashboard that allows for detailed resource monitoring. Perhaps not as useful in a 100% managed SQL environment.
We loved Dynatrace's ability to show the data flow - from the front end points through the back end points straight to the database and various API's. It was advanced in its data visualization. This is useful for debugging - showing when/where the errors are. It can even enable non-technical individuals in the corporation to help debug
Dynatrace has some great highly customizable integration options as well as monitoring. You can configure your layout & integration options to create custom monitoring alerts for your applications performance. Further you can increase the extensibility of using a REST API on your architecture.
Some advanced dev-ops systems are utilizing Kubernetes/docker aswell as Node.JS - Dynatrace was able to log and help understand all of our dev-ops needs. It gave us native alerts based off of deviations from the baseline that we set during initial configuration. These metrics are priceless.
Dynatrace does not monitor easily on a C-based application.
The way DPGR is addressed by Dynatrace is not very complete, and not clear. One thing is to mask the IP and request attributes but is not enough, the replay session feature is great but raises serious questions about user tracking.
Openness - They are too attached to their Intellectual Property to the detriment of usability, stability and reliability. So once its is installed and working leave it alone. Best run it on a VM as that can be restored quickly for when it breaks.
If they exposed an API/SDK that allowed you to leaver their products life would be far sweeter, it would feel less of a battle.
Add WebHooks to SQL Monitor to enhance integration to other subsystems.
Make it easy to install in default mode. So you are not forced to use TomCat Use as ASP.Core Selfl Hosting options.
We have already renewed our purchase with the company. They make it easy for us to get a temporary license for our contingency site that is only used for testing twice a year. We are expanding our license with for this tool. We find it very useful and will renew it again.
Dynatrace is great to use once you understand how to use it correctly and get used to the layout of it. While I do not actively use it every day, whenever I do use it, I do have to get refamiliarized with it. However, once you have your dashboards setup correctly with the data that you want to see when you first login to Dynatrace, it's amazing.
In general, the Redgate dashboard is one of the most thorough yet intuitive products I've had the pleasure of using. Compared to other vendors in different verticals, the Redgate dashboard's deployment, configuration, monitoring, and reporting is second to none
Given that Dynatrace has become an informal industry standard, the plethora of information available on forums is massive. Most problems or roadblocks you come across are most likely (almost certainly, in fact) already solved and solutions available on these forums. The tech support at Dynatrace is also quite good, with prompt and knowledgeable people at their end.
Synthetic Monitoring automatically does what other products do only through the use of other tools or through the development of user applications that still have a high cost of maintenance. The other products are not immediately usable and require many customizations. Through the use of configuration automatisms, you can be immediately operational and, in our case, we detected several imperfections in the applications.