Flurry Analytics (discontinued) vs. Quantum Metric
Flurry Analytics (discontinued) vs. Quantum Metric
| Product | Rating | Most Used By | Product Summary | Starting Price |
|---|---|---|---|---|
 Flurry Analytics (discontinued) | N/A | Flurry Analytics, from Yahoo / Verizon Media, was a mobile app analytics that let users explore usage, engagement, retention, geographic, demographic, audience and technographic metrics. The product was sunsetted in 2024, and is no longer available. | N/A | |
 Quantum Metric | Enterprise companies (1,001+ employees) | Quantum Metric is designed to help organizations build better digital products faster. Their platform for Continuous Product Design gives business and IT teams a single version of truth which the vendor describes as fast, quantified, and grounded on what customers actually experience. The solution ultimately aims to help teams agree on priorities, build products customers love, and innovate with speed and confidence. | N/A |
| Flurry Analytics (discontinued) | Quantum Metric | |||||||||||||||
|---|---|---|---|---|---|---|---|---|---|---|---|---|---|---|---|---|
| Editions & Modules | No answers on this topic | No answers on this topic | ||||||||||||||
| Offerings |
| |||||||||||||||
| Entry-level Setup Fee | No setup fee | No setup fee | ||||||||||||||
| Additional Details | Flurry is completely free with no hidden fees. Flurry also offers support for integration, set-up and analysis. | — | ||||||||||||||
| More Pricing Information | ||||||||||||||||
| Flurry Analytics (discontinued) | Quantum Metric |
|---|
| Flurry Analytics (discontinued) | Quantum Metric | ||||||||||||||||||
|---|---|---|---|---|---|---|---|---|---|---|---|---|---|---|---|---|---|---|---|
| Mobile Capabilities |
| ||||||||||||||||||
| Results and Analysis |
|
| Flurry Analytics (discontinued) | Quantum Metric | |
|---|---|---|
| Small Businesses |  Firebase Crashlytics Score 9.7 out of 10 |  Smartlook Score 8.7 out of 10 |
| Medium-sized Companies | Firebase Crashlytics Score 9.7 out of 10 |  Contentsquare Score 7.5 out of 10 |
| Enterprises | Firebase Crashlytics Score 9.7 out of 10 | Contentsquare Score 7.5 out of 10 |
| All Alternatives | View all alternatives | View all alternatives |
| Flurry Analytics (discontinued) | Quantum Metric | |
|---|---|---|
| Likelihood to Recommend | 9.0 (6 ratings) | 9.2 (43 ratings) |
| Likelihood to Renew | 3.7 (5 ratings) | 7.5 (2 ratings) |
| Usability | - (0 ratings) | 7.7 (12 ratings) |
| Performance | 10.0 (1 ratings) | - (0 ratings) |
| Support Rating | - (0 ratings) | 8.7 (32 ratings) |
| Implementation Rating | - (0 ratings) | 9.1 (1 ratings) |
| Flurry Analytics (discontinued) | Quantum Metric | |
|---|---|---|
| Likelihood to Recommend |  Discontinued Products
| Quantum Metric
 Khairul Islam Tonmoy Software Developer |
| Pros | Discontinued Products
| Quantum Metric
 Erica D'Aloia Product Manager, Lifestages |
| Cons | Discontinued Products
 Tsahi Tal Co-Founder and COO | Quantum Metric
|
| Likelihood to Renew | Discontinued Products
 Kiran Naiga Product Manager - Mobile | Quantum Metric
 Enrique Membreno Digital Analyst |
| Usability | Discontinued Products No answers on this topic | Quantum Metric
 Salil Chatrath Senior Product Manager |
| Support Rating | Discontinued Products No answers on this topic | Quantum Metric
 Ben Anderson Product Management Intern - Ecommerce Team |
| Alternatives Considered | Discontinued Products
Tsahi Tal Co-Founder and COO | Quantum Metric
 Bill Saffold Manager - Direct To Consumer ecommerce |
| Return on Investment | Discontinued Products
| Quantum Metric
|
| ScreenShots | Quantum Metric Screenshots   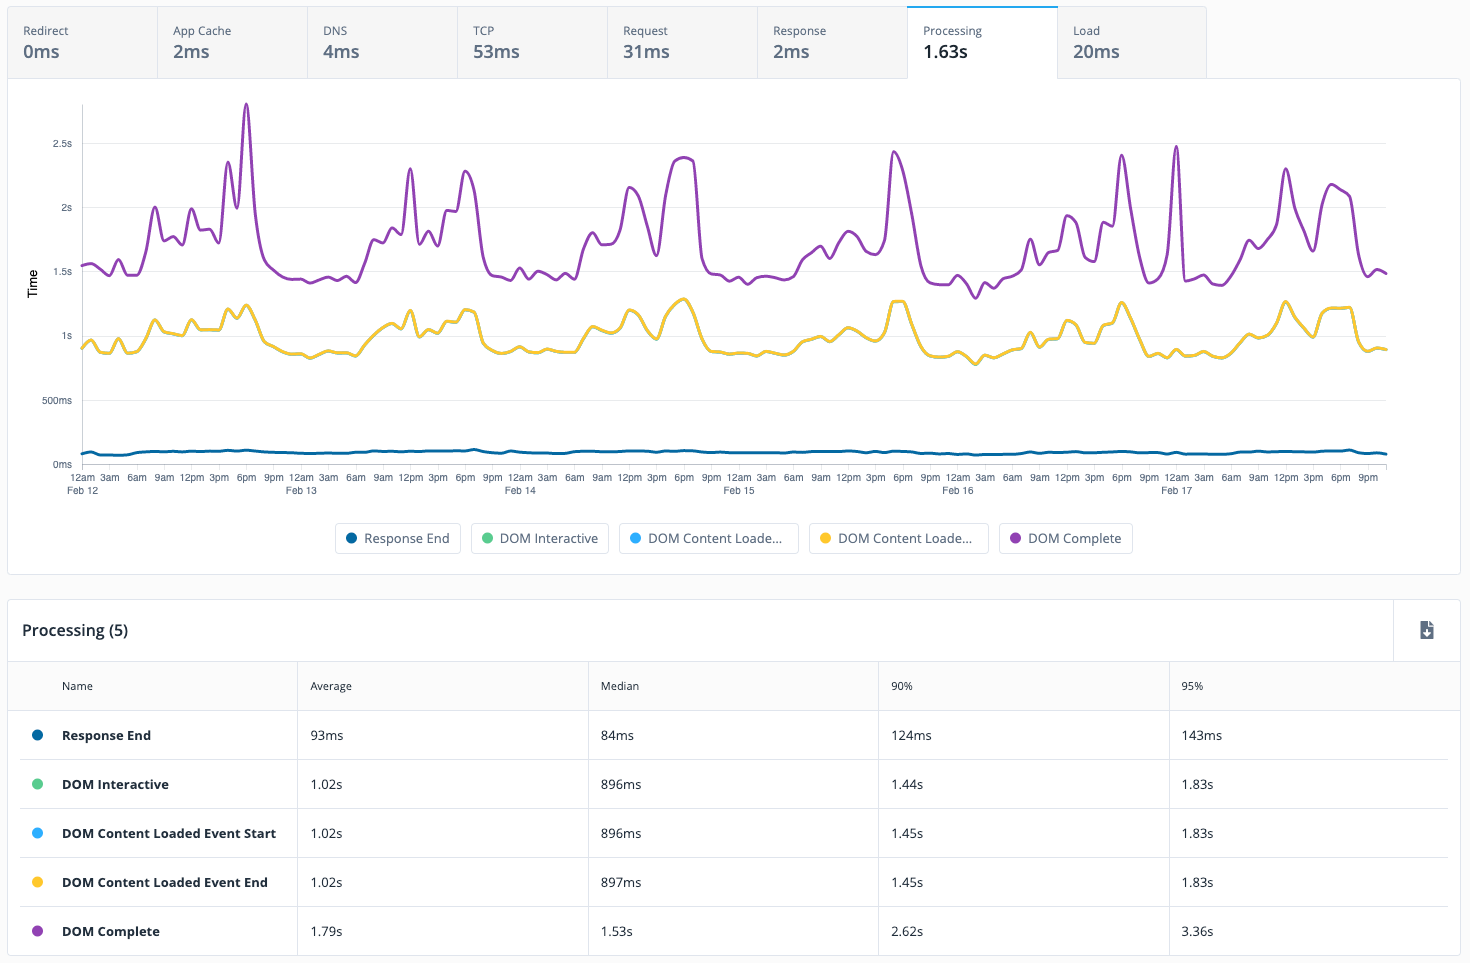 |