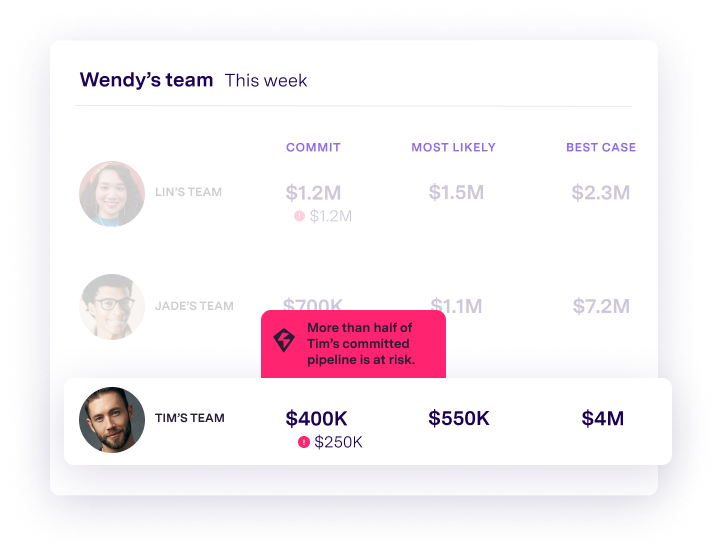
Gong helps people and companies reach their potential. The Gong Revenue Intelligence Platform™ enables customer-facing teams to take advantage of their most valuable assets – customer interactions, which the Gong platform automatically captures and analyzes. Gong then delivers insights at scale, to empower revenue and go-to-market teams to determine the best actions for winning outcomes. The vendor boasts companies like Morningstar Inc., Paychex, LinkedIn,…
N/A
Google Charts
Score 8.2 out of 10
N/A
Google Charts provides a way to visualize data on your website - for free. From simple line charts to complex hierarchical tree maps, the chart gallery provides a large number of ready-to-use chart types. The most common way to use Google Charts is with simple JavaScript that you embed in your web page.
I've never used anything outside of Gong before, but I have heard that chorus is a similar product but also that it doesn't work that well. Gong is the only product I would ever entertain if I were to ever leave this company and have a need for a recording call provider.
We use them for different purposes: one for dialing and one for recording meetings. However, Gong's AI summaries heavily outweigh Dialpad's summaries in accuracy, pulling of key details, and call transcription.
Gong just has far more insightful and accurate information. The other tools integrate well with gong, and would not be able to standalone without Gong as the hub of this.
Hands down, Copilot is no Gong.io. Gong is way ahead of other tools in this space. I like how Gong will recommend next steps, follow-ups, and even set up calendar invites for future meetings. This is why we chose Gong over other tools in this space, and they continue to …
I have used Dialpad, which is another calling log situation that keeps a record and also provides AI summaries. I just think they stack up in the way that they provide similar features and usability for the people who use both platforms.To be fully transparent, I am completely …
Gong has much more robust features like the AI insights for meetings, account briefings, and creating daily to-do's so there is very minimal manual work. It also has a clean interface that is easy to navigate.
I was not the decision maker here. We used Outreach Kaia previously, and its AI functionality and analytics were not as robust. It did not get as comprehensive an account view and was integrated with fewer of our business systems. I know that Gong is expensive, but it's been a …
Granted it has been a couple of years since I have used or evaluated these tools but I feel like with Gong's call recording and insights from that perspective, along with all of the other pieces that it can achieve, it's the obvious choice for sales orgs to be most efficient …
Comparing to Chorus, I believe Gong does a really great job in terms of insights, actionable outcomes, summaries and get great next steps. This is important for all SaaS softwares to work on the product based on the customer feedback. Also, I would like to see Gong as their …
We also use Loom and Gemini: both have call recording and analysis capabilities. Although I like the notes that Gemini takes, I prefer Gong's next steps summary and other functionality. Loom can't be beat when it comes to screen recordings, but I'm not very impressed with the …
It stacks up in a different way. All of these companies try to do some feature that Gong does. Like Call recording, call analysis, AI discovery, Forecasting and Sales Activity tracking. Gong beats most, Otter.ai is a growing competitor though.
I have definitely utilized Gong more than Fireflies or Fathom. The interface feels the easiest to grasp and start getting insights into calls right away.
To be clear, I didn't select Gong, our exec team did. But I like Gong better than Fathom because the interface is better, there isn't a special Gong recording agent that shows up on my zoom calls (better for CX), I love the integration with Hubspot, and the ability to ask the …
In my opinion, Gong outshines Outreach when it comes to conversation intelligence. The summaries are more detailed, the conversational speaker intelligence is more accurate, and the ability to sort calls into specific streams has more functionality than Outreach has exhibited …
In comparison to Microsoft Power BI, Google Charts has more ease of use for businesses who simply need a way to visually display their data from their reports. Although Power BI may be more robust in more complicated data compilation, Google Charts can still be able to do some …
As our company heavily utilizes Google products, when we first looked into the tool to help us to present our data, we were looking if we could find anything that is from Google and can satisfy our basic needs. Google Charts fit in it very well. That does not mean we are not …
Google Charts is free so it was a no brainer for our company to use. There may be other products out there that have more functionality or are easy, but they are not free.
Google Charts is great because it is free. There are not really other options that are out there that offer as much as Google Charts does without the cost, so no other software really stacks up.
I also would like to add Chart.js to the list, although it was not a searchable option. Google Charts is hard to beat, considering how effective it is, and that there's no need for an enterprise subscription. It's got basically any sort of chart or timeline or trend tracker you …
It is a reliable tool and its free version definitely stacks up against a lot of other paid versions of other software. So if you are using anything else, it is definitely worth checking out Google Charts.
Google Charts is better than any other alternative because it is free. It is a bit difficult to customize, so there may be better softwares out there depending on the complexity of what you are trying to do.
Google Charts does offer a lot of functionality and it is also free which is why it is a great choice for our team. We are always looking for free solutions that are out there.
Smartsheet integrates better with JIRA out of the box so we primarily use Smartsheet for visualisation of our Sprint breakdown. However, when reporting to higher-ups, we use Google Charts as the flexibility is far greater. We can better make visualisations that suite our …
Our teams were already using Google's G suite and as google charts simply came tagged along with it, they were more than happy to go with google charts given its capabilities. Though we have another BI solution in place but teams mostly work with google charts and export their …
Google Charts stacks up better since it is free and does not have the constant pressure for cost overruns, add-ons, annual maintenance and implementation services. The speed of using Google Charts is quick, saving users potentially weeks in getting up and going. For the …
Chart.js is another javascript alternative to Google Charts. It outputs charts in Canvas elements rather than SVG, so it's a bit easier to manipulate and make responsive.
I honestly have no used others. This was my first in my field. But I can say it's been a joy to work with and I don't see myself or my organization using any other platform or program.
I've used D3.js and Google Charts, in my opinion, is easier to use and more accessible. But D3.js is much more visually flexible and has a lot of different use cases if we compare it to this service. So I think Google Charts is suitable for dashboards and applications that …
I have not used many other software similar to Google Charts because a lot of the software I have used in the past has integrated reporting available to the customer. However, for instances where our software reporting is not accurate, we are able to use this online source to …
I definitely prefer Google Charts over Piktochart chart because of the way that it integrates with Google Sheets, Google Drive, and Google Docs. The entire G Suite is completely crucial to our operation and having an outside chart program doesn't streamline or make data …
Gong is the perfect, all-in-one tool for Sales reps to be able to succeed. It's my one-stop-shop for updating deals, getting intelligence into the accounts I'm servicing, and for coaching/training myself and others. I could even see its use case extending to CSMs. Maybe a bit less appropriate for non-sales-oriented teams.
Google Charts is perfectly suited for most presentations that are data oriented. There's not much of a limit on the type of table or chart you can create, and being able to integrate with Google Sheets just makes things even easier if you've already got the data stored somewhere. It works well on desktop browsers, Iphones, and Android phones. The only drawback I've been able to find is for those that prefer to have a desktop application.
The history is quite useful in many aspects of my daily work, as I have a complete and detailed view of transcribed calls and email summaries of previously exchanged emails.
It's like an assistant; I can receive email reminders about things discussed during a video call, such as the upcoming date of a scheduled meeting or notes on certain key aspects the client needs for their order.
I can share calls through Gong with my clients. This gives me an added advantage, allowing the client to have reminders or a record of what was discussed without having to worry about manually taking notes.
The interface is complex but easy to learn, has many assistant-like features, and can also be integrated into many calling platforms, such as Zoom.
I would like a couple more introductory videos or a live chat option for when you run into an issue. I think this is a Google-wide problem, not only linked to Google Charts.
I have run into some issues with the Dynamic Data but also admittedly could potentially dive in deeper and investigate.
It would be great if Google Charts made it possible to integrate Google Chat into the platform.
Gong is one of the best if not the best tools we have in or tech stack in terms of ROI and ease of use. The ai features that have been released over the past year have continued to add value and are not just shiny new features that don't get used. It is also an easy to use platform for our sales and customer success reps, takes very little time to become proficient in. The deal boards also provide great visibility into opps for management and leadership
Google Charts is a good product. It's widely supported with deep documentation and a large community. But for me, it wasn't customizable enough. When we started with simple charts, it was great, but as we got deeper and more complex, our needs outgrew the library. If I was going forward, I would choose a more barebones library with more freedom and extensibility.
It does great for all the things I've mentioned. I didn't give it a 10/10 because I still think there is room to improve as far as improving the quality of the insights that are more actionable. I.e. this happened so you should think about doing this thing as a next step.
Requires knowledge of Javascript, which can be difficult for a beginner. A business analyst often isn't as technically minded as a developer so collaboration is often required to produce a correct chart for the purpose required. However, the customisation capable due to this creates much better looking charts compared to other tools.
I give them a 10 because, I have been using Gong for over a year now and have never had issues or concerns go un resolved in a day or two. Their communication is impeccable and their tech support is very hands on and prompt
Google Charts has a very good documentation that we can just go in there and find the stuff we need to implement our solutions on Google Charts. Plus, if we get stuck, we can also email the support and they are very responsive. So overall, the support is very satisfying.
I have used Dialpad, which is another calling log situation that keeps a record and also provides AI summaries. I just think they stack up in the way that they provide similar features and usability for the people who use both platforms.To be fully transparent, I am completely unbiased. I do prefer Gong over Dialpad because it is much more organized. Whenever I try to use Dialpad, it opens 50 tabs to get to one thing, and it's confusing
In comparison to Microsoft Power BI, Google Charts has more ease of use for businesses who simply need a way to visually display their data from their reports. Although Power BI may be more robust in more complicated data compilation, Google Charts can still be able to do some of the basics that Power BI delivers.
Time savings. Historically, I had Google Doc note sheets for each client, and it was incredibly time-consuming. With Gong, I let the tool take the notes and help with customer follow ups.
Increased collaboration. Rather than sharing notes and meeting, I can send a Gong recording or clip of the conversation that is specific to the business unit I'm working with. This also saves time.
Increased visibility into our customer accounts. We have quarterly account reviews and have been tasked with making account plans for every customer. Using Gong and Claude, this is done in seconds as opposed to hours.
Better accountability. It also is a system of truth and the recorded conversations hold resources accountable.
Improved conversations, the coaching ability helps us understand how we can improve in our meetings and is good training for objective handling.