IBM Cognos is a full-featured business intelligence suite by IBM, designed for larger deployments. It comprises Query Studio, Reporting Studio, Analysis Studio and Event Studio, and Cognos Administration along with tools for Microsoft Office integration, full-text search, and dashboards.
$11.25
per month per user
Jama Analyze (Discontinued)
Score 8.0 out of 10
Mid-Size Companies (51-1,000 employees)
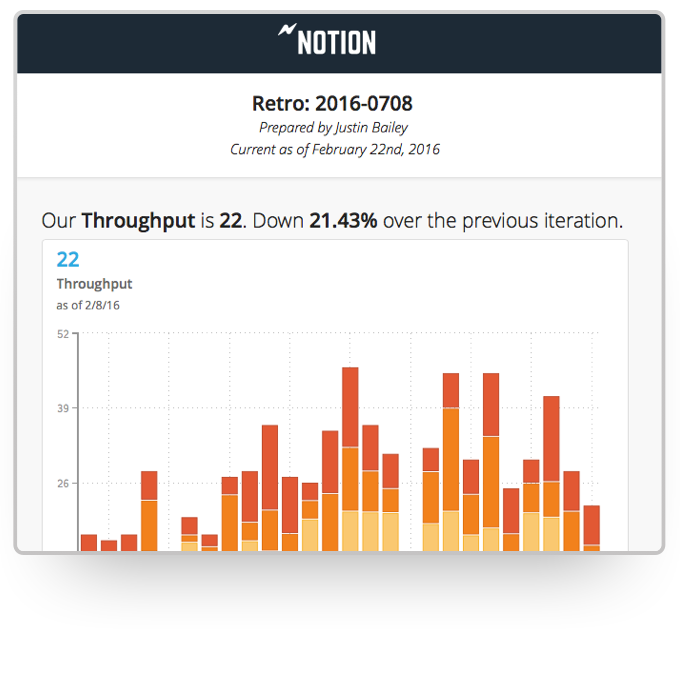
Jama Analyze (formerly called Notion) was a solution for quickly creating shareable, custom dashboards. However, the product is no longer available. Jama Software sunset the Analyze product in 2019. Some of the benefits of Jama Analyze included the ability to: Create custom metrics across all teams with data from any source with the intuitive metric builder. Experience self-serve BI with no coding and no IT to get started making custom dashboards.…
Well suited: Financial reporting - It can handle complex, pixel perfect, muti-page reports with scheduled delivery to stakeholders (like sales report by region on quarterly periodicity) Operational dashboard across departments - It can combine multiple data sources (ERP, CRM, excels etc) with filters, and embedded AI insights Less appropriate: Live dashboards - As stated earlier as well, IBM Cognos Analytics doesn't suit well for live dashboards or event driven data. For ex: live web traffic data or IOT device data, etc Data science - Although IBM Cognos Analytics is great tool for data exploration but it should not be used as a substitute for Python or R, which has edge over advanced modelling and stats based workflows like predictive modelling or clustering
The integration with JIRA is quite a handy tool to have. It allows for team progress to be easily tracked and visualized using the software while key metrics are brought to the forefront through the software's business intelligence. It makes presenting data and milestones achieved to non-technical management quite simple and can be extremely useful.
This allows us to keep track of our team's work by integrating with our product boards on JIRA.
It allows us to create visualized reports for our team's progress.
It allows us to gain insights about things that are going well in our product pipeline as well as potential areas of concern based on the data that is collected.
IBM Cognos Analytics enables customer data segmentation, which is essential for marketing, improving and streamlining purchasing behavior and preferences. This helps companies create more targeted and effective marketing campaigns.
Our clients Through data analysis, we can identify and observe trends in the behavior of other clients, allowing us to anticipate needs and adjust strategies to avoid consequences.
For an existing solution, renewing licenses does provide a good return on investment. Additionally, while rolling out scorecards and dashboards with little adhoc capabilities, to end users, cognos is very easily scalable. It also allows to create a solution that has a mix of OLAP and relational data-sources, which is a limitation with other tools. Synchronizing with existing security setup is easy too.
We have a strong user base (3500 users) that are highly utilizing this tool. Basic users are able to consume content within the applied security model. We have a set of advanced users that really push the limits of Cognos with Report and Query Studio. These users have created a lot of personal content and stored it in 'My Reports'. Users enjoy this flexibility.
Reports can typically be viewed through any browser that can access the server, so the availability is ultimately up to what the company utilizing it is comfortable with allowing, though report development tends to be more picky about browsers and settings as mentioned above. It also has an optional iPad app and general mobile browsing support, but dashboards lack the mobile compatibility. What keeps it from getting a higher score is the desktop tools that are vital to the development process. The compatibility with only Windows when the server has a wide range of compatibility can be a real sore point for a company that outfits its employees exclusively with Mac or Linux machines. Of course, if they are planning on outsourcing the development anyways, it's a rather moot point
Overall no major complaints but it doesn't handle DMR (Dimensionally Modeled for Relational) very well. DMR modelling is a capability that IBM Cognos Framework Manager provides allowing you to specify dimensional information for relational metadata and allows for OLAP-style queries. However, the capability is not very efficient and, for example, if I'm using only 2 columns on a 20-column model, the software is not smart enough to exclude 18 columns and the query side gets progressively larger and larger until it's effectively unusable.
Why is their web application not working as fast as you think it should? They never know, and it is always a a bunch of shots in the dark to find out. Trying to download software from them is like trying to find a book at the library before computers were invented.
Onsite training provided by IBM Cognos was effective and as expected. They did not perform training with our data which was a bit difficult for our end-users.
The online courses they offer are thorough and presented in such a way that someone who isn't already familiar with the general design methodologies used in this field will be capable of making a good design. The training environments are provided as a fully self contained virtual machine with everything needed already to create the environments. We've had some persisting issues with the environments becoming unavailable, but support has been responsive when these issues arise and straightening them out for us
Make sure that any custom tables that you have, are built into your metadata packages. You can still access them via SQL queries in Cognos, but it is much easier to have them as a part of the available metadata packages.
Power BI is stronger for quick ad-hoc analysis and dashboards, but IBM Cognos Analytics is better when consistency, precision, and mass distribution matter. Tableau is best for interactive analysis, while IBM Cognos Analytics is better for standardized, repeatable enterprise reporting. Sigma shines for customizable dashboards and drill-down analysis while IBM Cognos Analytics holds an edge in data discovery and visualization.
Jama Analyze, as well as Asana, connect with JIRA to visualize milestone tracking and team progress. While Asana is cheaper, Jama Analyze provides better reports and visual data. Google Data Studio, through a bit of tinkering from your software development team, can achieve similar results, however, the charts and graphs leave a bit to be desired in terms of design. In all, Jama Analyze is great if you have few users and don't need to go for the licensing option. Otherwise, there are definitely cheaper options available but you may have to sacrifice on performance and look-and-feel.
The Cognos architecture is well suited for scalability. However, the architecture must be designed with scalability in mind from day one of the implementation. We recently upgraded from 10.1 to 10.2.1 and took the opportunity to revamp our architecture. It is now poised for future growth and scalability.