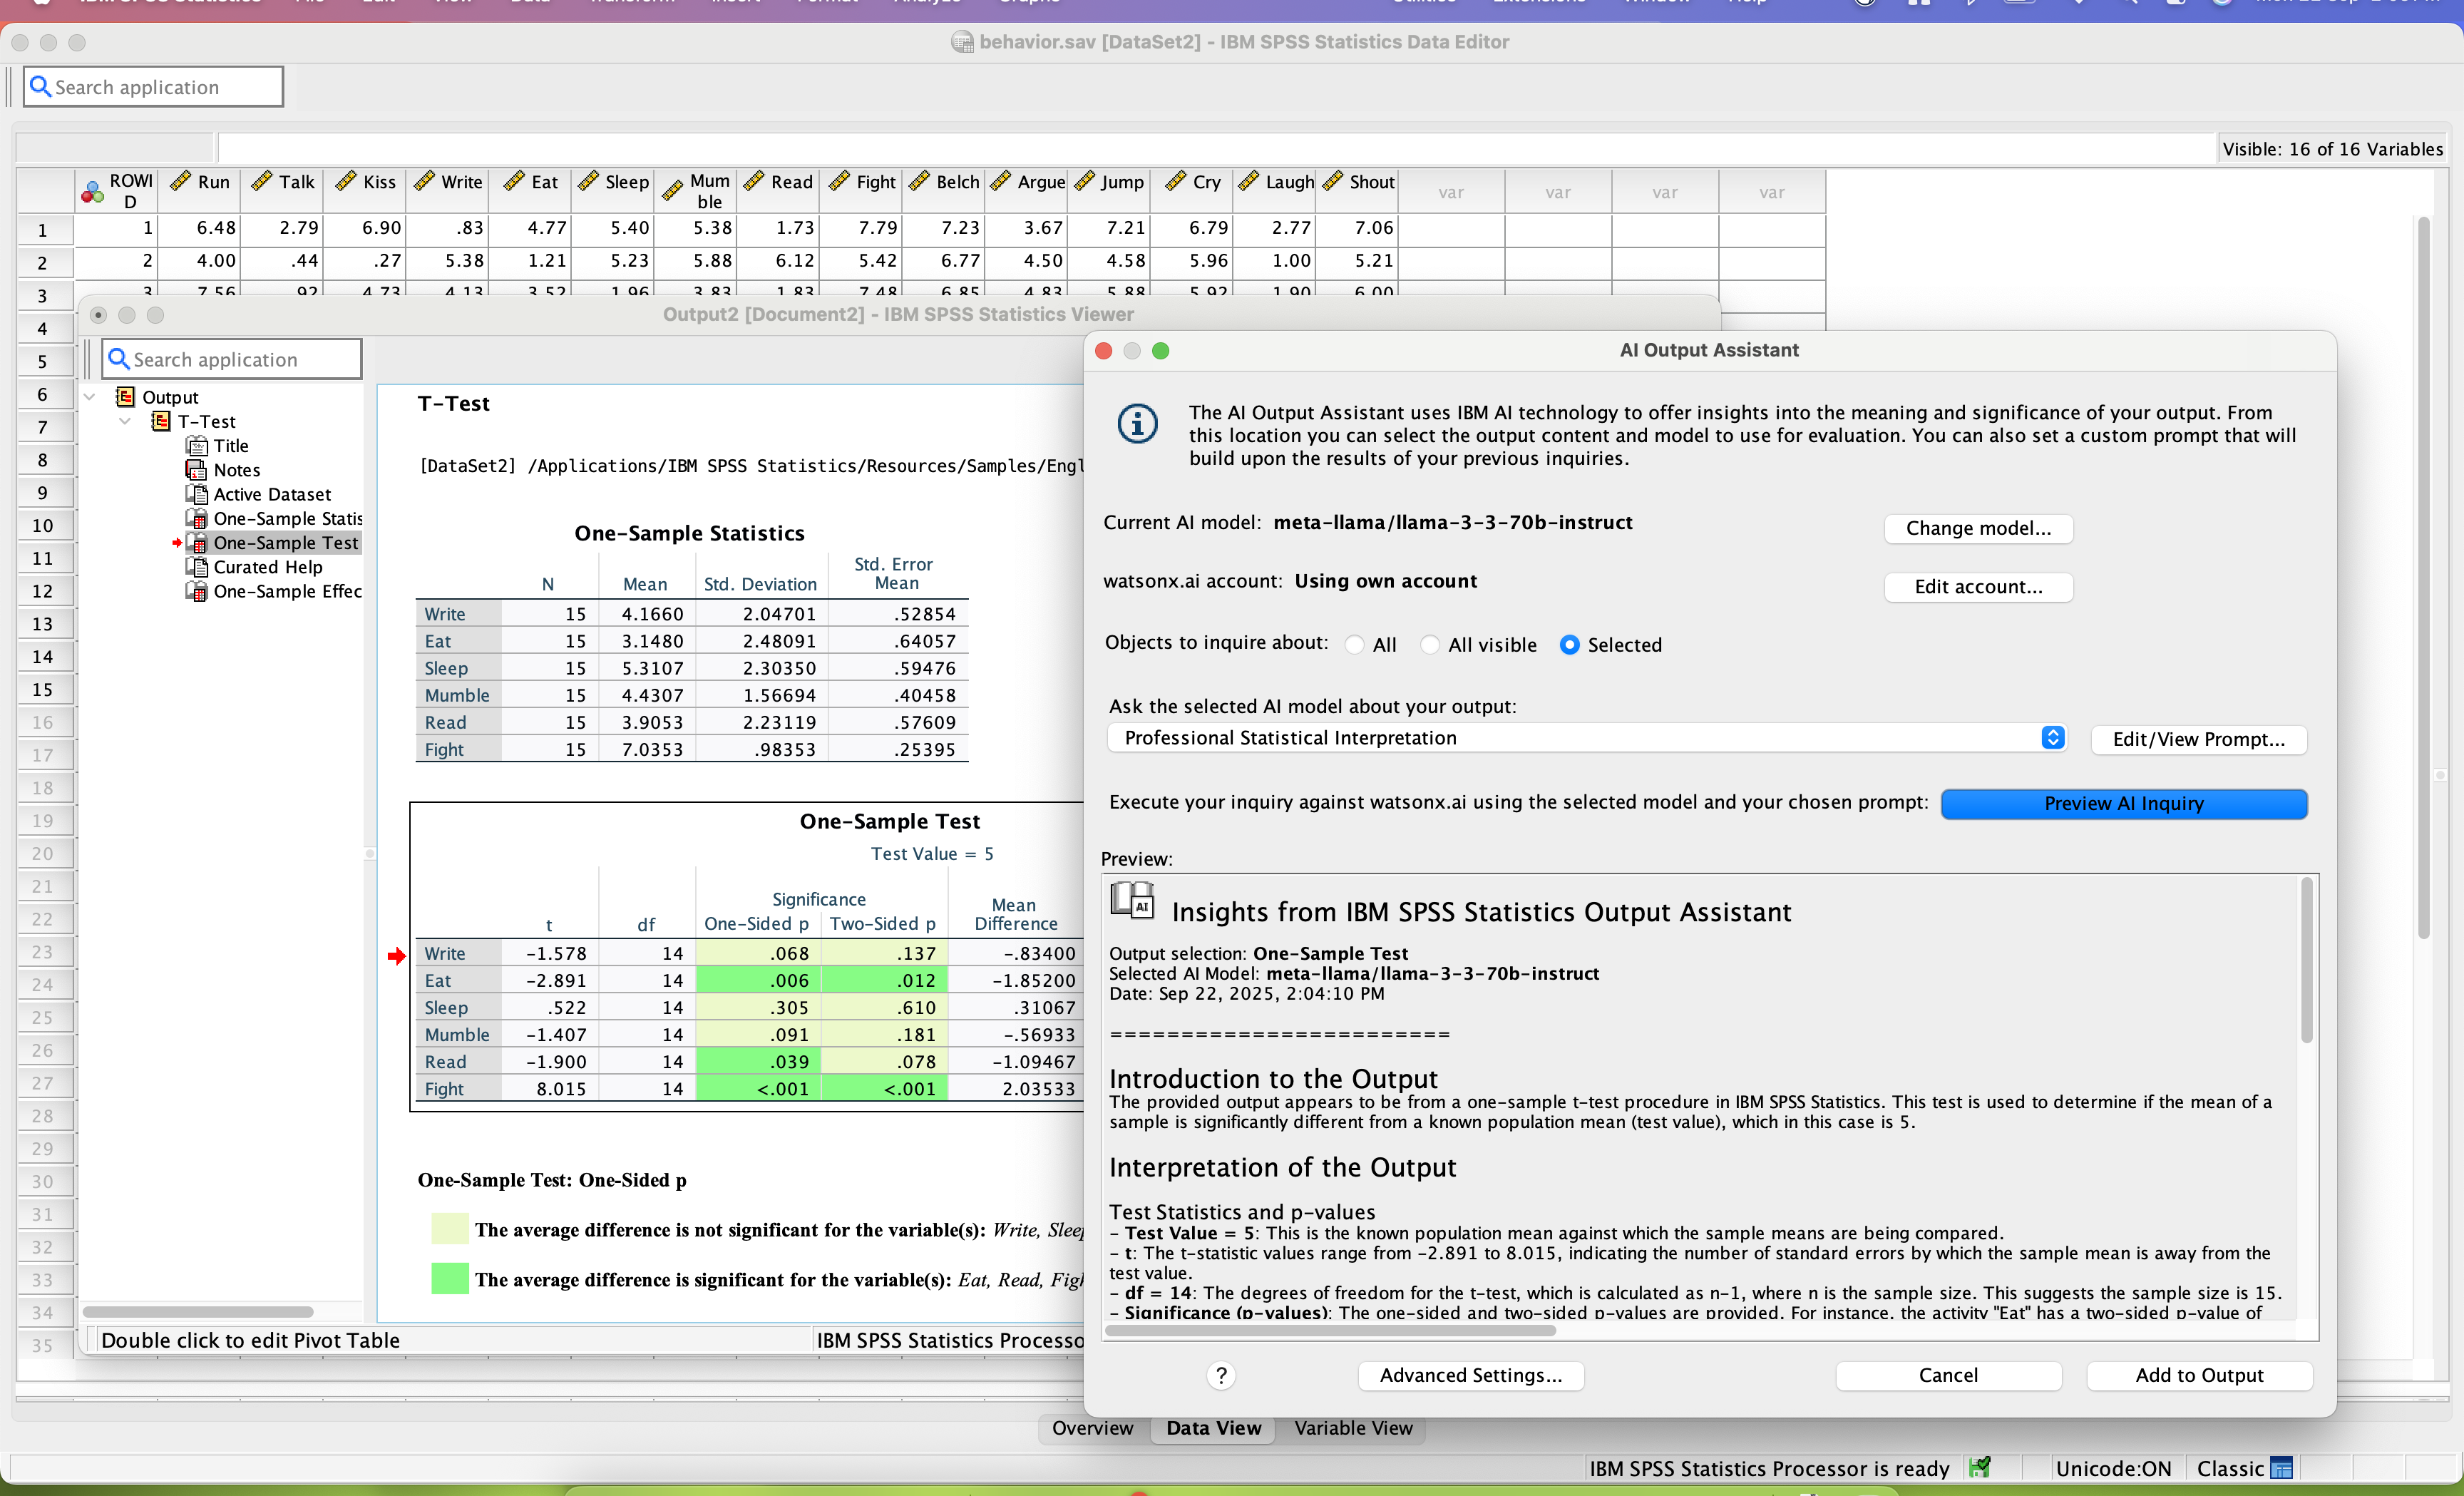
SPSS Statistics is a software package used for statistical analysis. It is now officially named "IBM SPSS Statistics". Companion products in the same family are used for survey authoring and deployment (IBM SPSS Data Collection), data mining (IBM SPSS Modeler), text analytics, and collaboration and deployment (batch and automated scoring services).
$105
per month per user
Tableau Desktop
Score8.6 out of 10
N/A
Tableau Desktop is a data visualization product from Tableau. It connects to a variety of data sources for combining disparate data sources without coding. It provides tools for discovering patterns and insights, data calculations, forecasts, and statistical summaries and visual storytelling.
$1,380
per year (purchased via a Creator license)
Tableau Public
Score9.9 out of 10
N/A
Tableau Public is a free edition of the Desktop product. With this edition, data can only be published to the Tableau public website and does not allow work to be saved or exported locally.
$0
per month
Pricing
IBM SPSS Statistics
Tableau Desktop
Tableau Public
Editions & Modules
Base
USD 3,830
one-time fee per user
Standard
USD 8,440
one-time fee per user
Professional
USD 16,900
one-time fee per user
Premium
USD 25,200
one-time fee per user
Monthly subscription
USD 105
per month per user
Annual subscription
USD 1,188.00
per year per user
Tableau Creator License
$115
per month (billed annually) per user
No answers on this topic
Offerings
Pricing Offerings
IBM SPSS Statistics
Tableau Desktop
Tableau Public
Free Trial
Yes
No
No
Free/Freemium Version
No
Yes
Yes
Premium Consulting/Integration Services
No
Yes
No
Entry-level Setup Fee
No setup fee
No setup fee
No setup fee
Additional Details
—
All pricing plans are billed annually. A Creator license includes Tableau Desktop, Tableau Prep Builder, and Tableau Pulse. Discounts sometimes available for volume.
I also use or have used Tableau, Excel, and R (wasn’t able to list R above). Tableau is better for visualizations, Excel works for generalized/more basic statistical analysis but lacks more complex features, and R has been difficult for me to master and lacks the UI and ease of …
A de minimis incentive was given to thank the reviewer for their time. The incentive was not used to bias or drive a particular response, nor was the incentive contingent on a positive endorsement. TR verified that a representative sample of customers was invited. More Info
Verified User
Chose IBM SPSS Statistics
If I didn't want to code, IBM SPSS would be after JMP and Tableau, and before SAS and R. The user interface is very clunky compared to the analytics software I stated. You could definitely learn to do basic analysis faster in SAS than SPSS. I selected SPSS to test the …
A de minimis incentive was given to thank the reviewer for their time. The incentive was not used to bias or drive a particular response, nor was the incentive contingent on a positive endorsement. More Info
Verified User
Chose IBM SPSS Statistics
Compared to Stata, python and MPlus, SPSS is more user friendly especially for beginners. It displays data and output in easily readable formats and makes statistics fun and easy. However, Stata, python and MPlus are more ideal for complex statistical methods like structural …
A de minimis incentive was given to thank the reviewer for their time. The incentive was not used to bias or drive a particular response, nor was the incentive contingent on a positive endorsement. TR verified that a representative sample of customers was invited. More Info
A de minimis incentive was given to thank the reviewer for their time. The incentive was not used to bias or drive a particular response, nor was the incentive contingent on a positive endorsement. More Info
Technical Project Manager in Information Technology at California State University, Northridge (Education Management, 1001-5000 employees)
Chose IBM SPSS Statistics
Two alternatives I considered before choosing SPSS are the programming languages R and Julia Statistics. Both are freely available, open-source packages for sophisticated statistical analysis and visualization. In my case, I preferred SPSS to these somewhat newer options due …
A de minimis incentive was given to thank the reviewer for their time. The incentive was not used to bias or drive a particular response, nor was the incentive contingent on a positive endorsement. More Info
Verified User
Chose IBM SPSS Statistics
SAS is more sophisticated and can be made more streamlined with SQL. SPSS has easier and user friendlier user experiences.
A de minimis incentive was given to thank the reviewer for their time. The incentive was not used to bias or drive a particular response, nor was the incentive contingent on a positive endorsement. More Info
Analista in Engineering at Constructora Conkor, C.A. (Construction, 51-200 employees)
Chose IBM SPSS Statistics
Select IBM SPSS because it is a program that is easier to use than RStudio [which] requires the application of much more work hours to master and make the most of each of the tools it offers.
A de minimis incentive was given to thank the reviewer for their time. The incentive was not used to bias or drive a particular response, nor was the incentive contingent on a positive endorsement. More Info
Market Research Principal in Marketing at Hussmann (Supermarkets, 1001-5000 employees)
Chose IBM SPSS Statistics
I have used SAS, R, Systat, Stata, Excel, Access and I continually find myself using SPSS to do the same set of tasks I would be using the previously named software to do. It's an all encompassing software that is very easy to use but can become as powerful an analytical tool …
A de minimis incentive was given to thank the reviewer for their time. The incentive was not used to bias or drive a particular response, nor was the incentive contingent on a positive endorsement. More Info
Senior Director, Management Analysis in Finance and Accounting at Arizona State University (Higher Education, 10,001+ employees)
Chose IBM SPSS Statistics
I use Stata for tasks that SPSS cannot support, but ultimately SPSS has a short learning curve, strong statistical processing, and a mature tool set. SAS is also mature, but more programming based. JMP tries to 2nd guess what I need. NOTE: R (open source) is a great option …
A de minimis incentive was given to thank the reviewer for their time. The incentive was not used to bias or drive a particular response, nor was the incentive contingent on a positive endorsement. More Info
Verified User
Chose IBM SPSS Statistics
SPSS is enormously broad-featured. They just do a lot of analysis that is beyond the capabilities of even the best survey research platforms.
A de minimis incentive was given to thank the reviewer for their time. The incentive was not used to bias or drive a particular response, nor was the incentive contingent on a positive endorsement. More Info
Business Intelligence Intern in Marketing at Foresight ROI, Inc (Market Research, 11-50 employees)
Chose IBM SPSS Statistics
Graphics within SPSS provide you with a general framework for understanding your data, so that you will be better able to interpret the complex inferential procedures that follow.
A de minimis incentive was given to thank the reviewer for their time. The incentive was not used to bias or drive a particular response, nor was the incentive contingent on a positive endorsement. More Info
Tableau
Verified User
Chose Tableau Desktop
The online and public versions are only good for the hobbyist because they are not secure enough for most business applications. Dapresy is a marketing tool that is supposed to give executives a snapshot of marketing results. It's not very customizable and the results are …
A de minimis incentive was given to thank the reviewer for their time. The incentive was not used to bias or drive a particular response, nor was the incentive contingent on a positive endorsement. More Info
Verified User
Chose Tableau Desktop
I feel like Tableau is easier to use and offers a greater selection of visualizations. I feel that the dashboards are easier to put together and offer a great amount of flexibility for the end-user. Tableau has an excellent user support group. I find the community to be …
A de minimis incentive was given to thank the reviewer for their time. The incentive was not used to bias or drive a particular response, nor was the incentive contingent on a positive endorsement. More Info
Fellow in Research & Development at Georgia Institute of Technology (Higher Education, 5001-10,000 employees)
Chose Tableau Desktop
Tableau is more powerful than Excel. One does have more flexibility by using programming libraries like D3.js, which have been designed specifically for data visualization, but they also require the user to know how to program with javascript. Tableau is great for users who …
A de minimis incentive was given to thank the reviewer for their time. The incentive was not used to bias or drive a particular response, nor was the incentive contingent on a positive endorsement. More Info
Verified User
Chose Tableau Desktop
It is easier to start with Tableau. The out of the box ready feel is more with Tableau than any of the other BI products. Product scalability is at a steep cost with Tableau but it gives the possibility to begin small and then grow as it proves its capability as compared to all …
A de minimis incentive was given to thank the reviewer for their time. The incentive was not used to bias or drive a particular response, nor was the incentive contingent on a positive endorsement. More Info
Verified User
Chose Tableau Desktop
Python is programming tools, while Tableau is an easy to use drag and drop data visualization tool. This may not be an apple to apple comparison. Compared to Excel, Tableua is way over the top when it comes to data visualization.
A de minimis incentive was given to thank the reviewer for their time. The incentive was not used to bias or drive a particular response, nor was the incentive contingent on a positive endorsement. More Info
Renowned digital analytics consultant, innovator, speaker, thought leader in Marketing at (self employed) (Internet, 1-10 employees)
Chose Tableau Desktop
I haven't used other tools for a number of years - when I made the selection my criteria were ease of use (including, slicing & dicing data at will), connectivity to various data sources (especially REST API - which Tableau doesn't support natively but now has a way to use …
A de minimis incentive was given to thank the reviewer for their time. The incentive was not used to bias or drive a particular response, nor was the incentive contingent on a positive endorsement. More Info
Tableau
Verified User
Chose Tableau Public
Tableau public is Free and no subscription is required whereas Tableau Desktop is a paid subscription. if there is no private or confidential data it's easy to Tableau public and share reports with people. Tableau public has same features and options same as desktop. its easy …
A de minimis incentive was given to thank the reviewer for their time. The incentive was not used to bias or drive a particular response, nor was the incentive contingent on a positive endorsement. More Info
A de minimis incentive was given to thank the reviewer for their time. The incentive was not used to bias or drive a particular response, nor was the incentive contingent on a positive endorsement. More Info
Enterprise Data Architect in Information Technology at Worldline (Computer Software, 51-200 employees)
Chose Tableau Public
Tableau Public provides a variety of visualization and point-and-click functionality, with little or no scripting, gives Tableau the advantage. Also, being lightweight, Tableau Public finds the ease of use from our PSU bank-clients that use low-end hardware and devices. Tableau …
A de minimis incentive was given to thank the reviewer for their time. The incentive was not used to bias or drive a particular response, nor was the incentive contingent on a positive endorsement. TR verified that a representative sample of customers was invited. More Info
Verified User
Chose Tableau Public
Tableau Public allows users to upload their work to a designated place online, where others can view and download it. This feature does not available in OriginLab, which is also a useful and popular program to do data analysis.
A de minimis incentive was given to thank the reviewer for their time. The incentive was not used to bias or drive a particular response, nor was the incentive contingent on a positive endorsement. More Info
Senior Management Analyst in Research & Development at Indiana University (Education Management, 10,001+ employees)
Chose Tableau Public
Tableau Public lacks data connectors to Oracle/SQL Server or just about any. No ability to share non-public data nor to package into Tableau Reader. No ability to connect to Tableau Server or Tableau Online to secure your information. However, if you want basic visualization …
A de minimis incentive was given to thank the reviewer for their time. The incentive was not used to bias or drive a particular response, nor was the incentive contingent on a positive endorsement. More Info
Executive Vice President in Corporate at Computer Information Concepts, Inc. (Computer Software, 51-200 employees)
Chose Tableau Public
We evaluated about 15 products when we selected Tableau 7 years ago, and periodically review products from other vendors (e.g. Microsoft, QlikView, Tibco Spotfire, Birst, Pentaho, etc.). To date, Tableau offers the widest variety of options and functionality at a reasonable …
A de minimis incentive was given to thank the reviewer for their time. The incentive was not used to bias or drive a particular response, nor was the incentive contingent on a positive endorsement. More Info
IBM SPSS Statistics is well suited for pretty much any data analytic scenario. It can handle extremely complex and large-scale datasets with ease. It especially shines if you have to do any kind of analyses that involve significance testing. Being able to do any number of significance tests (i.e., t-tests, chi-square, ANOVAs, etc.) right inside the tool is very valuable. The only scenario I would say it is less appropriate is if you need to work on a very small dataset and answer very simple questions, like frequencies or averages. In those cases, something like Excel could probably do the job just as easily.
A de minimis incentive was given to thank the reviewer for their time. The incentive was not used to bias or drive a particular response, nor was the incentive contingent on a positive endorsement. TR verified that a representative sample of customers was invited. More Info
The best scenario is definitely to collect data from several sources and create dedicated dashboards for specific recipients. However, I miss the possibility of explaining these reports in more detail. Sometimes, we order a report, and after half a year, we don't remember the meaning of some data (I know it's our fault as an organization, but the tool could force better practices).
A de minimis incentive was given to thank the reviewer for their time. The incentive was not used to bias or drive a particular response, nor was the incentive contingent on a positive endorsement. More Info
Tableau public is the best platform to build dashboards for your personal profile and share with recruiters. It's always good to keep ourselves updated on the latest features, create sample dashboards and save them to a personal profile. Tableau public is free and doesn't need any subscription. anyone can create an account and start building reports.
SPSS has been around for quite a while and has amassed a large suite of functionality. One of its longest-running features is the ability to automate SPSS via scripting, AKA "syntax." There is a very large community of practice on the internet who can help newbies to quickly scale up their automation abilities with SPSS. And SPSS allows users to save syntax scripting directly from GUI wizards and configuration windows, which can be a real life-saver if one is not an experienced coder.
Many statistics package users are doing scientific research with an eye to publish reproducible results. SPSS allows you to save datasets and syntax scripting in a common format, facilitating attempts by peer reviewers and other researchers to quickly and easily attempt to reproduce your results. It's very portable!
SPSS has both legacy and modern visualization suites baked into the base software, giving users an easily mountable learning curve when it comes to outputting charts and graphs. It's very easy to start with a canned look and feel of an exported chart, and then you can tweak a saved copy to change just about everything, from colors, legends, and axis scaling, to orientation, labels, and grid lines. And when you've got a chart or graph set up the way you like, you can export it as an image file, or create a template syntax to apply to new visualizations going forward.
SPSS makes it easy for even beginner-level users to create statistical coding fields to support multidimensional analysis, ensuring that you never need to destructively modify your dataset.
In closing, SPSS's long and successful tenure ensures that just about any question a new user may have about it can be answered with a modicum of Google-fu. There are even several fully-fledged tutorial websites out there for newbie perusal.
A de minimis incentive was given to thank the reviewer for their time. The incentive was not used to bias or drive a particular response, nor was the incentive contingent on a positive endorsement. More Info
An excellent tool for data visualization, it presents information in an appealing visual format—an exceptional platform for storing and analyzing data in any size organization.
Through interactive parameters, it enables real-time interaction with the user and is easy to learn and get support from the community.
A de minimis incentive was given to thank the reviewer for their time. The incentive was not used to bias or drive a particular response, nor was the incentive contingent on a positive endorsement. More Info
Data visualization: lots of different options, including bar, scatter, pie, waterfall charts to explore relationships between variables, and to present findings/trends to different teams
Integrates readily with limited, though different data sources: TXT, CSV, TDE, Access
Exports reports for review of different dashboards: client-ready/team-ready, with a clean and tidy presentation in PDF format (or hardcopy)
A de minimis incentive was given to thank the reviewer for their time. The incentive was not used to bias or drive a particular response, nor was the incentive contingent on a positive endorsement. More Info
Availability of procedures in the base package seems to be dwindling.
The copy-and-paste function from output to Excel is not as easy as it once was (now I have to do a "paste special").
Text and date handling are terrible.
Need to include AI-based NLP for survey verbatims and other text-based fields. This is becoming increasingly important in the CX world, yet SPSS seems to be ignoring it.
A de minimis incentive was given to thank the reviewer for their time. The incentive was not used to bias or drive a particular response, nor was the incentive contingent on a positive endorsement. More Info
Tableau Public (both Desktop and Server) like their "for a fee" counterparts offer very easy to learn and use tools to transform data into pictures and gain insights into your data. Most organizations report a reduction in development time of 10x vs. other similar tools, due to the intuitive user interface. That said, with Tableau Public, published workbooks are "disconnected" from the underlying data sources and require periodic updates when the data changes. Users are limited to 1 Gb of storage space per user ID and password as well.
I would like to see better options for public sharing of visualizations and data from within the "for a fee" products as more and more organizations are moving in the direction of data sharing with partners and their communities.
A de minimis incentive was given to thank the reviewer for their time. The incentive was not used to bias or drive a particular response, nor was the incentive contingent on a positive endorsement. More Info
Both money and time are essential for success in terms of return on investment for any kind of research based project work. Using a Likert-scale questionnaire is very easy for data entry and analysis using IBM SPSS. With the help of IBM SPSS, I found very fast and reliable data entry and data analysis for my research. Output from SPSS is very easy to interpret for data analysis and findings
A de minimis incentive was given to thank the reviewer for their time. The incentive was not used to bias or drive a particular response, nor was the incentive contingent on a positive endorsement. More Info
Our use of Tableau Desktop is still fairly low, and will continue over time. The only real concern is around cost of the licenses, and I have mentioned this to Tableau and fully expect the development of more sensible models for our industry. This will remove any impediment to expansion of our use.
A de minimis incentive was given to thank the reviewer for their time. The incentive was not used to bias or drive a particular response, nor was the incentive contingent on a positive endorsement. More Info
It's free, right? I'll keep using the free version. So the real question to ask is this? Will I pay $999 for the Personal version or $1,999 for the Professional? Yikes! That is a big stretch. I'm not sure about that. The product comparison chart is at: http://www.tableausoftware.com/public/comparison
Probably because I have been using it for so long that I have used all of the modules, or at least almost all of the modules, and the way SPSS works is second nature to me, like fish to swimming.
A de minimis incentive was given to thank the reviewer for their time. The incentive was not used to bias or drive a particular response, nor was the incentive contingent on a positive endorsement. More Info
Tableau Desktop has proven to be a lifesaver in many situations. Once we've completed the initial setup, it's simple to use. It has all of the features we need to quickly and efficiently synthesize our data. Tableau Desktop has advanced capabilities to improve our company's data structure and enable self-service for our employees.
Tableau public is a great training tool to understand the basics of Tableau before buying it. A great tool to extend Excel's visualization and to publish data for others. Not useful for anything you need secure. No ability to access databases. Static information only.
A de minimis incentive was given to thank the reviewer for their time. The incentive was not used to bias or drive a particular response, nor was the incentive contingent on a positive endorsement. More Info
When used as a stand-alone tool, Tableau Desktop has unlimited uptime, which is always nice. When used in conjunction with Tableau Server, this tool has as much uptime as your server admins are willing to give it. All in all, I've never had an issue with Tableau's availability.
A de minimis incentive was given to thank the reviewer for their time. The incentive was not used to bias or drive a particular response, nor was the incentive contingent on a positive endorsement. More Info
Tableau Desktop's performance is solid. You can really dig into a large dataset in the form of a spreadsheet, and it exhibits similarly good performance when accessing a moderately sized Oracle database. I noticed that with Tableau Desktop 9.3, the performance using a spreadsheet started to slow around 75K rows by about 60 columns. This was easily remedied by creating an extract and pushing it to Tableau Server, where performance went to lightning fast
A de minimis incentive was given to thank the reviewer for their time. The incentive was not used to bias or drive a particular response, nor was the incentive contingent on a positive endorsement. More Info
I have not contacted IBM SPSS for support myself. However, our IT staff has for trying to get SPSS Text Analytics Module to work. The issue was never resolved, but I'm not sure if it was on the IT's end or on SPSS's end
Tableau support has been extremely responsive and willing to help with all of our requests. They have assisted with creating advanced analysis and many different types of custom icons, data formatting, formulas, and actions embedded into graphs. Tableau offers a weekly presentation of features and assists with internal company projects.
A de minimis incentive was given to thank the reviewer for their time. The incentive was not used to bias or drive a particular response, nor was the incentive contingent on a positive endorsement. More Info
A de minimis incentive was given to thank the reviewer for their time. The incentive was not used to bias or drive a particular response, nor was the incentive contingent on a positive endorsement. More Info
It is admittedly hard to train a group of people with disparate levels of ability coming in, but the software is so easy to use that this is not a huge problem; anyone who can follow simple instructions can catch up pretty quickly.
I think the training was good overall, but it was maybe stating the obvious things that a tech savvy young engineer would be able to pick up themselves too. However, the example work books were good and Tableau web community has helped me with many problems
A de minimis incentive was given to thank the reviewer for their time. The incentive was not used to bias or drive a particular response, nor was the incentive contingent on a positive endorsement. More Info
Have a plan for managing the yearly upgrade cycle. Most users work in the desktop version, so there needs to be a mechanism for either pushing out new versions of the software or a key manager to deal with updated licensing keys. If you have a lot of users this needs to be planned for in advance.
A de minimis incentive was given to thank the reviewer for their time. The incentive was not used to bias or drive a particular response, nor was the incentive contingent on a positive endorsement. More Info
Again, training is the key and the company provides a lot of example videos that will help users discover use cases that will greatly assist their creation of original visualizations. As with any new software tool, productivity will decline for a period. In the case of Tableau, the decline period is short and the later gains are well worth it.
A de minimis incentive was given to thank the reviewer for their time. The incentive was not used to bias or drive a particular response, nor was the incentive contingent on a positive endorsement. More Info
Start at the end and work backward. Identify the business case / issue and questions the end users have, then identify the data needed, and where to get it.
A de minimis incentive was given to thank the reviewer for their time. The incentive was not used to bias or drive a particular response, nor was the incentive contingent on a positive endorsement. More Info
If you have made it this far, you should have a very good idea of how SPSS stacks up the competition (data processing and analytics tools). Even the free ones, such as r Studio or Stata, are leaps and bounds ahead of SPSS. IBM is resting on a reputation developed nearly 30 years ago and has shown no desire to improve.
A de minimis incentive was given to thank the reviewer for their time. The incentive was not used to bias or drive a particular response, nor was the incentive contingent on a positive endorsement. TR verified that a representative sample of customers was invited. More Info
I have used Power BI as well, the pricing is better, and also training costs or certifications are not that high. Since there is python integration in Power BI where I can use data cleaning and visualizing libraries and also some machine learning models. I can import my python scripts and create a visualization on processed data.
A de minimis incentive was given to thank the reviewer for their time. The incentive was not used to bias or drive a particular response, nor was the incentive contingent on a positive endorsement. More Info
Google Charts/Drive is sufficient for simpler data sets, but it does not integrate with other web platforms and the visualization does not look as professional. I'm not aware of any other competitors that offer the same package as Microsoft.
A de minimis incentive was given to thank the reviewer for their time. The incentive was not used to bias or drive a particular response, nor was the incentive contingent on a positive endorsement. More Info
A de minimis incentive was given to thank the reviewer for their time. The incentive was not used to bias or drive a particular response, nor was the incentive contingent on a positive endorsement. More Info
Tableau Desktop's scaleability is really limited to the scale of your back-end data systems. If you want to pull down an extract and work quickly in-memory, in my application it scaled to a few tens of millions of rows using the in-memory engine. But it's really only limited by your back-end data store if you have or are willing to invest in an optimized SQL store or purpose-built query engine like Veritca or Netezza or something similar.
I found SPSS easier to use than SAS as it's more intuitive to me.
The learning curve to use SPSS is less compared to SAS.
I used SAS, to a much lesser extent than SPSS. However, it seems that SAS may be more suitable for users who understand programming. With SPSS, users can perform many statistical tests without the need to know programming.
A de minimis incentive was given to thank the reviewer for their time. The incentive was not used to bias or drive a particular response, nor was the incentive contingent on a positive endorsement. TR verified that a representative sample of customers was invited. More Info
Tableau was acquired years ago, and has provided good value with the content created.
Ongoing maintenance costs for the platform, both to maintain desktop and server licensing has made the continuing value questionable when compared to other offerings in the marketplace.
Users have largely been satisfied with the content, but not with the overall performance. This is due to a combination of factors including the performance of the Tableau engines as well as development deficiencies.
A de minimis incentive was given to thank the reviewer for their time. The incentive was not used to bias or drive a particular response, nor was the incentive contingent on a positive endorsement. More Info
A de minimis incentive was given to thank the reviewer for their time. The incentive was not used to bias or drive a particular response, nor was the incentive contingent on a positive endorsement. More Info