Icinga is an open source network monitoring platform. It includes automation, modularized integration packages, and prebuilt alerts and reporting capabilities.
N/A
NetApp Cloud Insights
Score 9.2 out of 10
N/A
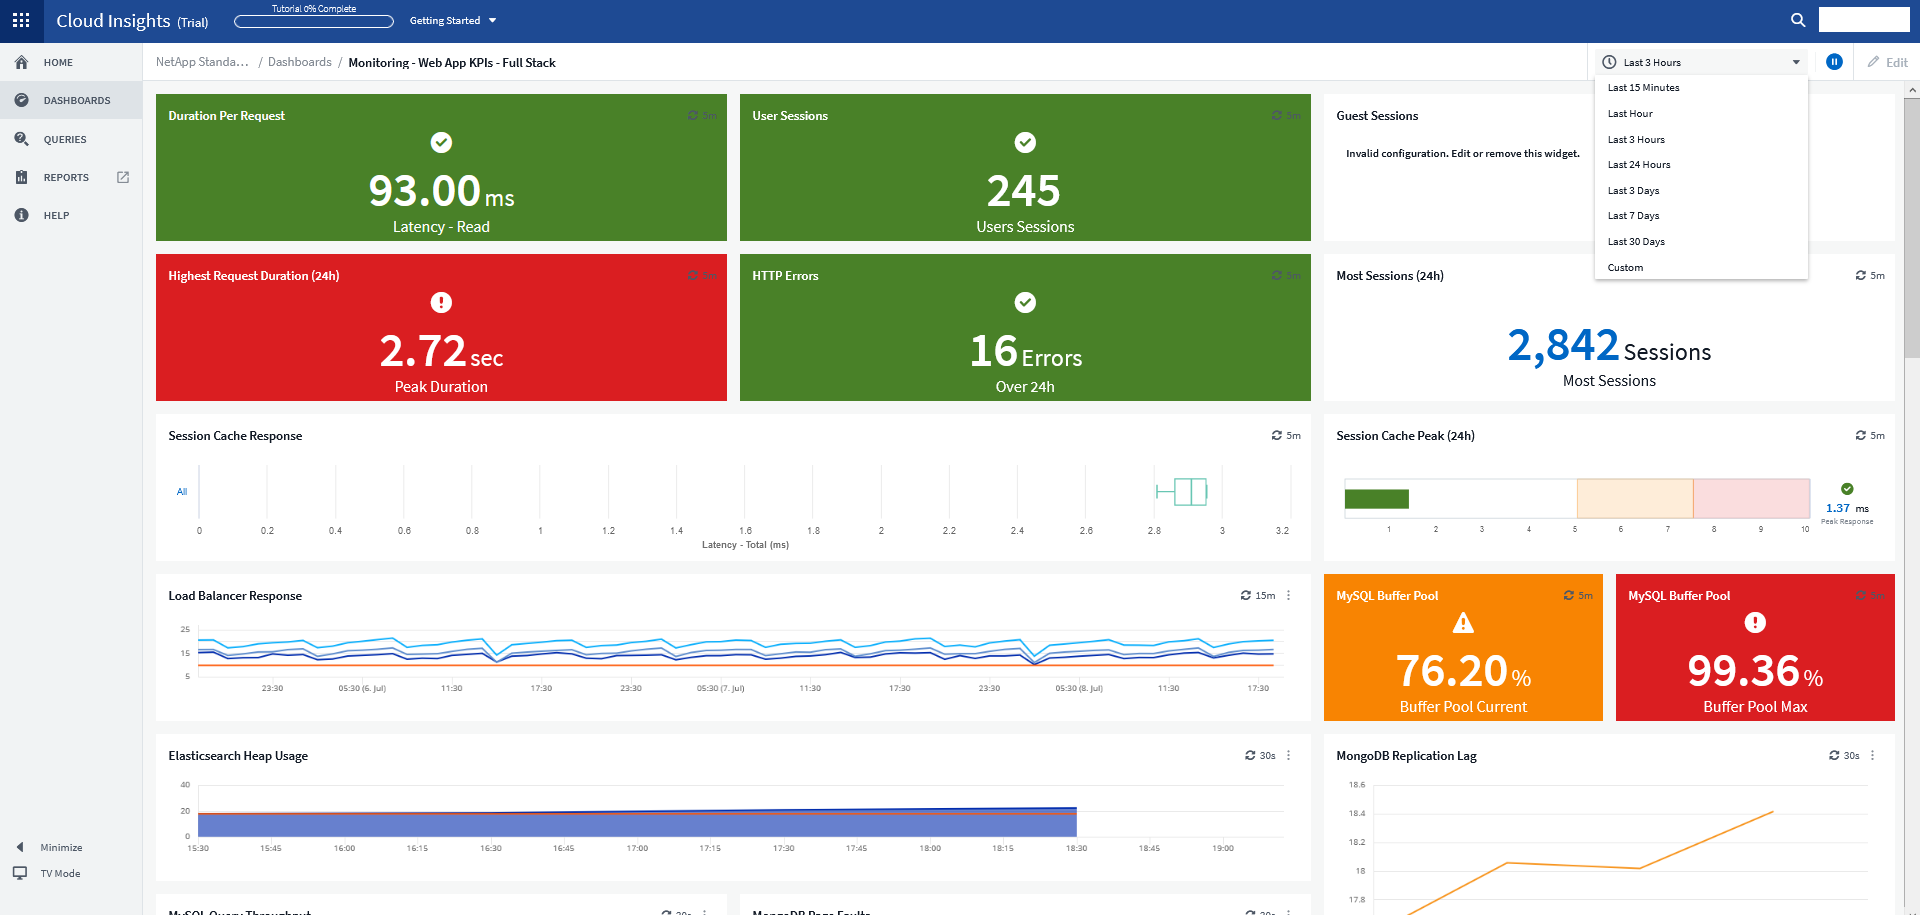
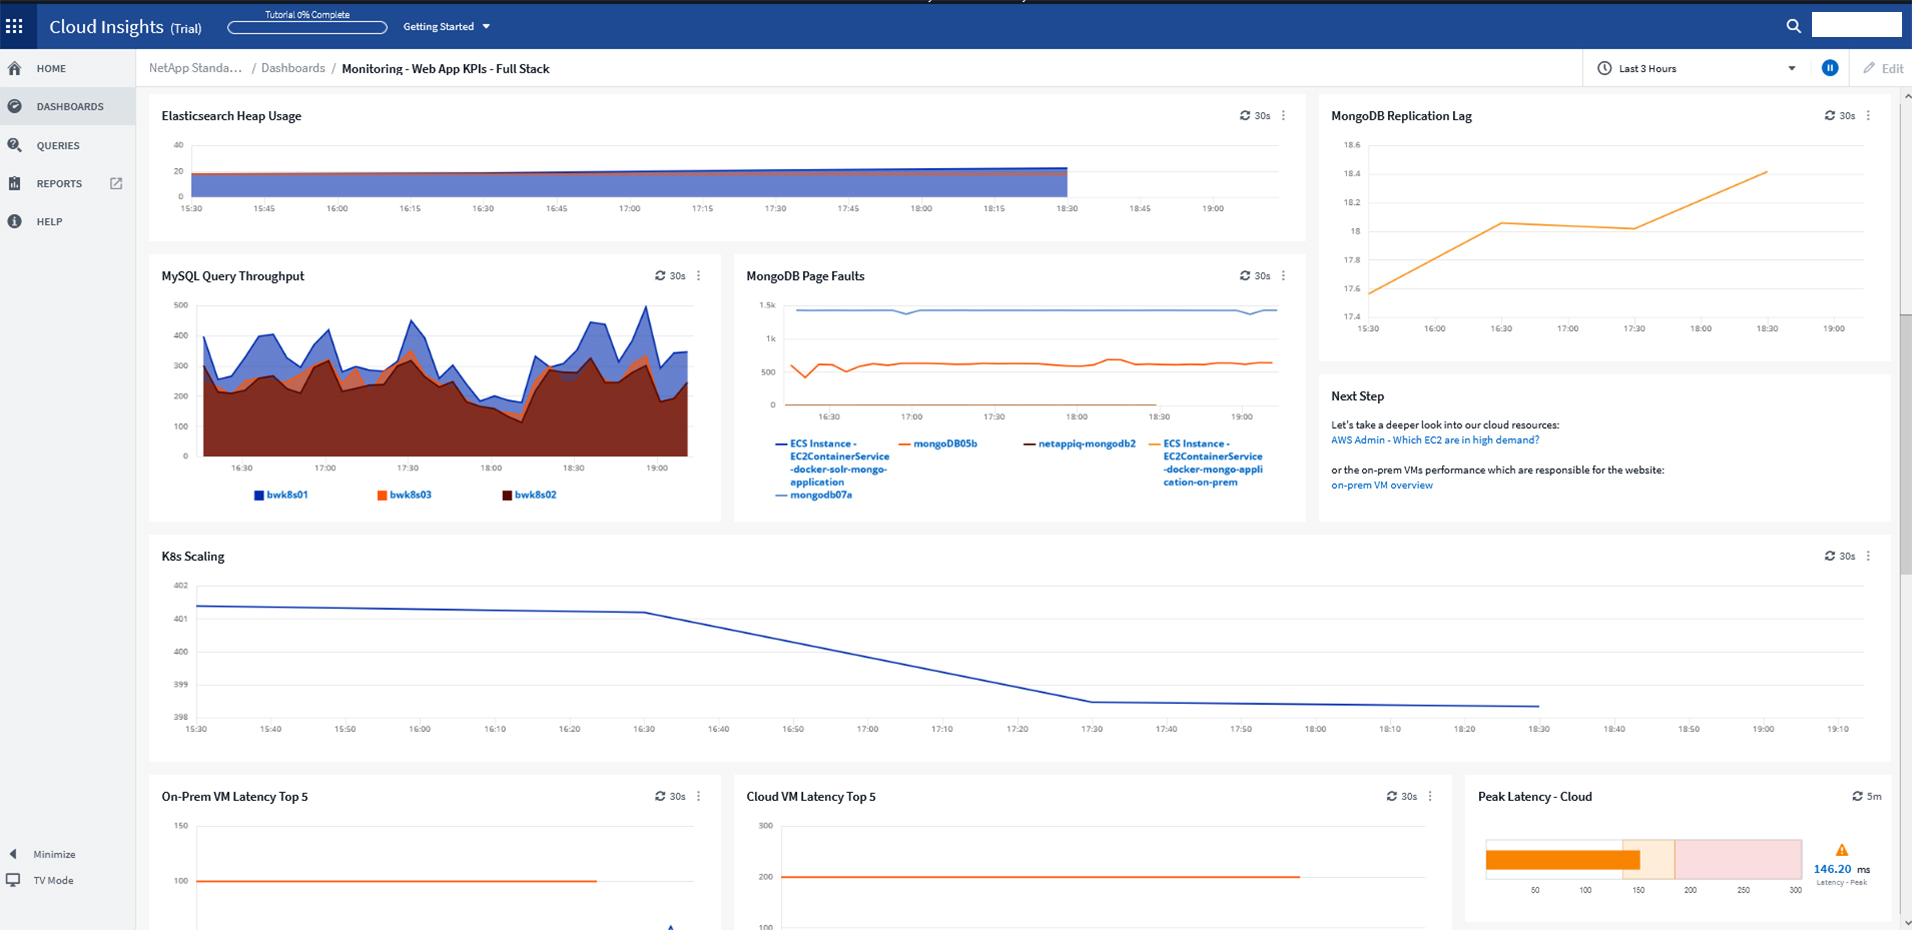
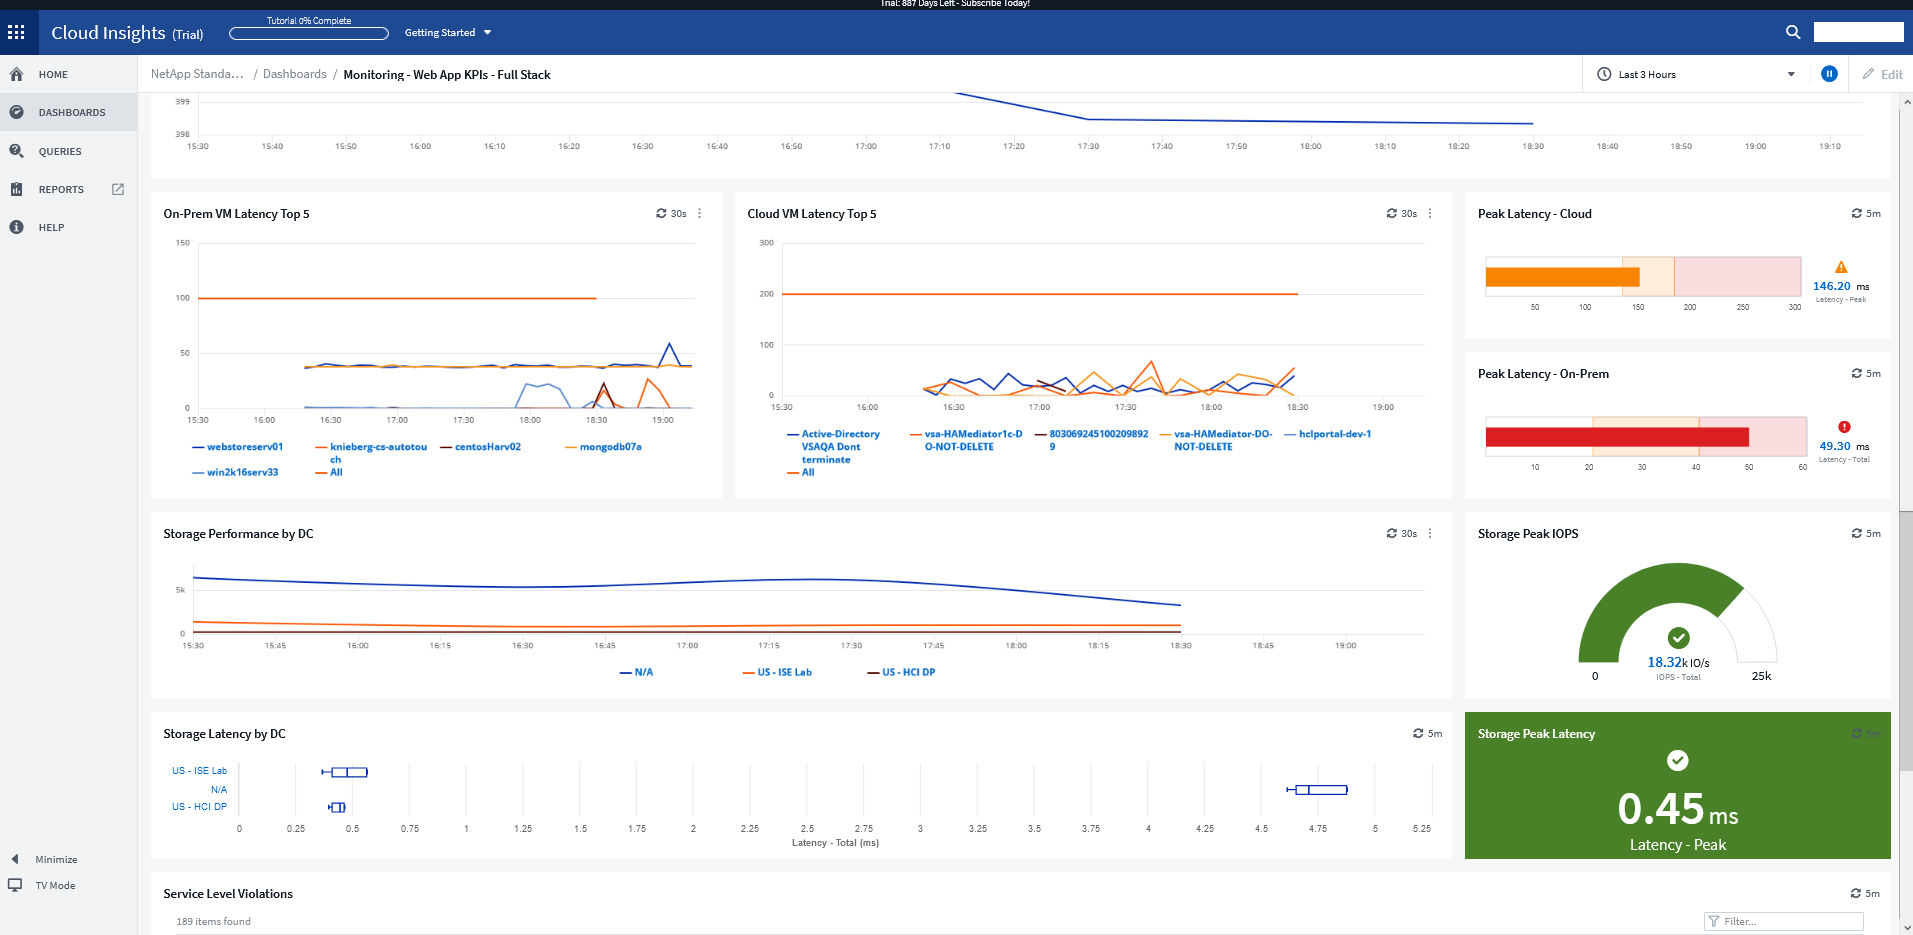
NetApp Cloud Insights is an infrastructure monitoring tool that gives
users visibility into their complete infrastructure. With Cloud Insights, users can monitor, troubleshoot and optimize all resources including
public clouds and private data centers.
N/A
Prometheus
Score 7.9 out of 10
N/A
Prometheus is a service monitoring and time series database, which is open source.
Icinga is a world-class monitoring system. It can be used for most general monitoring situations. It is not a silver bullet, however, and there are instances where domain-specific monitoring systems are necessary. However, the output from those monitoring systems can be funneled into Icinga as a central monitoring and alerting system.
For example, we had an application slowdown. It looked like the slowdown was storage. However, it was a malformed SQL query that no one realized was pulling data from the storage location that also housed the application. Cloud Insights saved us hours of downtime and frustration. Cloud Insights pinpointed which system was hogging resources. What makes Cloud Insights special is the way it looks at the data collected from the data sources. The insights it provides into the flow of data; sheds new light on how things work in your environment.
This program works from the roots of the problem and creates a professional matrix for each of its users. This will give them more skills and resources to carry out tasks and reduce the difficulties of operating each of the processes of my work, as well as being An ally for the manipulation and operability of all your master data; Prometheus is very easy to recommend since it is a program that fulfills its mission.
Customer Service: since this is an open-source tool, customer service is not that great. Generally, you get all answers to your problems in online forums, but in case you got stuck, nobody will assist you in a channelised manner. You will have to find the way out on your own, and it may become frustrating at times.
More metrics for dashboards shall be added per the application being monitored. Standards metrics will work in most cases but may not in specific applications. Therefore, customised metrics shall be created for some of the industry-standard niche applications.
Icinga is a solid solution which does everything it promises. It is backwards compatible with most Nagios instances, making the transition very easy. Once you get the hang of installing new plugins and editing configuration files expanding its monitoring capabilities are easy.
I have been extremely happy with its usability. You can take thins as they are out of the box and it is useful. You can carry it as far as you want to go and every step you take improves your ROI.
It is usable and one can learn if few people in the team are already using it. It can be difficult to understand at the beginning because of non intuitive UI and syntax of the rules. So, I've gone for 7 points as there is some room for improvement in user interface and rules syntax.
Icinga is better than Nagios because of its nicer user interface. New Relic can monitor CPU/memory and disk usage, but it's more of a performance and application troubleshooting tool rather than monitoring
For a while, we were using Zabbix to monitor our Kubernetes applications and microservices on our infrastructure in more than one public cloud platform. Cloud Insights has much better visualized dashboards. In addition, despite such a large number of quality features, it's still priced competitively.
Highly customized pricing plans to choose from. Lower pricing for the same features compared to competitors. Easy to reach the support team, which provided detailed documentation and helped set up the Prometheus. Monitoring metrics gets very easy after the integration with Grafana. It also has a sophisticated alert setting mechanism to ensure we don't miss anything critical.
Once you install the acquisition unit and start collecting data, you can immediately begin using it. It is very self-explanatory and helpful. I could have used Cloud Insights without working with the NetApp Cloud Insights support team. I am glad I engaged them though. They helped me carry Cloud Insights to a new level and it fast-tracked the process that would have taken me time to complete.
The ROI mentioned during the purchase has not been achieved, however this could be due to lack of data from our side. 2 years of implementation is too early to calculate and confirm the ROI.