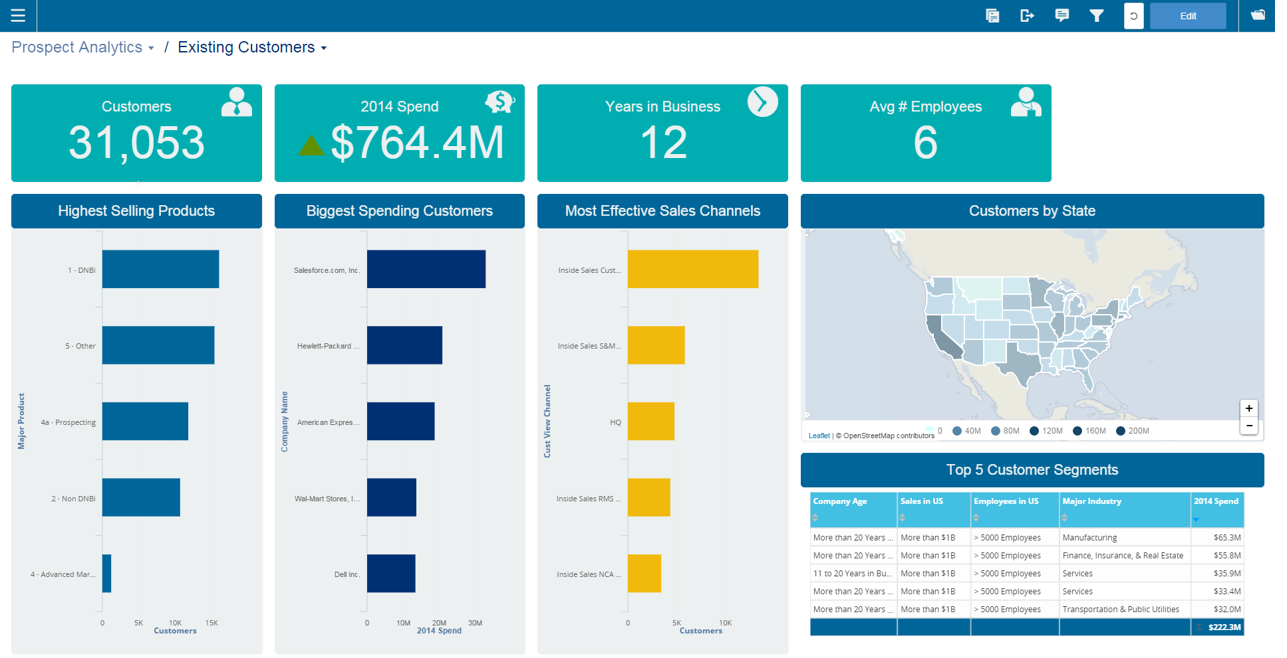
Infor Birst offers multi-tenant cloud BI for deployment in a public or private cloud, or on-premises. It provides an in-memory columnar data store and a BI layer comprising a reporting engine, predictive analytics tools, mobile native apps, dashboards, discovery tools, and an open client interface.
N/A
QlikView
Score8.4 out of 10
N/A
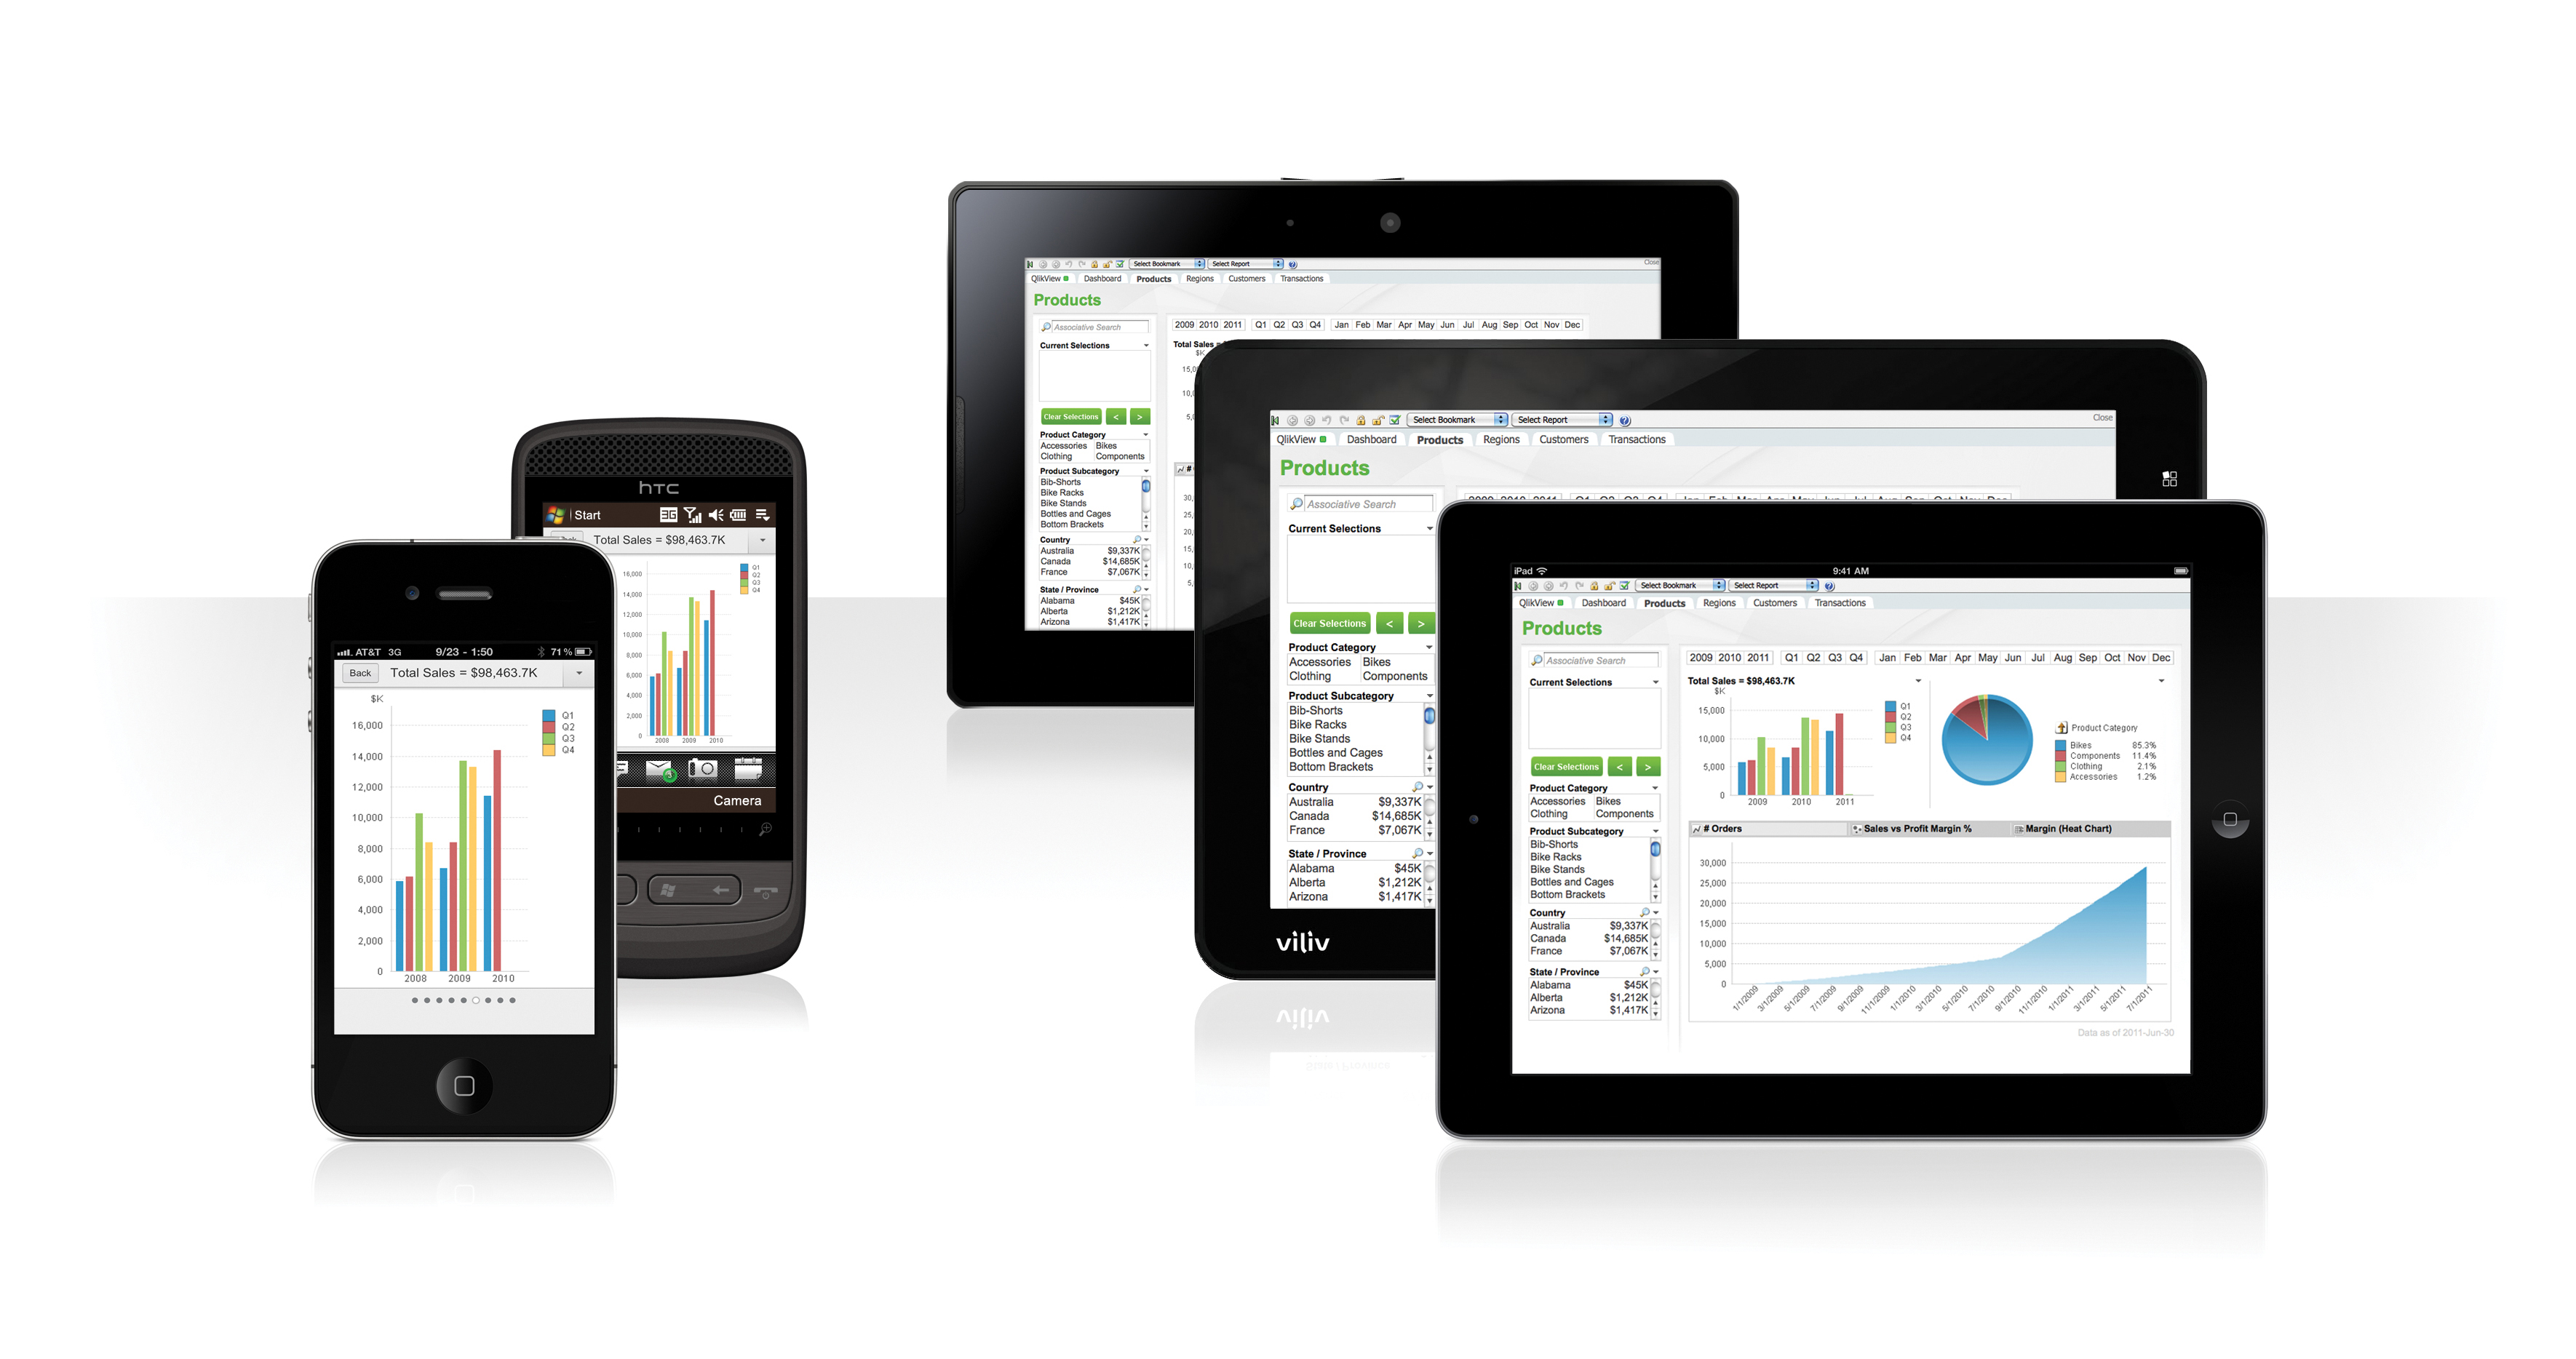
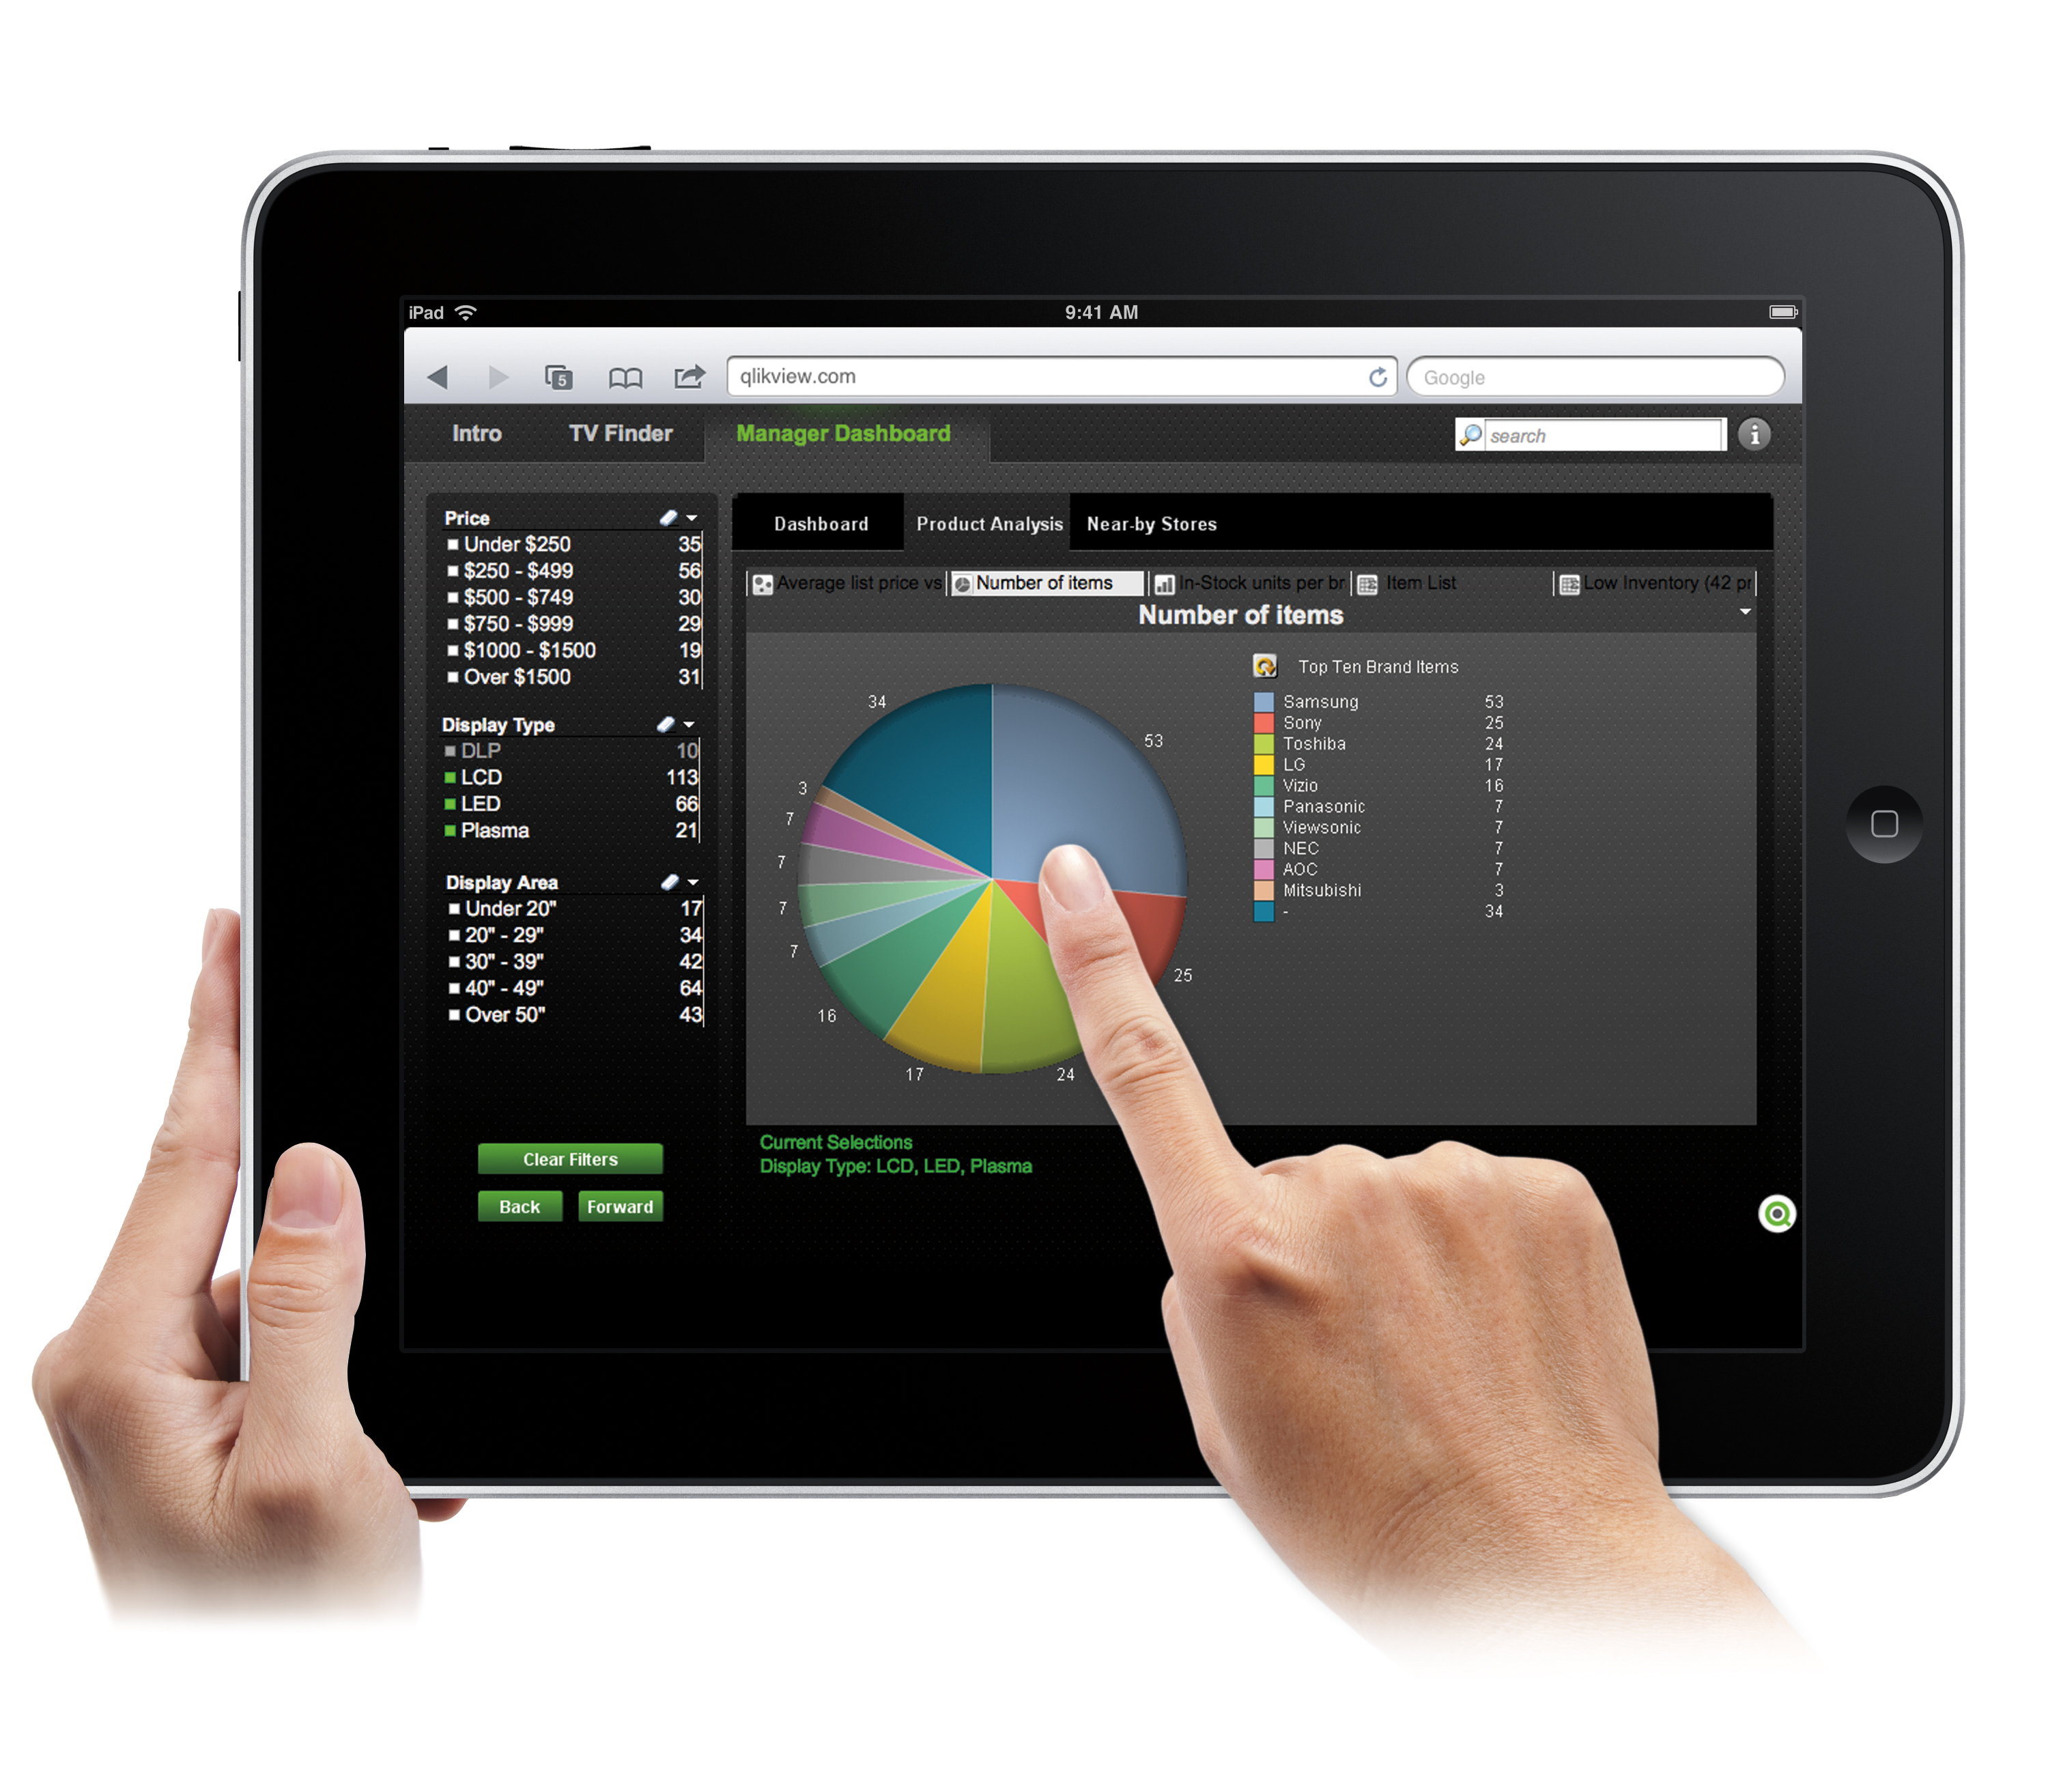
QlikView® is Qlik®’s original BI offering designed primarily for shared business intelligence reports and data visualizations. It offers guided exploration and discovery, collaborative analytics for sharing insight, and agile development and deployment.
N/A
SAS Visual Analytics
Score7.8 out of 10
Enterprise companies (1,001+ employees)
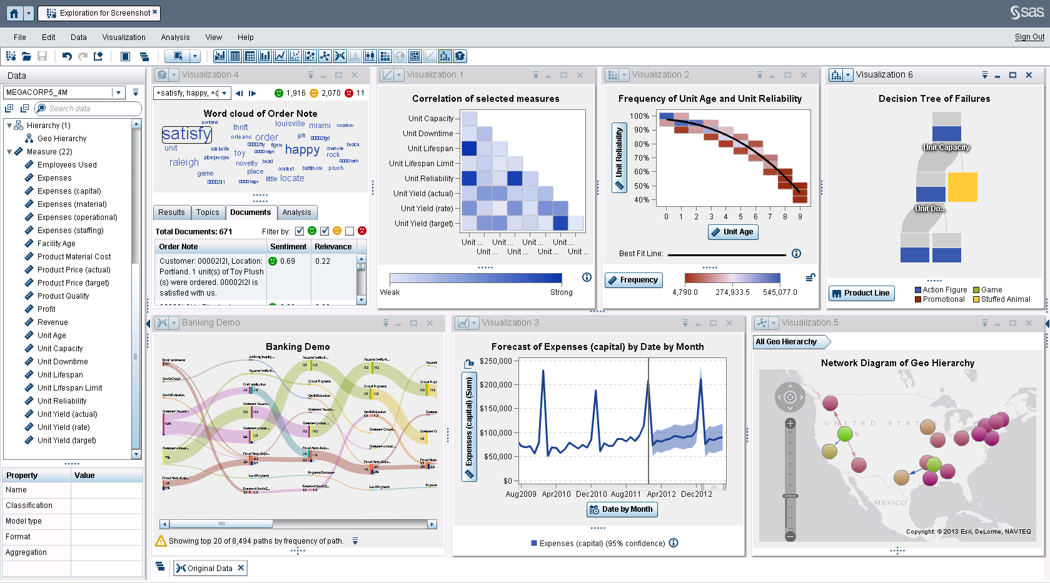
SAS Visual Analytics provides a complete platform for analytics visualization, enabling users to identify patterns and relationships in data that weren't initially evident. Interactive, self-service BI and reporting capabilities are combined with out-of-the-box advanced analytics so everyone can discover insights from any size and type of data, including text.
N/A
Pricing
Infor Birst
QlikView
SAS Visual Analytics
Editions & Modules
No answers on this topic
QlikView
Custom
per user
SAS Visual Analytics for SAS Cloud
$0
Annual By Users: 5, 10, 20
Offerings
Pricing Offerings
Infor Birst
QlikView
SAS Visual Analytics
Free Trial
No
Yes
Yes
Free/Freemium Version
No
No
No
Premium Consulting/Integration Services
Yes
Yes
Yes
Entry-level Setup Fee
No setup fee
Optional
No setup fee
Additional Details
—
On an perpetual license basis, based on server plus number of users.
Contact vendor for pricing.
SAS Visual Statistics and SAS Office Analytics are also available as add-ons.
Global Database Administrator in Information Technology at ElectroCraft (Industrial Automation, 501-1000 employees)
Chose Infor Birst
We preferred to have an all-in-one cloud solution that could connect to Salesforce.com and on-premise servers. I thought the combination of ETL built into a star-schema was unmatched. QlikView could do something similar, but the resulting data file was not an enterprise grade …
A de minimis incentive was given to thank the reviewer for their time. The incentive was not used to bias or drive a particular response, nor was the incentive contingent on a positive endorsement. TR verified that a representative sample of customers was invited. More Info
Verified User
Chose Infor Birst
Birst was the right size for our company. The other vendors were to large and scope was to much.
A de minimis incentive was given to thank the reviewer for their time. The incentive was not used to bias or drive a particular response, nor was the incentive contingent on a positive endorsement. TR verified that a representative sample of customers was invited. More Info
A de minimis incentive was given to thank the reviewer for their time. The incentive was not used to bias or drive a particular response, nor was the incentive contingent on a positive endorsement. TR verified that a representative sample of customers was invited. More Info
Verified User
Chose Infor Birst
Birst is an end to end tool for BI. You don't have to deal with many software manufacturers. The cloud based BI in birst is very helpful which provides availability of data within a secure environment.
A de minimis incentive was given to thank the reviewer for their time. The incentive was not used to bias or drive a particular response, nor was the incentive contingent on a positive endorsement. TR verified that a representative sample of customers was invited. More Info
A de minimis incentive was given to thank the reviewer for their time. The incentive was not used to bias or drive a particular response, nor was the incentive contingent on a positive endorsement. TR verified that a representative sample of customers was invited. More Info
Manager Data Services in Information Technology at Apex Supply Chain Technologies, LLC (Industrial Automation, 201-500 employees)
Chose Infor Birst
The ability to scale was the primary factor for our CIO's approval. The other products had solutions for scale, but Birst has the one we preferred. As an IoT company our CIO concentrates on products that will meet our requirements today and far into the future. The other …
A de minimis incentive was given to thank the reviewer for their time. The incentive was not used to bias or drive a particular response, nor was the incentive contingent on a positive endorsement. TR verified that a representative sample of customers was invited. More Info
Verified User
Chose Infor Birst
Birst have the ability to pull a huge amount of data with rendering/processing of data quickly.
Birst is the finest cloud based BI tool I have seen.
A de minimis incentive was given to thank the reviewer for their time. The incentive was not used to bias or drive a particular response, nor was the incentive contingent on a positive endorsement. TR verified that a representative sample of customers was invited. More Info
Verified User
Chose Infor Birst
Birst stands out as having the modt complete technical stack from ETL, modeling and BI for our needs
Data Specialist in Information Technology at Samaritan Ministries International (Religious Institutions, 51-200 employees)
Chose Infor Birst
It came down to QlikView, Tableau, Cognos, and Birst. QlikView and Tableau were eliminated because they are simply reporting tools, and it was eventually determined that we wanted to set up a data warehouse. Birst beat Cognos because it had nicer looking reports, was much …
Chief Operating Officer in Corporate at Crystal Clear Rx (Health, Wellness and Fitness, 1-10 employees)
Chose Infor Birst
QlikView - on the face, similar system design, agnostic data sources, Cognos - previous experience MS Reporting Services - fit with internal systems/tools/environment.
CFO (Chief Financial Officer) in Finance and Accounting at Rock Solid Finance (Consumer Goods, 51-200 employees)
Chose QlikView
I was forced into QV by QuickBooks -- I did not have the opportunity to evaluate it specifically against other packages. I have, however, seen Microsoft BI and BIRST --- both of which seem much more expensive (and perhaps complex) than QlikView. But I'm conjecturing a bit here.
A de minimis incentive was given to thank the reviewer for their time. The incentive was not used to bias or drive a particular response, nor was the incentive contingent on a positive endorsement. More Info
SAS
Verified User
Chose SAS Visual Analytics
We already have lot of SAS products in our organisation like Base SAS, SAS Grid, SAS EG, SAS Studio and Office Add-in. SAS VA works best for our situation.
A de minimis incentive was given to thank the reviewer for their time. The incentive was not used to bias or drive a particular response, nor was the incentive contingent on a positive endorsement. More Info
Infor Birst OEM and embedded analytics are well suited for advanced analytics and business intelligence. It has flexible deployment features and a lot of configuration ability with low code - no coding ability. Ability to ingest data from multiple live data sources. Source data from multiple sources can be segregated into multiple sections based on business criteria. Easily searchable business terms (metadata) across all enterprise analytic content.
Sales data validations have helped manage our justifications in the past, especially with regard to new product development and new business introduction. It has also been helpful in identifying trends with business impact and direction specific to quarter and monthly sales from ERP data as well as decisions to purchase equipment of staffing based on run rates and product demand.
One thing that can get out of hand is data output - if you aren't careful in your query, you may be overloaded with data dumps and drown in the amount of info you have to filter through. This is a user caution, not a comment on the software itself.
A de minimis incentive was given to thank the reviewer for their time. The incentive was not used to bias or drive a particular response, nor was the incentive contingent on a positive endorsement. More Info
I was in a meeting with the client and there I have to show them some analytic data to them. But I was confused about how I will manage to show big data to clients with accuracy. But then the SAS Visual Analytics software helps me in presenting accurate data at the moment and it was very presentable and through that, I got the deal for that business.
A de minimis incentive was given to thank the reviewer for their time. The incentive was not used to bias or drive a particular response, nor was the incentive contingent on a positive endorsement. More Info
End-to-end solution, from raw source data, ETL, warehousing and reporting, Birst is able to do everything we need in one package instead of needing to develop and maintain multiple technologies
Intuitive report development. The drag and drop creation of reports is simple. More complicated queries are easy to generate.
Very user-friendly and interactive. A lot of nice features are available both for developers and end users to streamline the process of preparing and consuming data
Rich API which allows us to programmatically interact with Birst
A de minimis incentive was given to thank the reviewer for their time. The incentive was not used to bias or drive a particular response, nor was the incentive contingent on a positive endorsement. More Info
A de minimis incentive was given to thank the reviewer for their time. The incentive was not used to bias or drive a particular response, nor was the incentive contingent on a positive endorsement. More Info
Provides the flexibility to the end user to slice and dice the data.
Anyone can make predictive models with the help of in-built algorithms without the need to write a single line of code or knowledge of what's under the hood of algorithms.
The feature to simply ask a question related to data and getting a response in form of text, chart or graph is amazing.
A de minimis incentive was given to thank the reviewer for their time. The incentive was not used to bias or drive a particular response, nor was the incentive contingent on a positive endorsement. More Info
A de minimis incentive was given to thank the reviewer for their time. The incentive was not used to bias or drive a particular response, nor was the incentive contingent on a positive endorsement. TR verified that a representative sample of customers was invited. More Info
We found that QlikView can be a bit slow in supporting some forms of encryption. It is web-based and we needed to upgrade all of our server to not support the older SSL and TLS 1 protocols, only support TLS 1.2 and TLS 1.3. However, QlikView could not run with TLS 1.2 and TLS 1.3. We had to wait over six months to get a version that would handle the newer TLS versions.
There are so many options with QlikView that you can get lost when developing a visualization. There are still items I have not yet figured out, such as labeling a graph with the name of a selected detail item.
QlikView works by pulling the data it is going to use for visualization into its database. I am a security reviewer and I need to make certain that PII and PHI is not pulled by QlikView for a visualization, otherwise this could become a reportable indecent.
A de minimis incentive was given to thank the reviewer for their time. The incentive was not used to bias or drive a particular response, nor was the incentive contingent on a positive endorsement. More Info
SAS is relatively expensive when compared to other BI tools and requires a large amount of upfront fee which becomes an issue for smaller organizations.
UI for the dashboards looks a little date in comparison to competitors like Tableau and Microstrategy.
Integration with other open source software like Python needs to be built in.
A de minimis incentive was given to thank the reviewer for their time. The incentive was not used to bias or drive a particular response, nor was the incentive contingent on a positive endorsement. More Info
We have been able to overcome any of the drawbacks we've found with Birst easily and it has fulfilled almost all of our analytic needs to date. Having seen their roadmap it would be highly unlikely we would move away from this platform any time soon. You simply can't beat the functionality that Birst provides for the price and the things I see coming out of the company solidify that our decision to choose Birst was the best possible choice. We have never regretted the decision.
Ease of use, ability to load from pretty much any data source. today I created an application that loaded time sheets from excel that are not in a table format. With Qlik's "enable transformation steps" I was able to automate loads of multiple spreadsheets and multiple tabs easily. Could not do that with any other tool.
A de minimis incentive was given to thank the reviewer for their time. The incentive was not used to bias or drive a particular response, nor was the incentive contingent on a positive endorsement. More Info
SAS really is the cutting edge in Business Intelligence. That is all they do! They are constantly coming out with new products, product upgrades, and their tech support is second to none. In addition, their support of Education has made our ability to acquire their product possible.
I would like to see additional usability put into the ETL scripting. Recently, Birst added a nice function reference inline to formula creation which has kept me from having to return to documentation so much. The same in ETL would be very beneficial. The interface problems related to the Flex framework are being addressed in a rewrite to HTML 5, but for now they are still a hindrance to a higher usability rating.
QlikView is very easy to implement. The installation is very straight forward. QlikView has several different data connectors that can connect to different data sources very smoothly. The user interface to build the reports is very easy to understand. This helps to have a smaller learning curve. Something very helpful is that QlikView is a browser application for the end users. So, you don't need to install any applications on the user's computer.
A de minimis incentive was given to thank the reviewer for their time. The incentive was not used to bias or drive a particular response, nor was the incentive contingent on a positive endorsement. More Info
SAS BI is good for creating reports and dashboards and then sharing it with the users. It also has ability to manage access to the reports and dashboards but somehow with most of the world moving to open source languages R, Python and Julia, SAS BI feels to be archaic in terms of feature set and integrations it allow[s]. Also, comparing it with other Business Intelligence tools like Tableau and Microsoft BI, the functionality of SAS BI is very limited and doesn't justify the pricing.
A de minimis incentive was given to thank the reviewer for their time. The incentive was not used to bias or drive a particular response, nor was the incentive contingent on a positive endorsement. More Info
We frequently experience -103 errors due to us using the Live Connect functionality, which does not seem to handle even minor interruptions in connectivity, and treats all future connection attempts or data requests as errors, even if the issue does not exist any longer
Everything runs very fast and smoothly. The only process that I wish was faster would be processing the data after uploading new data or making changes to the existing data model. It can take 15-20 minutes (roughly) to upload and process new data once you start getting into 10's of millions of rows. Given my experience with how long it takes me to pull the same data using SQL Server Management Studio, I don't think Birst is unreasonably slow - but for me to give a higher rating, I would want it to be unreasonably fast
A de minimis incentive was given to thank the reviewer for their time. The incentive was not used to bias or drive a particular response, nor was the incentive contingent on a positive endorsement. TR verified that a representative sample of customers was invited. More Info
My experience with the Qlik support team has been somewhat limited, but every interaction I have had with them has been very professional and I received a response quickly. Typically if there is a technical issue, our IT team will follow up. My inquiries are specific to product functionality, and Qlik has been very helpful in clarifying any questions I might have.
A de minimis incentive was given to thank the reviewer for their time. The incentive was not used to bias or drive a particular response, nor was the incentive contingent on a positive endorsement. More Info
When you call tech support, you are immediately routed to a person who can answer your question. Often they can answer on the spot. However, if they cannot, you are given a track number and then followed up with. There have been times when I have had multiple track numbers open and they will actually TRACK YOU DOWN to ensure that your problem has been resolved. Issues do not fall into black holes with SAS. They are also willing to do a WebEx with you to diagnose the problem by seeing your environment, which is always helpful.
I have attended two different training sessions. The first one was my initial training on the system. It was well paced, clear and concise. If there were questions that were not able to be answered by the instructor, he took down the question and actually followed up and provided us a response quickly. The second session was specific to the dashboard and report design components. This training was very good though there were some attendants who had little or no experience and their questions slowed the class.
My team attended, but I cannot myself rate, but I think it was good as they've successfully launched a training program at our company themselves for users. It was 3-4 day training.
Although I found the online resources helpful, a lack of appropriate examples for certain tasks key to report creation and advanced modeling make the online training/documentation less than perfect. For an inexperienced BI professional, the online training would not enable a streamlined launch of the product.
Training was as expected. The demo environments tend to be more fully featured that our own environment, but the training was clear and well delivered.
Have clean data! Birst flexibility allows - Start small, then introduce functionality and complexity along the way. If you try to present all the functionality [bells and whistles] and wow them, but bad data is uncovered, the end user blames the new application and turns away.
"Implementation" can mean a few things... so I'm not sure that this is the answer you want.... but here it goes: To me, implementation means: "Is the user interface intuitive and can I produce meaningful reports with ease?" On that score, I'd say YES. The amount of training required was minimal and the results were powerful. The desktop implementation is a simple, "blank" interface just waiting for your creativity. The pre-populated templates give you a reasonable start to any project -- and a good set of objects to "play around with" if you're just getting started. Finally, note that the "implementation" I used was baked into QuickBooks 2016 Enterprise -- called "Advanced Reporting"..... That integration makes it ultra useful and simple.
A de minimis incentive was given to thank the reviewer for their time. The incentive was not used to bias or drive a particular response, nor was the incentive contingent on a positive endorsement. More Info
Birst was better than Domo for our needs because we could get in and tinker with it. Our impression of Domo was that it had a lot of connectors and ready to go reports, but it made too many assumptions about applications we use. We customize too much to use a "ready to go" solution like that. When we looked at Tableau, we liked its visualization capabilities, but it wasn't going to help us do the extractions, ETL, and warehousing of data. It may have come some distance since then.
A de minimis incentive was given to thank the reviewer for their time. The incentive was not used to bias or drive a particular response, nor was the incentive contingent on a positive endorsement. TR verified that a representative sample of customers was invited. More Info
The only other vendor product that I have worked with that provides a similar experience to Qlikview is Tableau. I would recommend Tableau if your use case is to build a fixed dashboard. You can share reports for free without needing to buy additional licenses. I would recommend Qlikview if your users are looking for a more interactive experience. They can create new objects to represent the data which can't be accomplished as easily in Tableau
A de minimis incentive was given to thank the reviewer for their time. The incentive was not used to bias or drive a particular response, nor was the incentive contingent on a positive endorsement. More Info
I have used Crystal Reports, Jaspersoft and SQL Server Reporting Services (SSRS). I would recommended Business Intelligence over SSRS and Crystal Reports. SSRS is very SQL-centric and Crystal Reports is more of an end-user tool. I would recommend Jaspersoft over Business Intelligence for developing a seamless web-based reporting interface but I highly recommend Business Intelligence for end-user ad-hoc reporting.
A de minimis incentive was given to thank the reviewer for their time. The incentive was not used to bias or drive a particular response, nor was the incentive contingent on a positive endorsement. More Info
we can see that loading a lot of data can cause a noticable slow down in performance. Birst support indicated that they don't really consider anything less than 30 seconds to be an issue, but that is not the case for our customers, so we have had to change some of implementation to address this
Being a manufacturing company we tend to lag behind technologically. But having all the data for different ERP systems in one place has been an eye opener for the executives. It has lessened the need to convert some legacy ERP systems.
Having such a simple reporting tool is a great asset to some of our sites that have traditionally had trouble gathering data from AS400 systems.
A de minimis incentive was given to thank the reviewer for their time. The incentive was not used to bias or drive a particular response, nor was the incentive contingent on a positive endorsement. TR verified that a representative sample of customers was invited. More Info
You can use the free desktop version to do a lot of reporting and analysis work more quickly so the ROI is huge
QlikView is great at finding outliers such as data entry errors
QlikView is great at helping you quickly discover new insights about your business that can prompt you to take action that can immediately affect your cash flow.
A de minimis incentive was given to thank the reviewer for their time. The incentive was not used to bias or drive a particular response, nor was the incentive contingent on a positive endorsement. More Info
A de minimis incentive was given to thank the reviewer for their time. The incentive was not used to bias or drive a particular response, nor was the incentive contingent on a positive endorsement. More Info