
Chin Uba (MBA, MSc, MCITP, MCSE)
IT Division Manager
Chose Longview Analytics
| Product | Rating | Most Used By | Product Summary | Starting Price |
|---|---|---|---|---|
 Bizview | Small Businesses (1-50 employees) | Replacing the suite of apps from BizNet Software, which was acquired by Insightsoftware, Bizview’s cloud-based platform delivers a way for users to leverage planning capabilities and work on budgeting, forecasting, and reporting tasks from any location with internet connectivity. | N/A | |
Longview Analytics | N/A | Longview Analytics is a reporting tool used to create custom dashboards to enable teams to monitor company-wide activities and implement performance-enhancing changes. It is used to improve resource management and strategic impact. | N/A | |
 Microsoft BI (MSBI) | N/A | Microsoft BI is a business intelligence product used for data analysis and generating reports on server-based data. It features unlimited data analysis capacity with its reporting engine, SQL Server Reporting Services alongside ETL, master data management, and data cleansing. | $14 per month per user |
| Bizview | Longview Analytics | Microsoft BI (MSBI) | ||||||||||||||||||||||
|---|---|---|---|---|---|---|---|---|---|---|---|---|---|---|---|---|---|---|---|---|---|---|---|---|
| Editions & Modules | No answers on this topic | No answers on this topic |
| |||||||||||||||||||||
| Offerings |
| |||||||||||||||||||||||
| Entry-level Setup Fee | No setup fee | No setup fee | No setup fee | |||||||||||||||||||||
| Additional Details | — | — | — | |||||||||||||||||||||
| More Pricing Information | ||||||||||||||||||||||||
| Bizview | Longview Analytics | Microsoft BI (MSBI) | |
|---|---|---|---|
| Considered Multiple Products | Bizview No answer on this topic |  Longview Analytics Chin Uba (MBA, MSc, MCITP, MCSE) IT Division Manager Chose Longview Analytics | Microsoft BI (MSBI)  Jasmeet S Babra Marketing Data Analyst Chose Microsoft BI (MSBI) |
| Bizview | Longview Analytics | Microsoft BI (MSBI) | |||||||||||||||||||||||||||
|---|---|---|---|---|---|---|---|---|---|---|---|---|---|---|---|---|---|---|---|---|---|---|---|---|---|---|---|---|---|
| BI Standard Reporting |
| ||||||||||||||||||||||||||||
| Ad-hoc Reporting |
| ||||||||||||||||||||||||||||
| Report Output and Scheduling |
| ||||||||||||||||||||||||||||
| Data Discovery and Visualization |
| ||||||||||||||||||||||||||||
| Access Control and Security |
| ||||||||||||||||||||||||||||
| Mobile Capabilities |
| ||||||||||||||||||||||||||||
| Application Program Interfaces (APIs) / Embedding |
|
| Bizview | Longview Analytics | Microsoft BI (MSBI) | |
|---|---|---|---|
| Small Businesses |  MIP Fund Accounting Score 9.1 out of 10 |  Yellowfin Score 8.7 out of 10 | Yellowfin Score 8.7 out of 10 |
| Medium-sized Companies |  Centage Score 9.4 out of 10 |  Reveal Score 10.0 out of 10 | Reveal Score 10.0 out of 10 |
| Enterprises |  OneStream Score 8.8 out of 10 |  Kyvos Semantic Layer Score 9.5 out of 10 | Kyvos Semantic Layer Score 9.5 out of 10 |
| All Alternatives | View all alternatives | View all alternatives | View all alternatives |
| Bizview | Longview Analytics | Microsoft BI (MSBI) | |
|---|---|---|---|
| Likelihood to Recommend | 8.9 (20 ratings) | 7.8 (2 ratings) | 10.0 (73 ratings) |
| Likelihood to Renew | 6.1 (2 ratings) | - (0 ratings) | 8.0 (25 ratings) |
| Usability | 9.1 (3 ratings) | - (0 ratings) | 10.0 (15 ratings) |
| Availability | - (0 ratings) | - (0 ratings) | 9.5 (2 ratings) |
| Performance | - (0 ratings) | - (0 ratings) | 7.0 (2 ratings) |
| Support Rating | 9.1 (3 ratings) | - (0 ratings) | 8.9 (15 ratings) |
| In-Person Training | - (0 ratings) | - (0 ratings) | 6.9 (3 ratings) |
| Online Training | - (0 ratings) | - (0 ratings) | 8.5 (2 ratings) |
| Implementation Rating | 9.1 (3 ratings) | - (0 ratings) | 9.6 (7 ratings) |
| Configurability | - (0 ratings) | - (0 ratings) | 10.0 (2 ratings) |
| Bizview | Longview Analytics | Microsoft BI (MSBI) | |
|---|---|---|---|
| Likelihood to Recommend | Insightsoftware, Inc
| Insightsoftware, Inc
 Erik Jansma arcplan BI architect | Microsoft
 Adam Montgomery Partnership Manager |
| Pros | Insightsoftware, Inc
 Ryan Palumbo Accounting Manager | Insightsoftware, Inc
Chin Uba (MBA, MSc, MCITP, MCSE) IT Division Manager | Microsoft
 Nilufa Hossain IT Specialist |
| Cons | Insightsoftware, Inc
 Viola Avery Staff Accountant | Insightsoftware, Inc
Erik Jansma arcplan BI architect | Microsoft
|
| Likelihood to Renew | Insightsoftware, Inc
 Lisa Beach ERP and Business Intelligence Consultant | Insightsoftware, Inc No answers on this topic | Microsoft
 Lee Cullom President |
| Usability | Insightsoftware, Inc
 Rick Findley BS, MS, CGFM auditor | Insightsoftware, Inc No answers on this topic | Microsoft
|
| Reliability and Availability | Insightsoftware, Inc No answers on this topic | Insightsoftware, Inc No answers on this topic | Microsoft
 Robert Goodman Director, Business Intelligence & Analytics |
| Performance | Insightsoftware, Inc No answers on this topic | Insightsoftware, Inc No answers on this topic | Microsoft
Robert Goodman Director, Business Intelligence & Analytics |
| Support Rating | Insightsoftware, Inc
| Insightsoftware, Inc No answers on this topic | Microsoft
|
| In-Person Training | Insightsoftware, Inc No answers on this topic | Insightsoftware, Inc No answers on this topic | Microsoft
 Stephanie Grice Business Intelligence Analyst |
| Online Training | Insightsoftware, Inc No answers on this topic | Insightsoftware, Inc No answers on this topic | Microsoft
 Sean Brady Business Intelligence Architect |
| Implementation Rating | Insightsoftware, Inc
Rick Findley BS, MS, CGFM auditor | Insightsoftware, Inc No answers on this topic | Microsoft
 Jacob Saunders National Practice Director - Business Intelligence |
| Alternatives Considered | Insightsoftware, Inc
| Insightsoftware, Inc
Chin Uba (MBA, MSc, MCITP, MCSE) IT Division Manager | Microsoft
|
| Return on Investment | Insightsoftware, Inc
 Sherma Thorne Accounting Associate | Insightsoftware, Inc No answers on this topic | Microsoft
 Haibo Yang BI Reporting Specialist |
| ScreenShots | Bizview Screenshots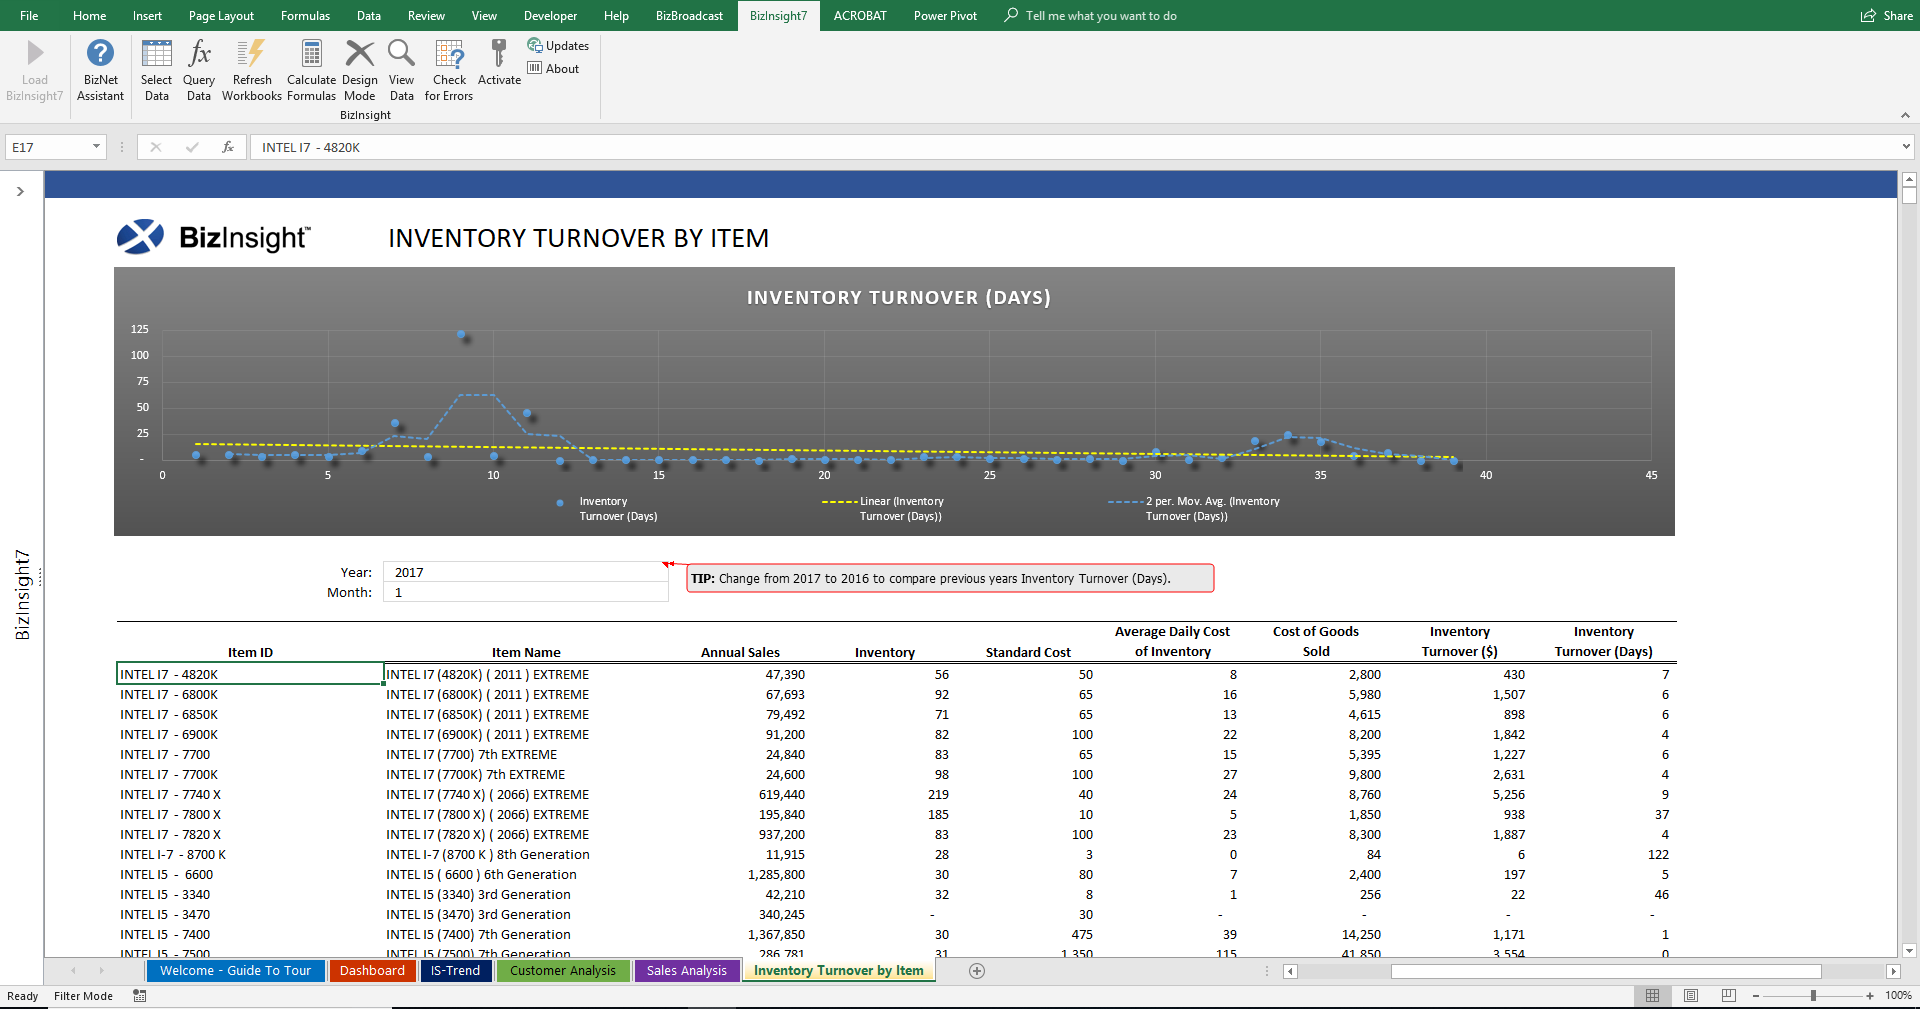 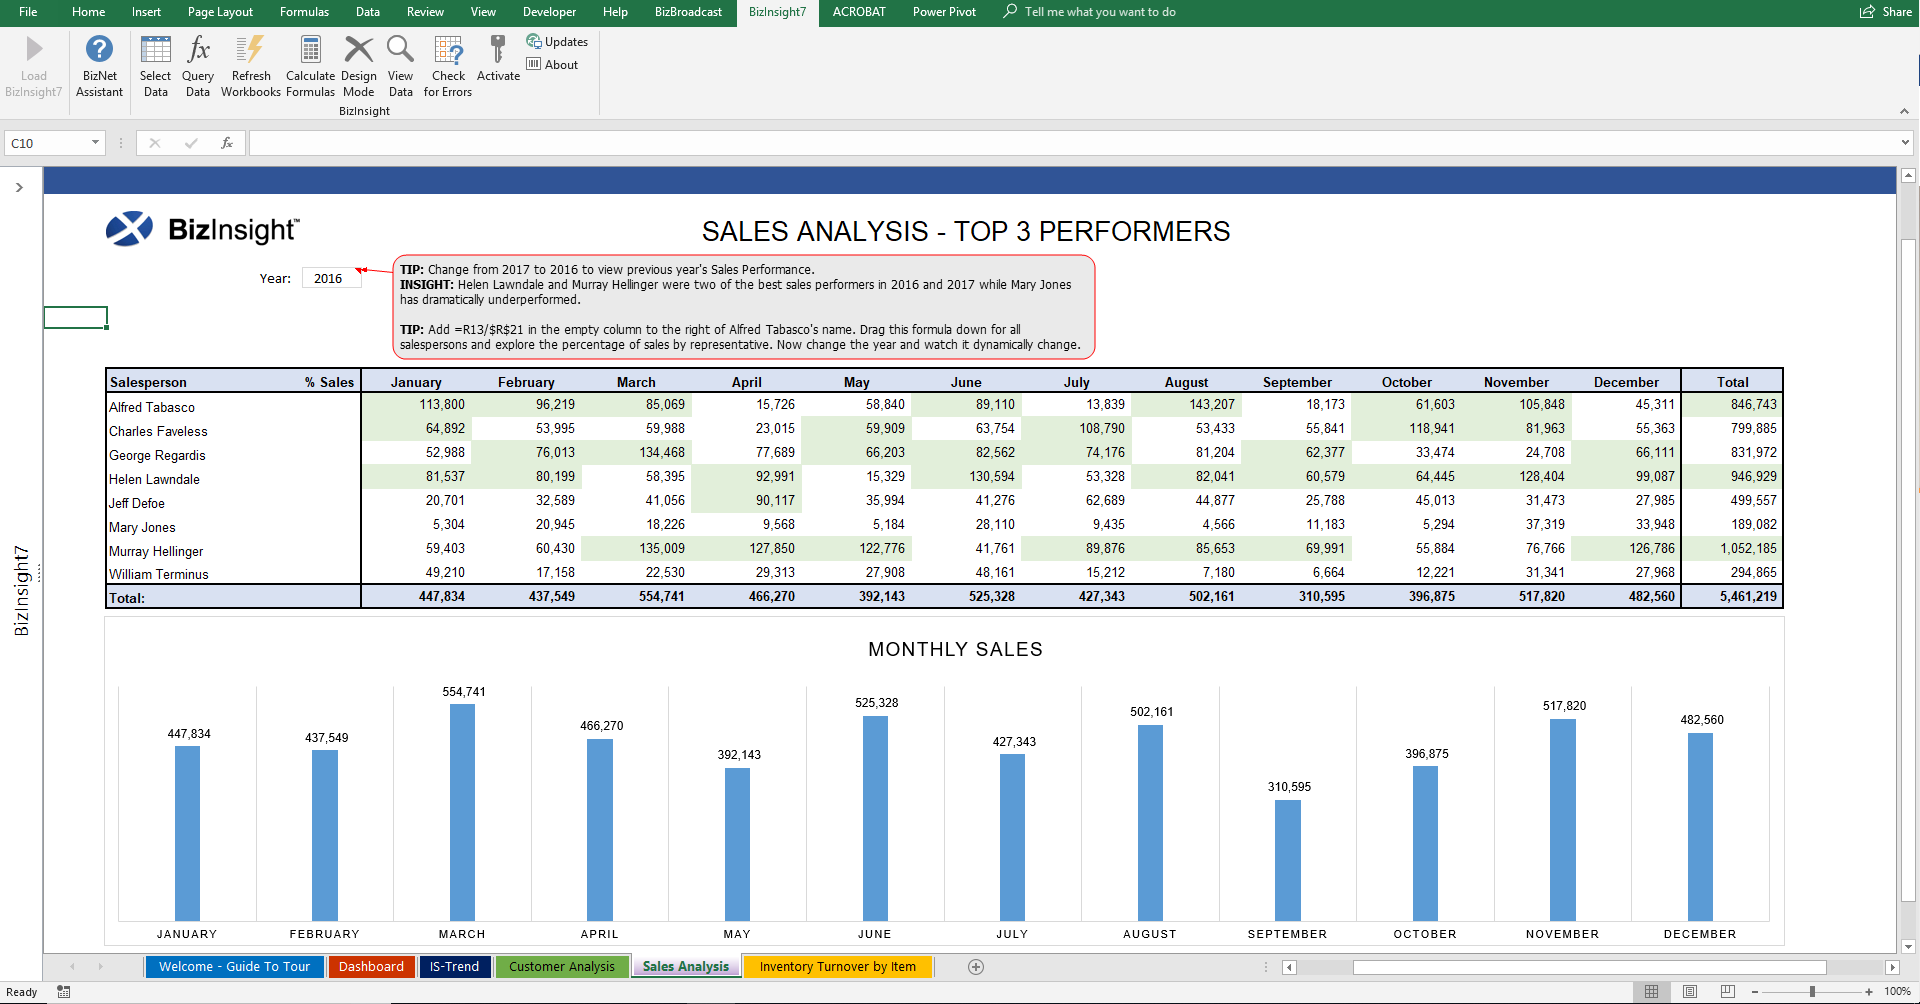  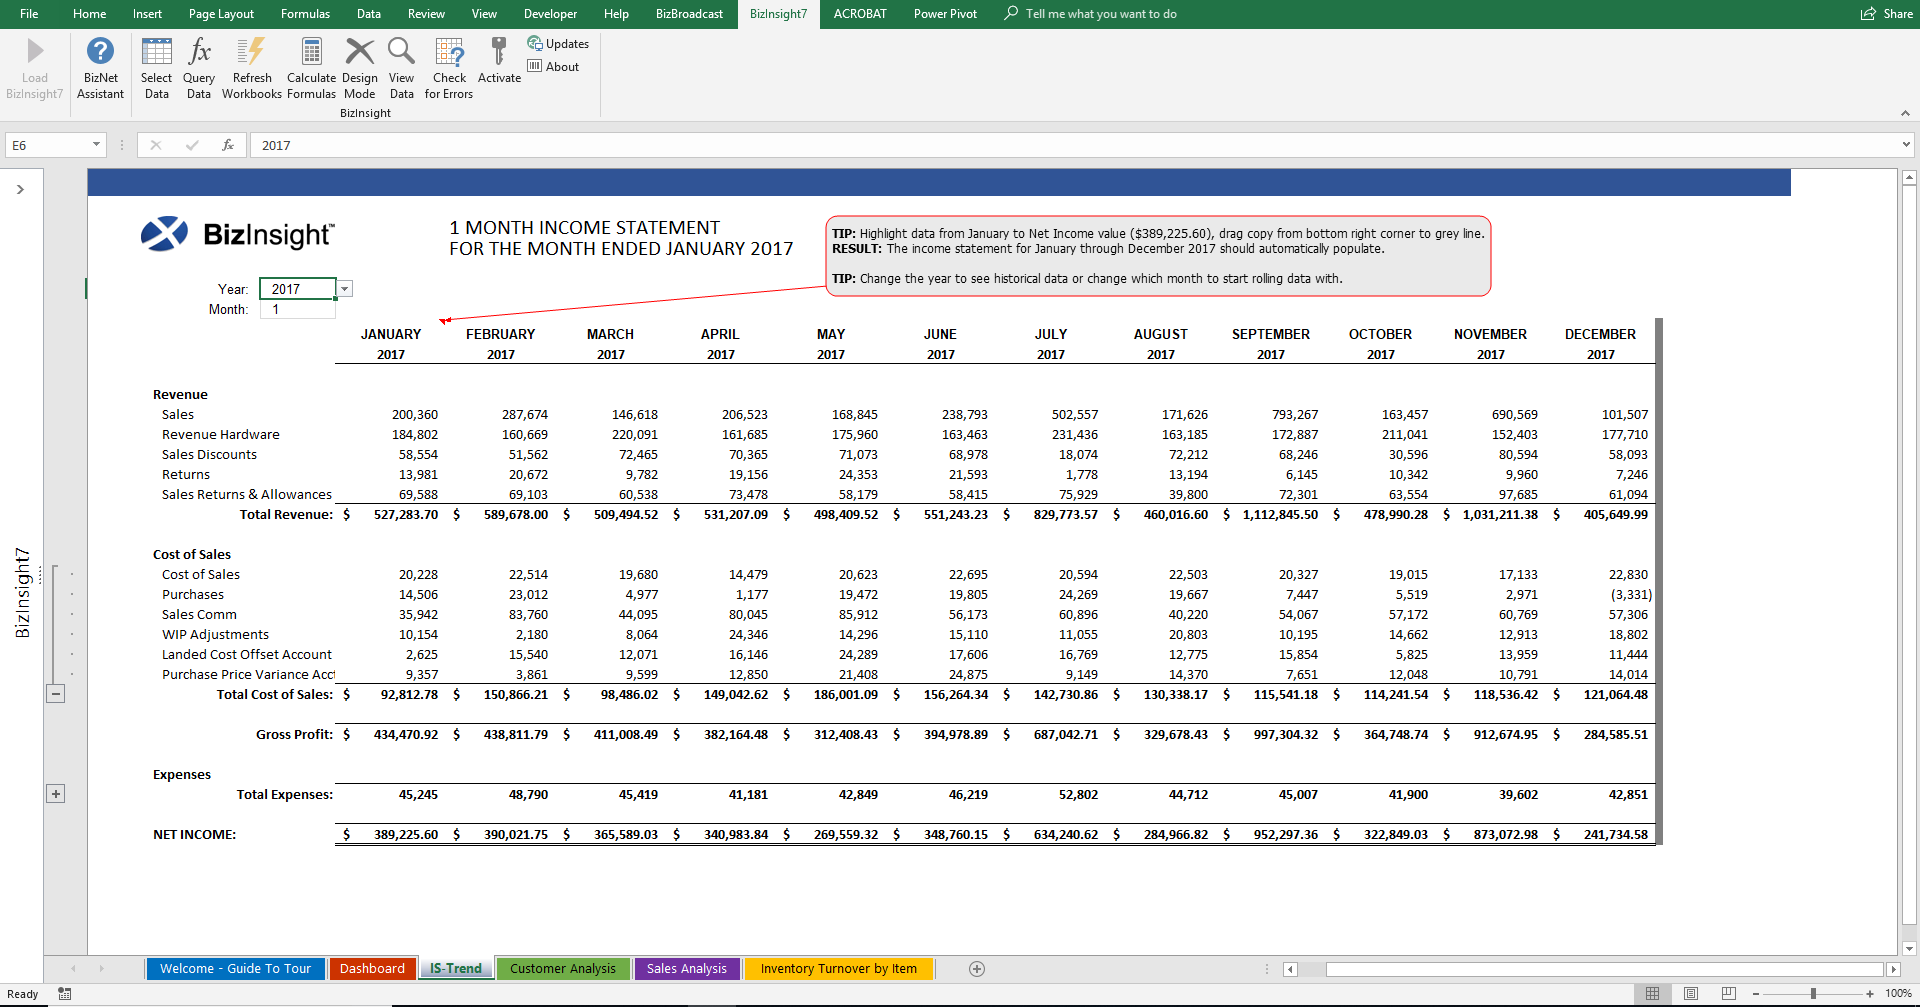 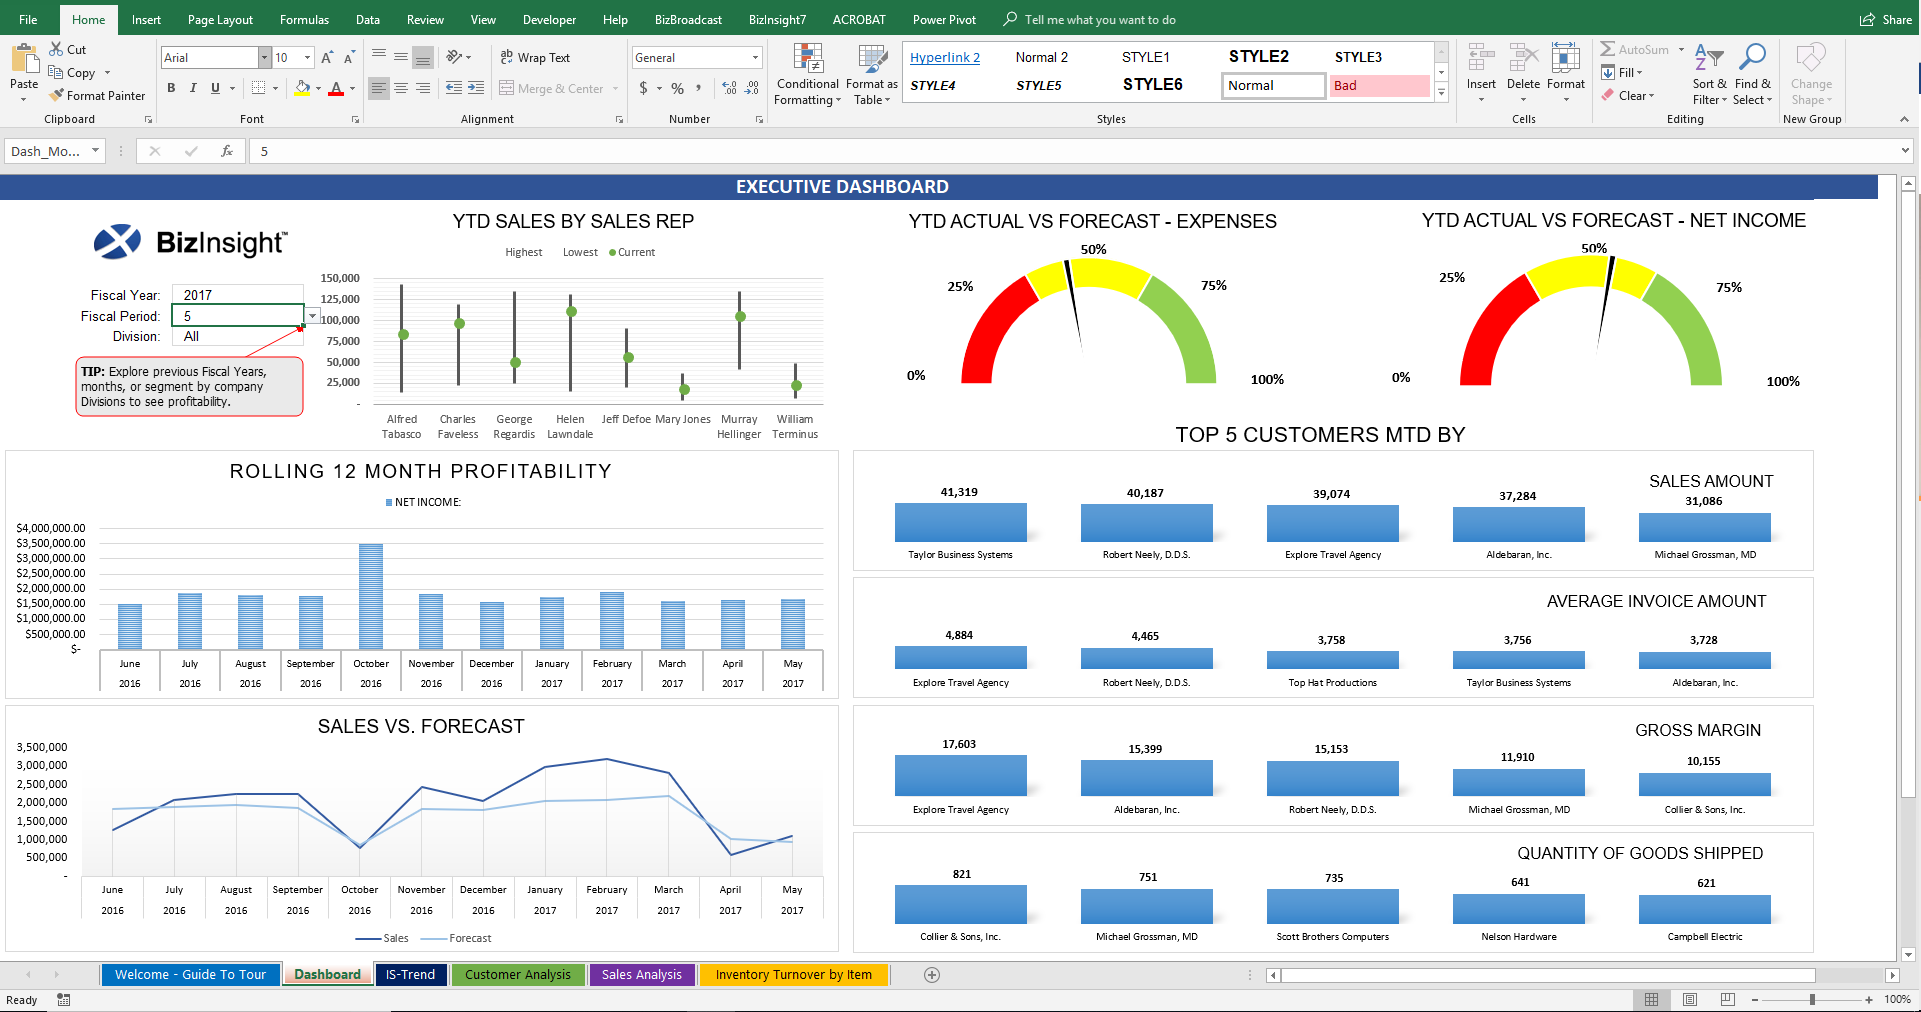 |