Looker Studio vs. SAP Crystal
Looker Studio vs. SAP Crystal
| Product | Rating | Most Used By | Product Summary | Starting Price |
|---|---|---|---|---|
 Looker Studio | N/A | Looker Studio is a data visualization platform that transforms data into meaningful presentations and dashboards with customized reporting tools. | $9 per month per user per project | |
 SAP Crystal | N/A | SAP Crystal is an analytics and reporting software solution for SMBs. SAP Crystal comprises Crystal Reports for pixel-perfect reporting, and SAP Crystal Server for automated distribution and self-service access to reports, dashboards and data exploration. | $295 per single user license |
| Looker Studio | SAP Crystal | |||||||||||||||
|---|---|---|---|---|---|---|---|---|---|---|---|---|---|---|---|---|
| Editions & Modules |
|
| ||||||||||||||
| Offerings |
| |||||||||||||||
| Entry-level Setup Fee | No setup fee | Optional | ||||||||||||||
| Additional Details | — | * SAP Crystal Reports 2020 Viewer allows you to view static data within a SAP Crystal Reports file. * SAP Crystal Reports 2020 - Full version allows you to create powerful, richly formatted, and dynamic reports from virtually any data source, delivered in dozens of formats, in up to 28 languages. If you already have an older version of Crystal Reports, buy a license for SAP Crystal Reports 2020 - Upgrade at a discounted, upgrade price. * SAP Crystal Server 2020, 1 NUL includes 1 license of: SAP Crystal Reports 2020 - SAP Crystal Server 2020. * As an add-on to SAP Crystal Server 2020 1 NUL, SAP Crystal Server 2020 5 CAL allows you to support a wider, intermittent audience of end users, up to five logged on at the same time. | ||||||||||||||
| More Pricing Information | ||||||||||||||||
| Looker Studio | SAP Crystal |
|---|
| Looker Studio | SAP Crystal | |||||||||||||||||||||
|---|---|---|---|---|---|---|---|---|---|---|---|---|---|---|---|---|---|---|---|---|---|---|
| BI Standard Reporting |
| |||||||||||||||||||||
| Ad-hoc Reporting |
| |||||||||||||||||||||
| Report Output and Scheduling |
| |||||||||||||||||||||
| Data Discovery and Visualization |
| |||||||||||||||||||||
| Access Control and Security |
| |||||||||||||||||||||
| Mobile Capabilities |
| |||||||||||||||||||||
| Application Program Interfaces (APIs) / Embedding |
|
| Looker Studio | SAP Crystal | |
|---|---|---|
| Small Businesses |  Supermetrics Score 9.8 out of 10 |  Yellowfin Score 8.6 out of 10 |
| Medium-sized Companies | Supermetrics Score 9.8 out of 10 |  Reveal Score 10.0 out of 10 |
| Enterprises |  IBM Analytics Engine Score 7.1 out of 10 |  Kyvos Semantic Layer Score 9.5 out of 10 |
| All Alternatives | View all alternatives | View all alternatives |
| Looker Studio | SAP Crystal | |
|---|---|---|
| Likelihood to Recommend | 8.4 (63 ratings) | 6.9 (159 ratings) |
| Likelihood to Renew | 9.0 (1 ratings) | 10.0 (19 ratings) |
| Usability | 8.4 (14 ratings) | 7.2 (31 ratings) |
| Availability | - (0 ratings) | 8.0 (1 ratings) |
| Performance | - (0 ratings) | 8.0 (1 ratings) |
| Support Rating | 6.7 (10 ratings) | 8.6 (21 ratings) |
| In-Person Training | - (0 ratings) | 10.0 (1 ratings) |
| Implementation Rating | - (0 ratings) | 8.8 (14 ratings) |
| Configurability | - (0 ratings) | 8.0 (1 ratings) |
| Ease of integration | - (0 ratings) | 7.0 (1 ratings) |
| Product Scalability | - (0 ratings) | 7.0 (1 ratings) |
| Vendor post-sale | - (0 ratings) | 8.0 (1 ratings) |
| Vendor pre-sale | - (0 ratings) | 7.0 (1 ratings) |
| Looker Studio | SAP Crystal | |
|---|---|---|
| Likelihood to Recommend | Google
 Jake Bodmer Mentor | SAP
|
| Pros | Google
| SAP
|
| Cons | Google
| SAP
 Frank Hunt Business Development Manager |
| Likelihood to Renew | Google
 Janaye Steadman Director of Social Media | SAP
|
| Usability | Google
| SAP
 Greg Goss SQL Database and Business Intelligence Manager |
| Support Rating | Google
 Jordan Comstock Digital Marketing Specialist | SAP
 Nathan Patrick Taylor Clinical Informatics Consultant |
| In-Person Training | Google No answers on this topic | SAP
|
| Implementation Rating | Google No answers on this topic | SAP
|
| Alternatives Considered | Google
 Shelby Kolb Data Analyst | SAP
|
| Return on Investment | Google
 Scott Walker Director of Digital Marketing | SAP
 Rohit Narang Assistant Vice President |
| ScreenShots | SAP Crystal Screenshots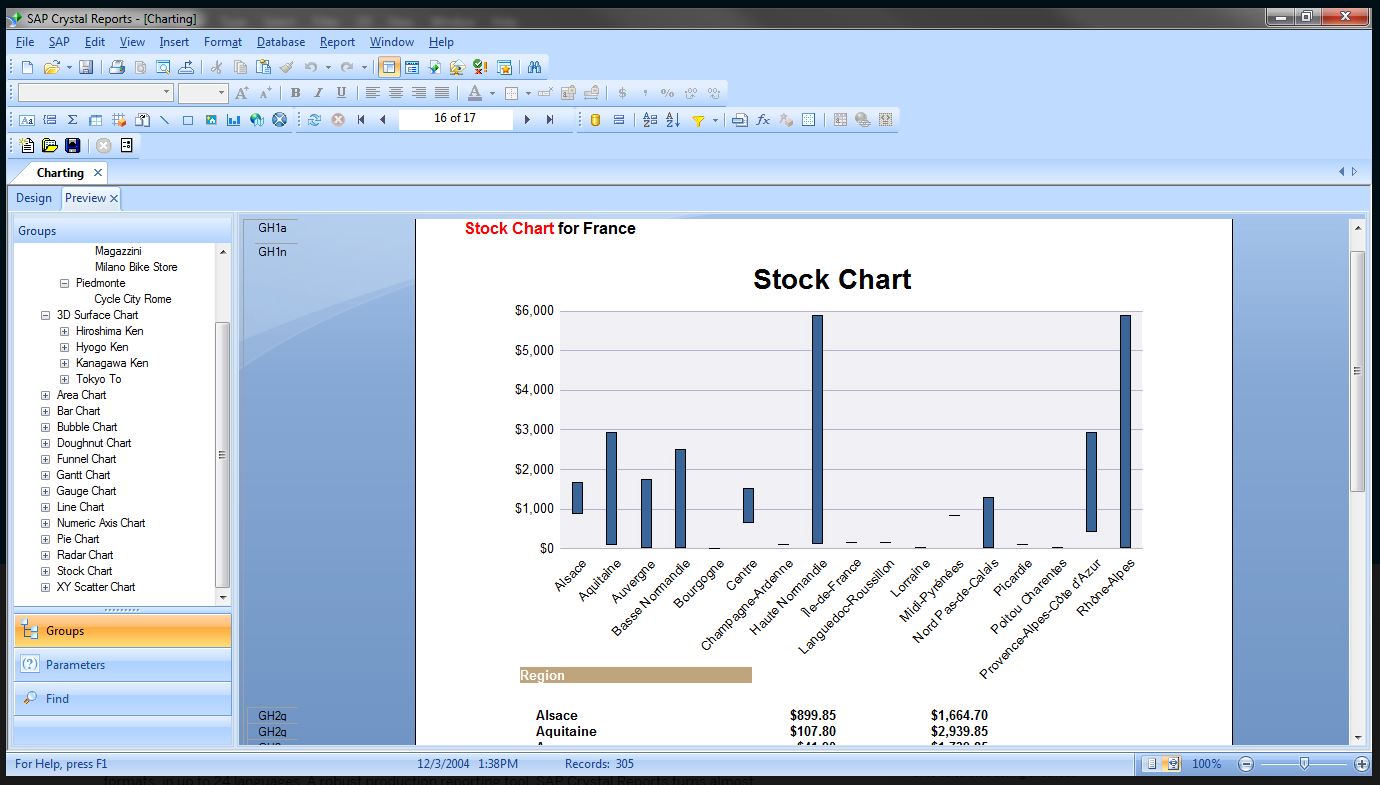   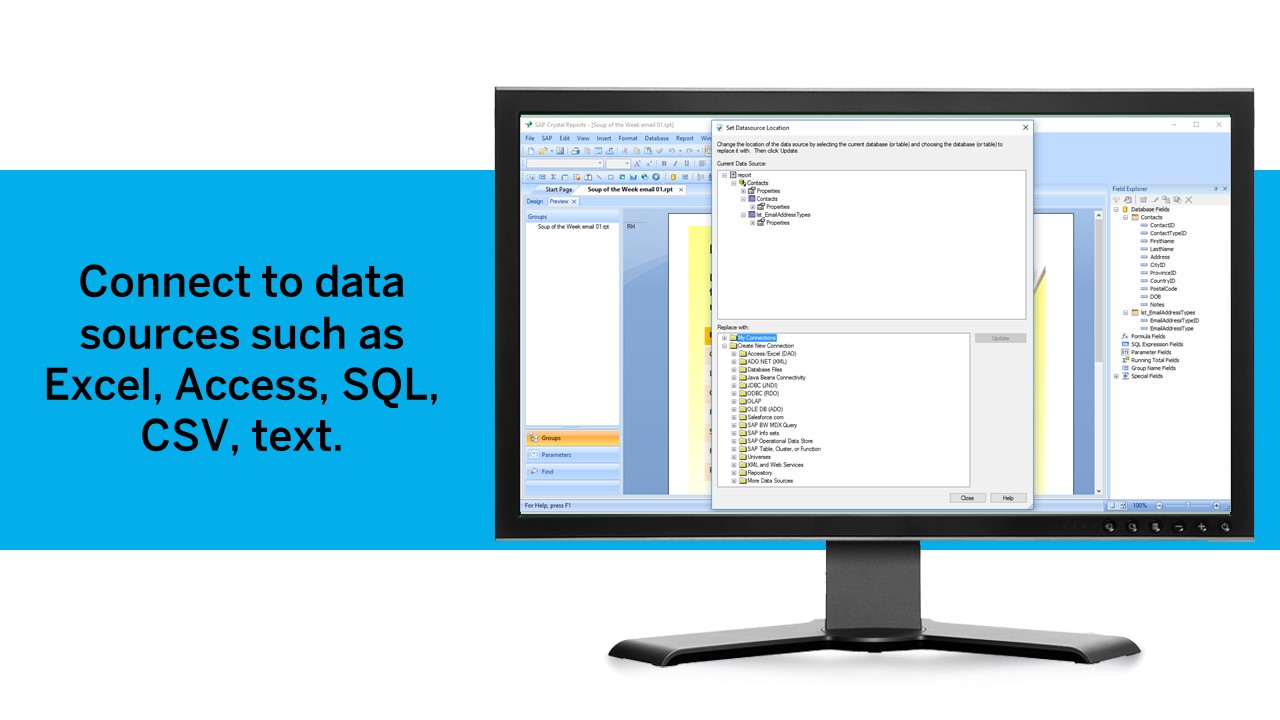 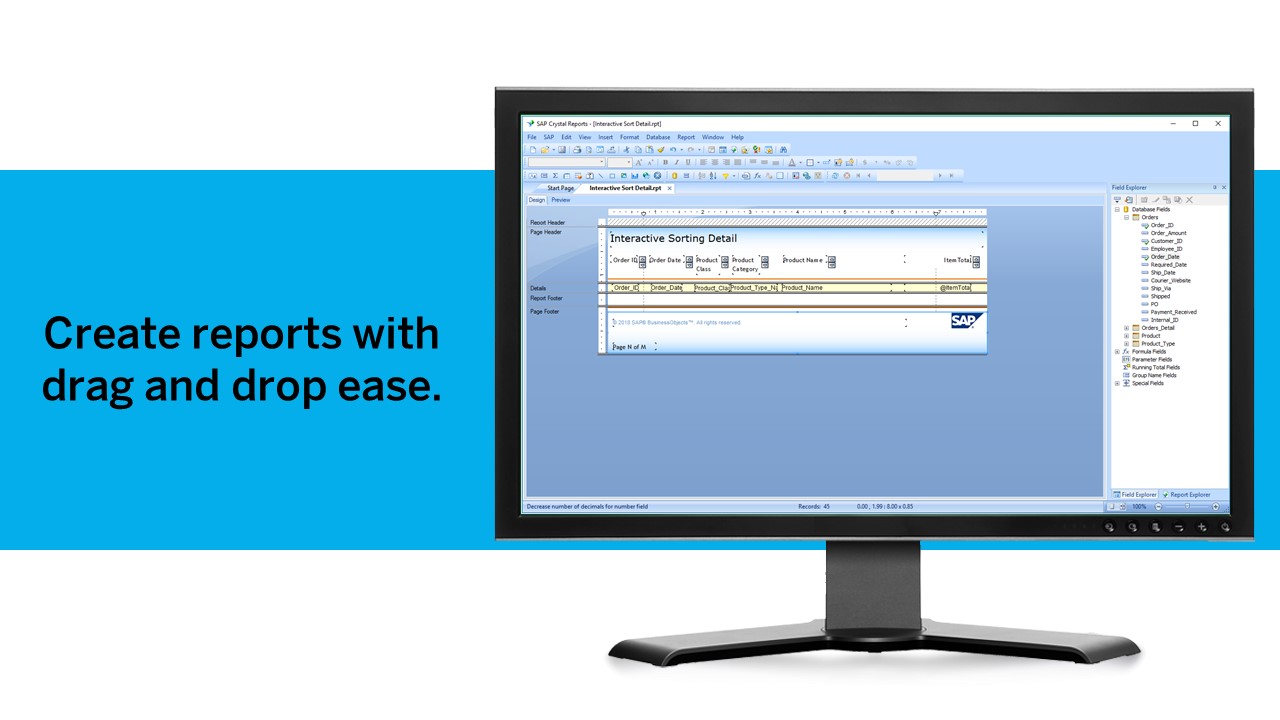  |