Looker Studio is a data visualization platform that transforms data into meaningful presentations and dashboards with customized reporting tools.
$9
per month per user per project
TapClicks
Score 8.1 out of 10
N/A
TapClicks is a leading marketing technology company for agencies, media companies, brands, and enterprises. Its integrated Marketing Operations Platform includes workflow and order management, analytics, and automated reporting -- all within a single intuitive user interface available on demand in the cloud. TapClicks has delivered over 1,000,000 dashboards to over 5,000 brands and over 500 media companies and agencies worldwide. The TapClicks platform leverages over 150 native API…
N/A
Pricing
Looker Studio
TapClicks
Editions & Modules
Looker Studio Pro
$9
per month per user per project
Looker Studio
No charge
No answers on this topic
Offerings
Pricing Offerings
Looker Studio
TapClicks
Free Trial
No
Yes
Free/Freemium Version
Yes
No
Premium Consulting/Integration Services
No
Yes
Entry-level Setup Fee
No setup fee
No setup fee
Additional Details
—
TapClicks offers a subscription on a month-to-month basis. We offer multiple packages catered to your needs. Try us out for free, no credit card required.
For larger portfolios, tapclicks is more efficient and cost-effective. The design, colors and whatnot are more professional than other tools and their customer services is very on top.
Visualizing cross-channel campaign performance can blend data from a few different sources to compare performance metrics like spend, clicks, and conversions side-by-side in a single view, which helps in quick budget reallocation decisions. When dealing with massive volumes of data (millions of rows) or highly complex queries, Looker Studio dashboards can become slow, laggy, or even crash. Performance issues are a frequent complaint when working with large datasets, making it unsuitable for enterprise-level companies
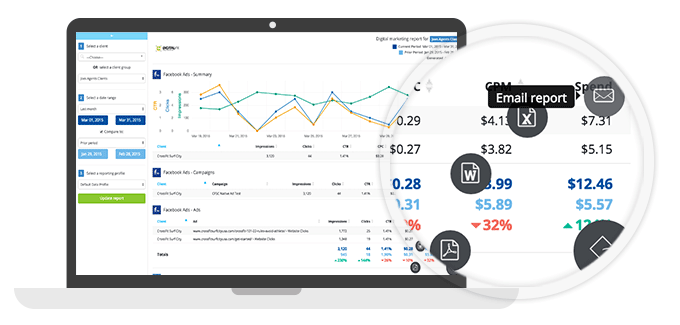
For advertising agencies and marketing departments looking to aggregate and consolidate marketing, advertising, and website analytics performance data into one centralized platform, TapClicks is a market-leading solution. TapClicks provides customizable modules, charts, and graphs to make visual sense of your data. TapClicks is designed for organizations that are trying to import reporting data across multiple marketing, advertising, and web analytics platforms. It probably does not makes sense to license TapClicks if you are just getting started with your digital marketing and are only utilizing 1 or 2 third-party platforms that TapClicks has an API connection with, it's probably premature for your organization to invest in TapClicks.
Breath of data - the number of ways to interrogate the data is endless, and the options to view metrics alongside each other make for comprehensive datasets.
Data visualisation and customisation - the options for presenting data and separating out across pages allow for clean visuals and segmented information.
Easy shareability/usability - a quick and simple tool to introduce colleagues to, and easy to grant access for them to be able to view the data, without having to understand the setup itself.
Customizable dashboards: these are easy to set-up and manage and tell a powerful story. We appreciate that they can be exported.
Import Wizard: it's very important that we are able to include custom data points in our reports through the Import Wizard. After a short learning curve, we are not importing data on a weekly basis for a comprehensive report that not only shows marketing trends, but the business results too.
Groups and Clusters: The ability to manage client groups and clusters has been vital to how we report out to the client.
It needs better handling of complex logic. We often need workarounds to perform complex custom calculations, and it can be really unpleasant at times.
Felt it got slow with a larger data set, and in one minor report, we had to set up time filters so that calculations during spikes could be traced more quickly.
Compare to competition they need to improve with notification things.
The support team sometimes isn't very responsive, and I can go a week without hearing from the TapClicks team on an open issue.
I would love to have the categories feature enhanced so that I could combine several services, and be able to break out reporting by the flights/adgroups/lineitems within those services.
I would love for the custom dashboards that are created to be integrated into reporting so that, for example, I could use the Categories dashboard as the title page of an exported report.
It is the simplest and least expensive way for us to automate our reporting at this time. I like the ability to customize literally everything about each report, and the ability to send out reports automatically in emails. The only issue we have been having recently is a technical glitch in the automatic email report. Sadly, there is almost no support for this tool from Google, but is also free, so that is important to take into consideration
Looker Studio is easy to use, and it offers a sufficient variety of predefined visualizations to choose from. It's easy for us, and anyone can set up basic reporting without extensive data visualization skills. The interface layout is easy to understand, and it doesn't take long to get used to.
TapClicks provides an array of on-demand training videos coupled with account management support to help your organization get up and running. That being said, TapClicks integrates with hundreds of marketing, advertising, CRM, and website analytics third-party platforms, so depending on how many integrations you want to activate, it can be a steep learning curve. Overall, we like the usability of the product.
I give it a lower support rating because it seems like our Dev team hasn't gotten the support they need to set up our database to connect. Seems like we hit a roadblock and the project got put on pause for dev. That sucks for me because it is harder to get the dev team to focus on it if they don't get the help they need to set it up.
Our organization experienced a very thorough onboarding process that helped us get up and running with TapClicks. It's pretty easy to integrate or "connect" with other platforms. We have developed a long-term relationship with our Account Manager at TapClicks and we really value her support. In today's world, most technology companies change your Account Manager seemingly almost every year, but that has not been the case with TapClicks.
Looker Studio is far easier to implement, stand up, and learn. The interface is simpler and user-friendly for various levels of data visualization/analysis knowledge and experience. The biggest benefit of Looker Studio, however, is its ease of connection to GA data and speed. Furthermore, since it is an online program/tool, it requires less CPU/battery/storage on the user's device.
The companies I interviewed are either limited in the number of APIs built with the data source, especially with DFP. Some of them charge us cloud storage fees. TapClicks came in with enthusiasm and so far they have helped us jump start the building of dashboards for our clients.