Microsoft BI is a business intelligence product used for data analysis and generating reports on server-based data. It features unlimited data analysis capacity with its reporting engine, SQL Server Reporting Services alongside ETL, master data management, and data cleansing.
$14
per month per user
OpenText Magellan
Score 9.0 out of 10
N/A
OpenText Magellan Analytics Suite leverages a comprehensive set of data analytics software to identify patterns, relationships and trends through data visualizations and interactive dashboards.
N/A
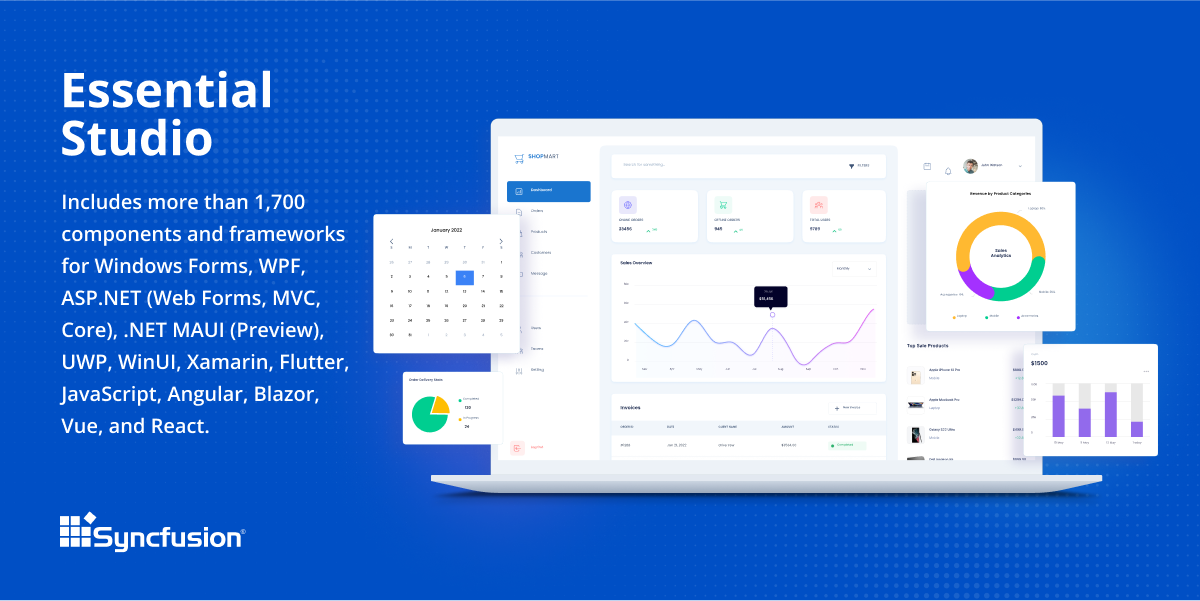
Syncfusion Essential Studio
Score 6.7 out of 10
N/A
Since 2002, Essential Studio® has supported the development of software applications across industries and economic sectors, in both public and private enterprises.
$0
with the Syncfusion Community License. It includes free access to all 1,700+ controls and is available to companies and individuals with less than $1 million USD in annual gross revenue and 5 or fewer developers.
Pricing
Microsoft BI (MSBI)
OpenText Magellan
Syncfusion Essential Studio
Editions & Modules
Power BI Pro
$14
per month per user
Power BI Premium
$24
per month per user
No answers on this topic
Essential Studio - Syncfusion Community License
$0
*up to 5 developers
Essential Studio - UI Edition
Custom Quote
per year Packages to suit teams of all sizes
Essential Studio - Document SDK
Custom Quote
per year Packages to suit teams of all sizes
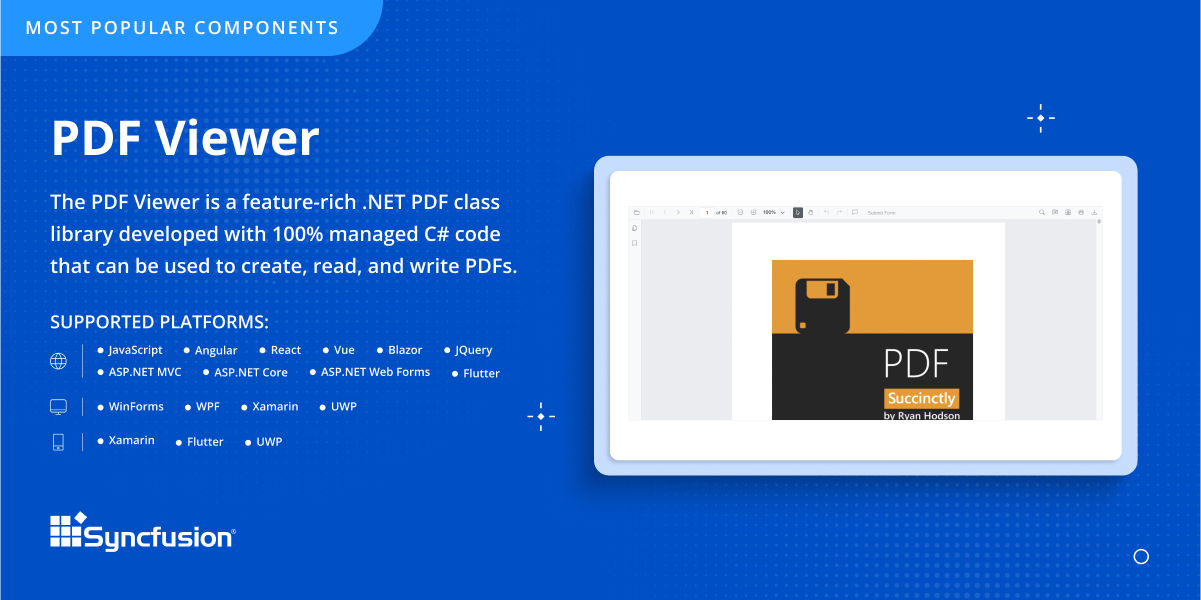
Essential Studio - PDF Viewer
Custom Quote
per year Packages to suit teams of all sizes
Essential Studio - DOCX Editor
Custom Quote
per year Packages to suit teams of all sizes
Essential Studio - Spreadsheet Editor
Custom Quote
per year Packages to suit teams of all sizes
Offerings
Pricing Offerings
Microsoft BI (MSBI)
OpenText Magellan
Syncfusion Essential Studio
Free Trial
No
No
Yes
Free/Freemium Version
Yes
No
Yes
Premium Consulting/Integration Services
No
No
No
Entry-level Setup Fee
No setup fee
No setup fee
No setup fee
Additional Details
—
—
*The Syncfusion Community License includes free access to all 1,600+ controls and is available to companies and individuals with less than $1 million USD in annual gross revenue and 5 or fewer developers.
TIBCO Spotfire is better in loading multiple data sources, a bit faster on data mining, but not so nice on the dashboard side if this needs to be accessed by several users. On the other hand, Microsoft BI is perfect for an online dashboard.
Microsoft BI is very well suited to implement reporting and visualization within departments. Choosing Microsoft BI over tools like Tableau is the variety of third party apps it extracts data from. This functionality is limited in Tableau as it digests data from large data …
Oracle is primarily one amongst the leader in ERP applications and they have quite easily leveraged their BI products to offer pre-built dashboard and operational reporting which is received well by the users. But with Microsoft BI there are host of other features which beats …
-Tableau is clearly more cutting edge when it comes to data visualization and connecting to multiple data sources (support for MongoDB, Hadoop, etc). -Assuming your data is not that sophisticated, Microsoft BI is a great product. I would say its a good "all around" BI tool. It …
Microsoft BI has a lot of features and is a very powerful tool, especially if you have folks on your team that know how to utilize all of its capabilities. To truly unlock all that it can do, it does require people to have a deep understanding of its capabilities. That's where the software really shines. If you are looking for a simpler, more basic reporting tool, there are other programs available that do not require such a steep learning curve.
If you do not have a large budget and are a large organization, I would steer clear of Actuate. If you are looking to do very complex washboarding, I would not use them. Your developers have to be very skilled to work with this. Plan to bring in consultants if necessary to help your process. Adhoc reporting is weak. If your pricing is user based and you expand, this could be very expensive.
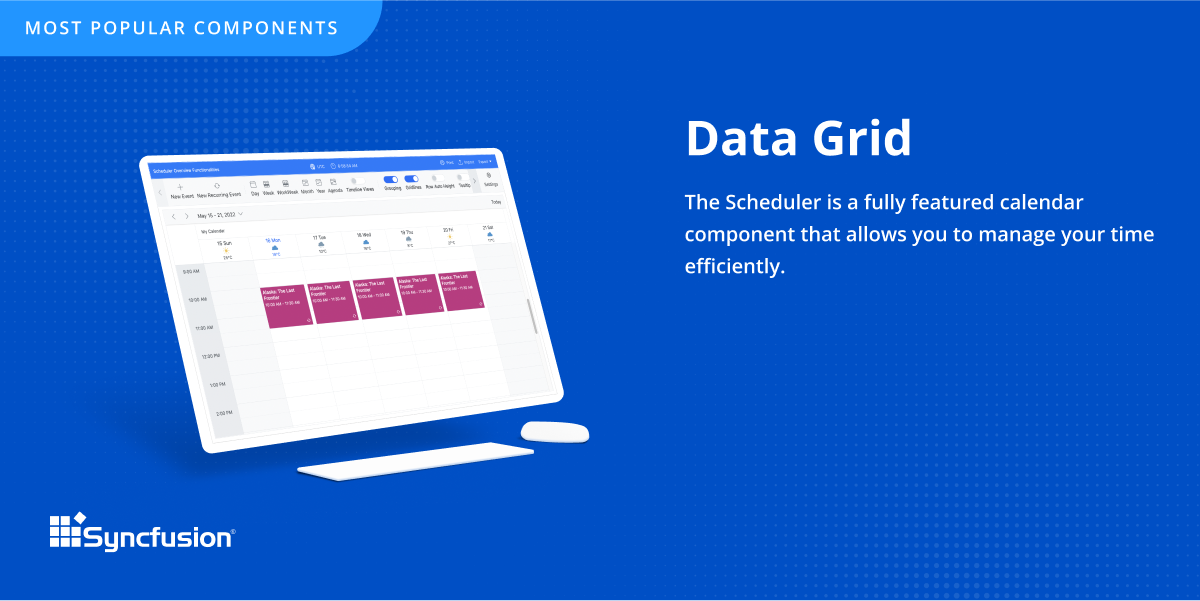
The datagrid is probably their most popular control I would think. It is so flexible and configurable. Most of mine are plain views in ASP.NET Core, but I have a whole bunch that are dynamically created at runtime in my controller. That is so powerful.
Sometimes links point to dead addresses in the documentation.
Some components have a difficult learning curve but that is usually due to the complexity of the control.
Minor version changes introduce breaking changes, for example updating from 20.1.x to 20.2.x gives us licensing errors, which in my opinion is a kind of breaking change as it requires all users to update their licenses.
Theming with CSS variables is not possible. Access to Theme Studio code is not possible. So a fully custom solution is needed to make Syncfusion Essential Studio Enterprise Edition components themeable with CSS variables.
Microsoft BI is fundamental to our suite of BI applications. That being said, Northcraft Analytics is focused on delighting our customers, so if the underlying factors of our decision change, we would choose to re-write our BI applications on a different stack. Luckily, mathematics are the fundamental IP of our technology... and is portable across all BI platforms for the foreseeable future.
I am no longer working for the company that was using Actuate but I believe they would continue to use it because the stitching costs would be to high. It would require a complete rewrite of the reports and the never version of Actuate (BIRT) even required an almost complete report rewrite
It takes effort to include a new component library into existing software, especially in our case where we have 5 large applications that are written and maintained by about 100 developers. So changing such a core thing comes with a lot of effort. The other reason we will very likely renew our use of Syncfusion Essential Studio Enterprise Edition is that it works really well and has helped us to speed up the development process.
The Microsoft BI tools have great usability for both developers and end users alike. For developers familiar with Visual Studio, there is little learning curve. For those not, the single Visual Studio IDE means not having to learn separate tools for each component. For end-users, the web interface for SSRS is simple to navigate with intuitive controls. For ad-hoc analysis, Excel can connect directly to SSAS and provide a pivot table like experience which is familiar to many users. For database development, there is beginning to be some confusion, as there are now three tool choices (VS, SSMS, Azure Data Studio) for developers. I would like to see Azure Data Studio become the superset of SSMS and eventually supplant it.
It is quite intuitive to use. It is fit specifically for doing sentiment, emotion, and intention analysis as well as text classification and text summarization. I would have given 10 if it is fit for the purpose of doing image processing and analysis as well. There is a huge market to analyze video and image data.
I would rate Syncfusion® Essential Studio® a 10 out of 10 for overall usability. The components are intuitive to implement, with clear APIs and consistent design patterns across the suite. This makes it easy for developers to get started quickly and reduces the learning curve even when working with new controls. In addition, the documentation and sample projects provide practical guidance that helps accelerate development. The built-in customization options also allow us to adapt the components to fit our branding and business requirements without excessive effort. Overall, the usability is one of the key reasons why Syncfusion has become an essential part of our development toolset.
SQL Server Reporting Services (SSRS) can drag at times. We created two report servers and placed them under an F5 load balancer. This configuration has worked well. We have seen sluggish performance at times due to the Windows Firewall.
MSBI natively has a site that allows you to vote on user enhancements and bug fixes. This allows the largest nagging issues to float to the top and the development team can prioritize accordingly. As mentioned earlier, the large community base of MSBI developers assist technical resources in handling technical questions.
Although I have decades of software development experience, I had never created a website from scratch before, and my html and css skills are not particularly strong. Between documentation and incredible dedication from the support team they helped me overcome all of my challenges. It's amazing that they typically create sample code for most of the issues that I submitted. On rare occasions where I uncovered a defect they kept me informed as to its status, and typically resolved it in a short-term release, and/or gave me a reasonable workaround. They hopped on zoom calls with me on multiple occasions when necessary.
I have used on-line training from Microsoft and from Pragmatic Works. I would recommend Pragmatic Works as the best way to get up to speed quickly, and then use the Microsoft on-line training to deep dive into specific features that you need to get depth with.
We are a consulting firm and as such our best resources are always billing on client projects. Our internal implementation has weaknesses, but that's true for any company like ours. My rating is based on the product's ease of implementation.
We have used the built in ConnectWise Manager reports and custom reports. The reports provide static data. PowerBI shows us live data we can drill down into and easily adjust parameters. It's much more useful than a static PDF report.
It is vastly superior to these in many ways, for complex reporting it is a much more sophisticated solution. Visualizations are very good. Javascript extensibility is very powerful, others don't support this or as well. Pentaho and MS are both OLAP oriented. Pentaho is moving more toward big data, which was not our primary focus. Others are stuck in the Crystal Reports Band metaphor.
Firstly, there is a free version for small businesses and it allows you to jump start without risk. I found one of the other products a bit short in the number of out-of-the-box supported events handlers for each control and, although you can manually add them, I feel more comfortable to just have them ready. After using the free version I just felt in love with Syncfusion Essential Studio Enterprise Edition controls and decided to stay with them; they have all I need and more. The usage of Syncfusion Essential Studio Enterprise Edition controls is straightforward and intuitive. Support is world-class even for the free version; you get answers in 24 hours at most. Also, the support team is ready to remotely connect to your project in case it is needed; we have had one situation like this, and the issue was solved.
As a SaaS provider we see being able to provide self-service BI to our client users as a competitive advantage. In fact the MSSQL enabled BI is a contributing factor to many winning RFPs we have done for prospective client organisations.
However MSSQL BI requires extensive knowledge and skills to design and develop data warehouses & data models as a foundation to support business analysts and users to interrogate data effectively and efficiently. Often times we find having strong in-house MSSQL expertise is a bless.
Actuate can handle 50 to 60 sub reports inside a report very well.
Dynamically creating the datasource, chart, graph, reports are the main advantages. We can do any level of drilling, and can create a performance matrix dashboard efficiently.
First of all, I think the best positive impact is the reduce of time development. I do not know exactly how much time, but certainly, using the framework we save a lot of effort and time.
About negative impact, sometimes using the controls of the framewrok have a signifcant impact in the execution time and page load.
And of course, the use of Syncfusion Essential Studio Enterprise Edition has a significant impact of the learning of javascript and JQUERY.