
Mixpanel vs. Rational BI
| Product | Rating | Most Used By | Product Summary | Starting Price |
|---|---|---|---|---|
 Mixpanel | Score8.3 out of 10 | N/A | Mixpanel helps companies measure what matters, make decisions fast, and build better products through data. With self-serve product analytics solution, teams can analyze how and why people engage, convert, and retain—in real-time, across devices—to improve their user experience. Mixpanel serves over 26,000 companies from different industries around the world, including Expedia, Uber, Ancestry, DocuSign, and Lemonade. Headquartered in San Francisco, Mixpanel has offices in New York,… | $0 per month |
 Rational BI | Score7.7 out of 10 | Enterprise companies (1,001+ employees) | Rational BI provides analytics, data science and business intelligence in an analytical platform that connects to databases, data files and cloud drives including AWS and Azure data sources, enabling users to explore and visualize data. Users can build real-time notebook-style reports directly in a web browser with JavaScript and SQL with direct and live connections to data. Filter and query data with an SQL database embedded in the client, without network… | $0 single user |
| Mixpanel | Rational BI | |||||||||||||||
|---|---|---|---|---|---|---|---|---|---|---|---|---|---|---|---|---|
| Editions & Modules |
|
| ||||||||||||||
| Offerings |
| |||||||||||||||
| Entry-level Setup Fee | No setup fee | Optional | ||||||||||||||
| Additional Details | Mixpanel uses MTU (Monthly Tracked User) pricing, which is designed to scale with your company. MTUs are roughly equivalent to the number of unique visitors on your product and each user is counted once per month, even if they use multiple devices. If Events based pricing makes more sense for your business, reach out to us and we can work with you! | Additional cost per extra user (varies by edition) | ||||||||||||||
| More Pricing Information | ||||||||||||||||
| Mixpanel | Rational BI | |
|---|---|---|
| Considered Both Products | No answer on this topic | No answer on this topic |
| Key User Insights | ||
| Would buy again | ||
86% Would buy again 12 Answers | No answers on this topic | |
| Delivers good value for the price | ||
91% Delivers good value for the price 10 Answers | No answers on this topic | |
| Happy with the feature set | ||
93% Happy with the feature set 13 Answers | No answers on this topic | |
| Lived up to sales and marketing promises | ||
88% Lived up to sales and marketing promises 7 Answers | No answers on this topic | |
| Implementation went as expected | ||
90% Implementation went as expected 9 Answers | No answers on this topic | |
| Mixpanel | Rational BI | |||||||||||||||||||
|---|---|---|---|---|---|---|---|---|---|---|---|---|---|---|---|---|---|---|---|---|
| BI Standard Reporting |
| |||||||||||||||||||
| Ad-hoc Reporting |
| |||||||||||||||||||
| Report Output and Scheduling |
| |||||||||||||||||||
| Data Discovery and Visualization |
| |||||||||||||||||||
| Mixpanel | Rational BI | |
|---|---|---|
| Small Businesses |  PostHog Score8.3 out of 10 |  Chartio (discontinued) Score7.5 out of 10 |
| Medium-sized Companies |  Heap Score8.1 out of 10 |  Jet Reports Score9.5 out of 10 |
| Enterprises |  Gainsight PX Score7.6 out of 10 |  Kibana Score8.4 out of 10 |
| All Alternatives | View all alternatives | View all alternatives |
| Mixpanel | Rational BI | |
|---|---|---|
| Likelihood to Recommend | 9.0 | 7.7 |
| Likelihood to Renew | 10.0 | - |
| Usability | 9.0 | 8.7 |
| Support Rating | 1.0 | 7.7 |
| Online Training | 8.0 | - |
| Implementation Rating | 8.9 | - |
| Mixpanel | Rational BI | |
|---|---|---|
| Likelihood to Recommend |
|
|
| Pros |
|
|
| Cons |
|
|
| Likelihood to Renew |
| No answers on this topic |
| Usability |
|
|
| Support Rating |
|
|
| Online Training |
| No answers on this topic |
| Implementation Rating |
| No answers on this topic |
| Alternatives Considered |
|
|
| Return on Investment |
|
|
| ScreenShots | Mixpanel Screenshots   | Rational BI Screenshots  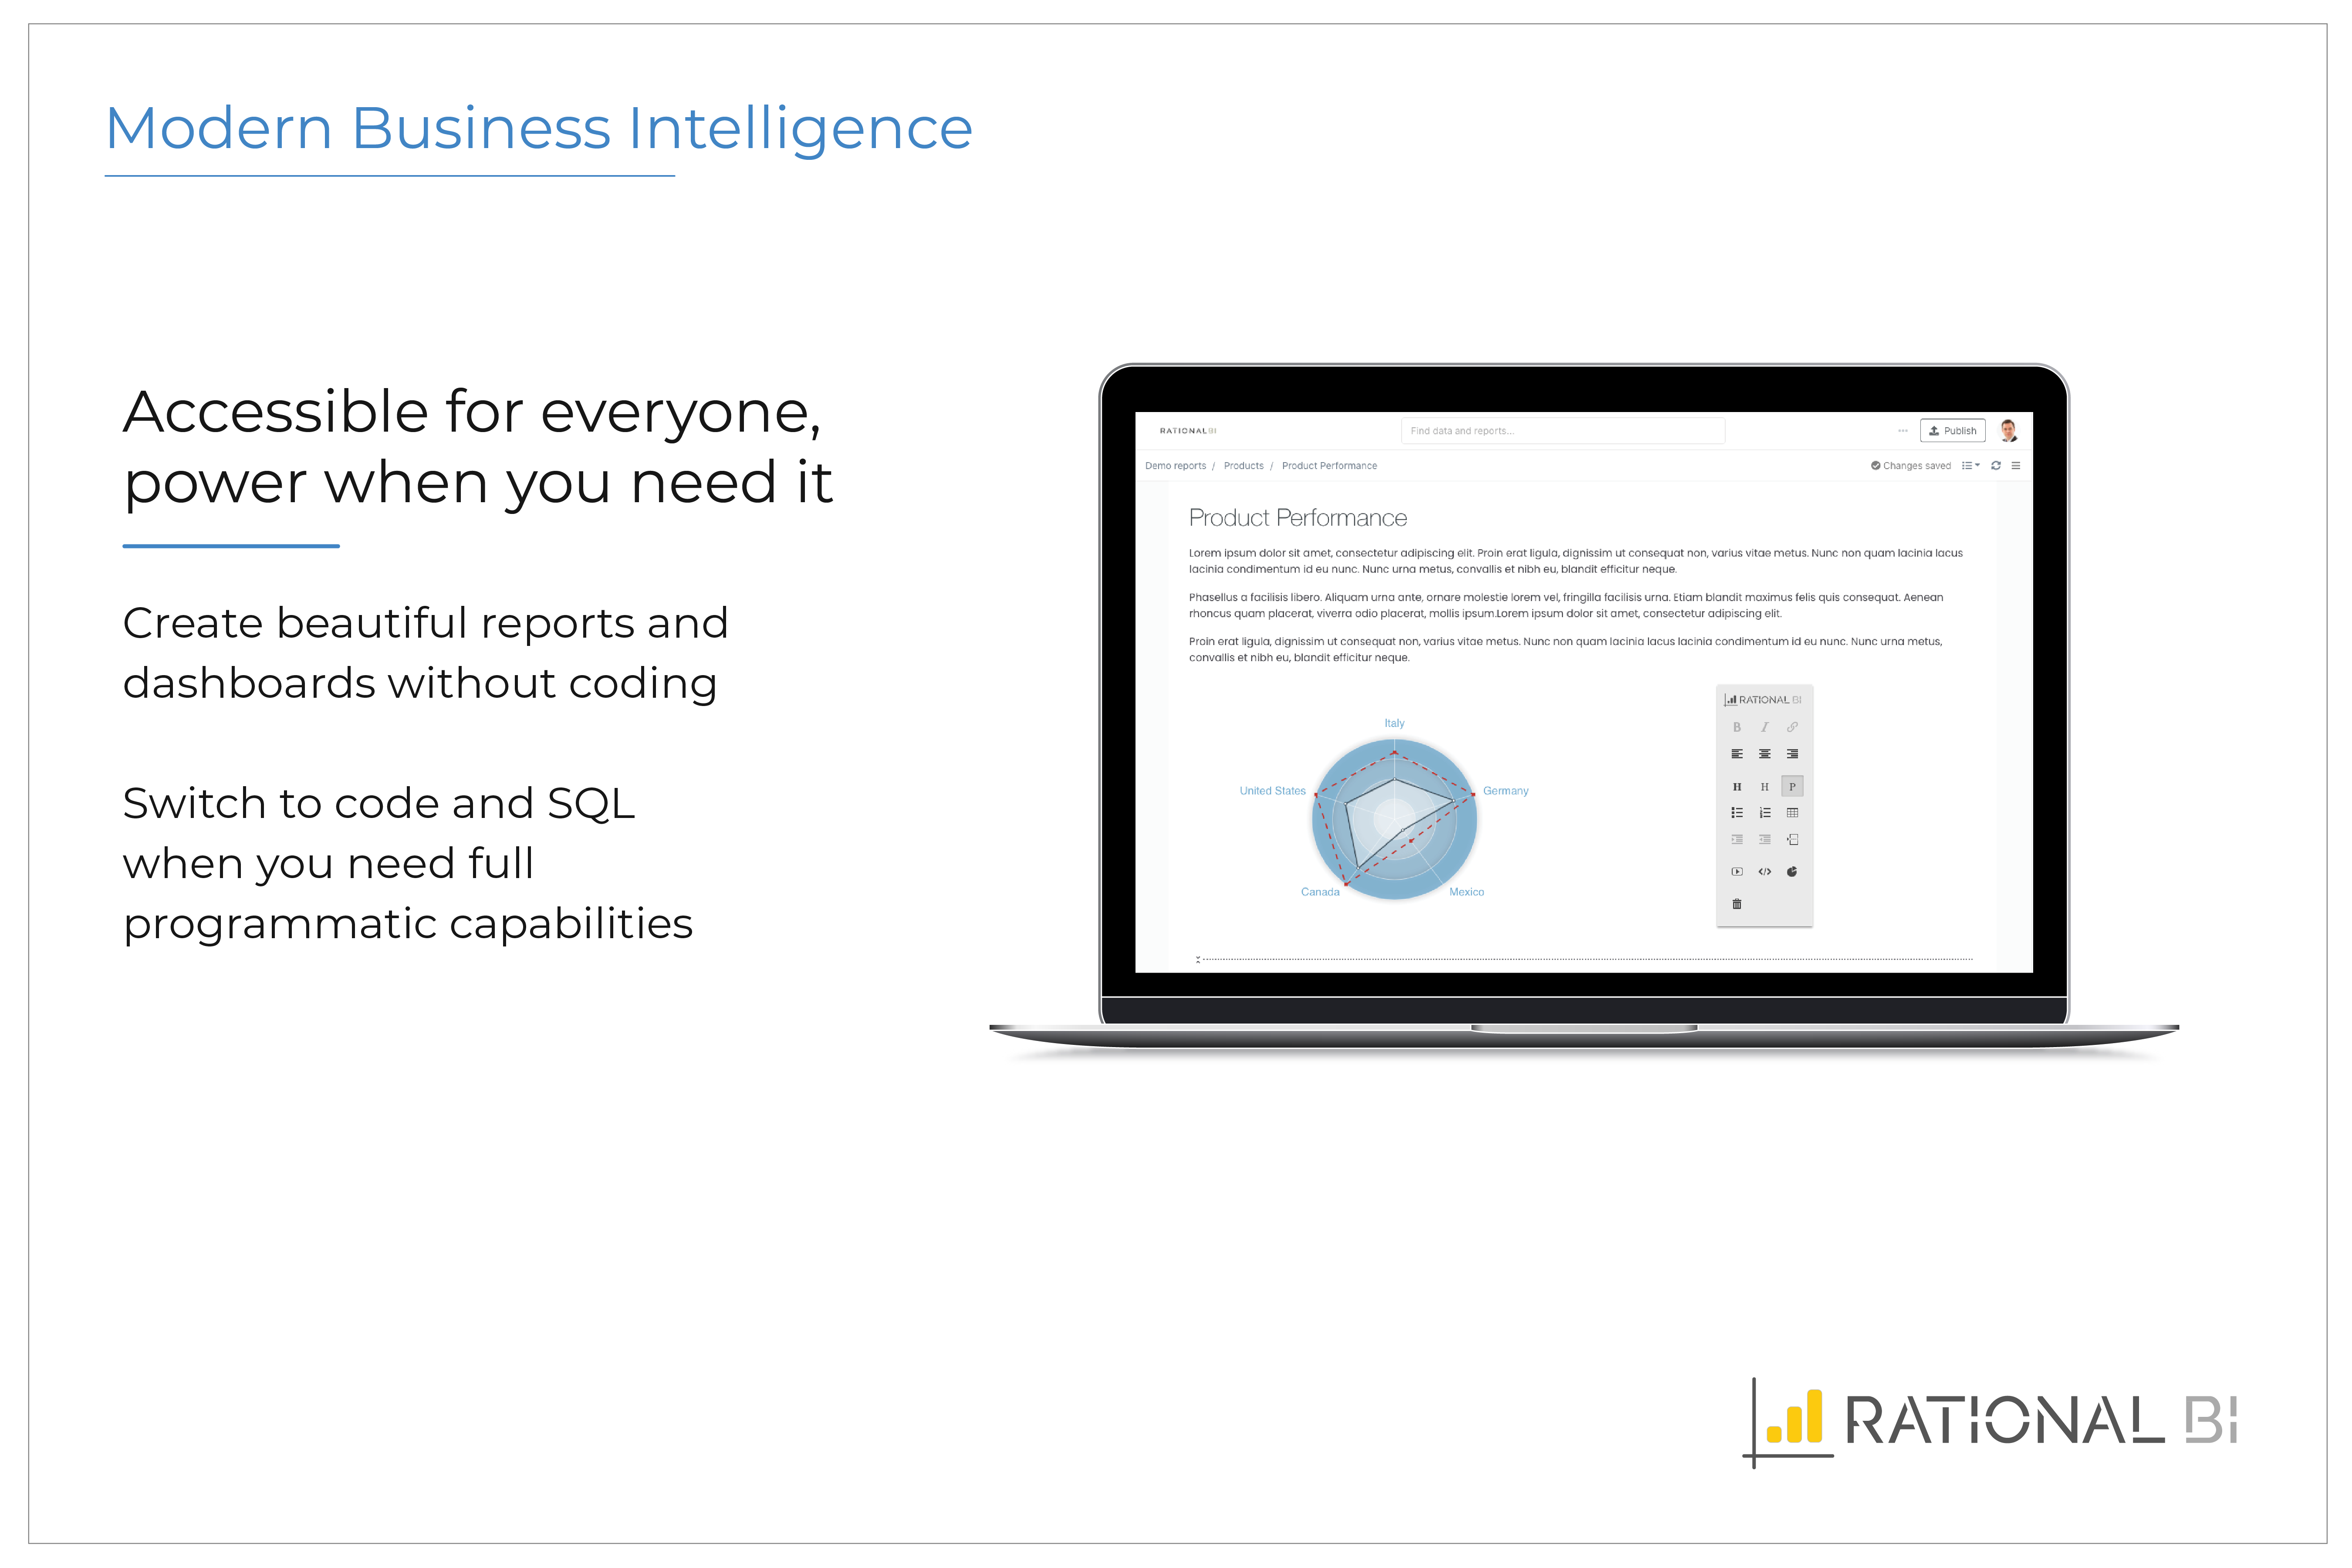  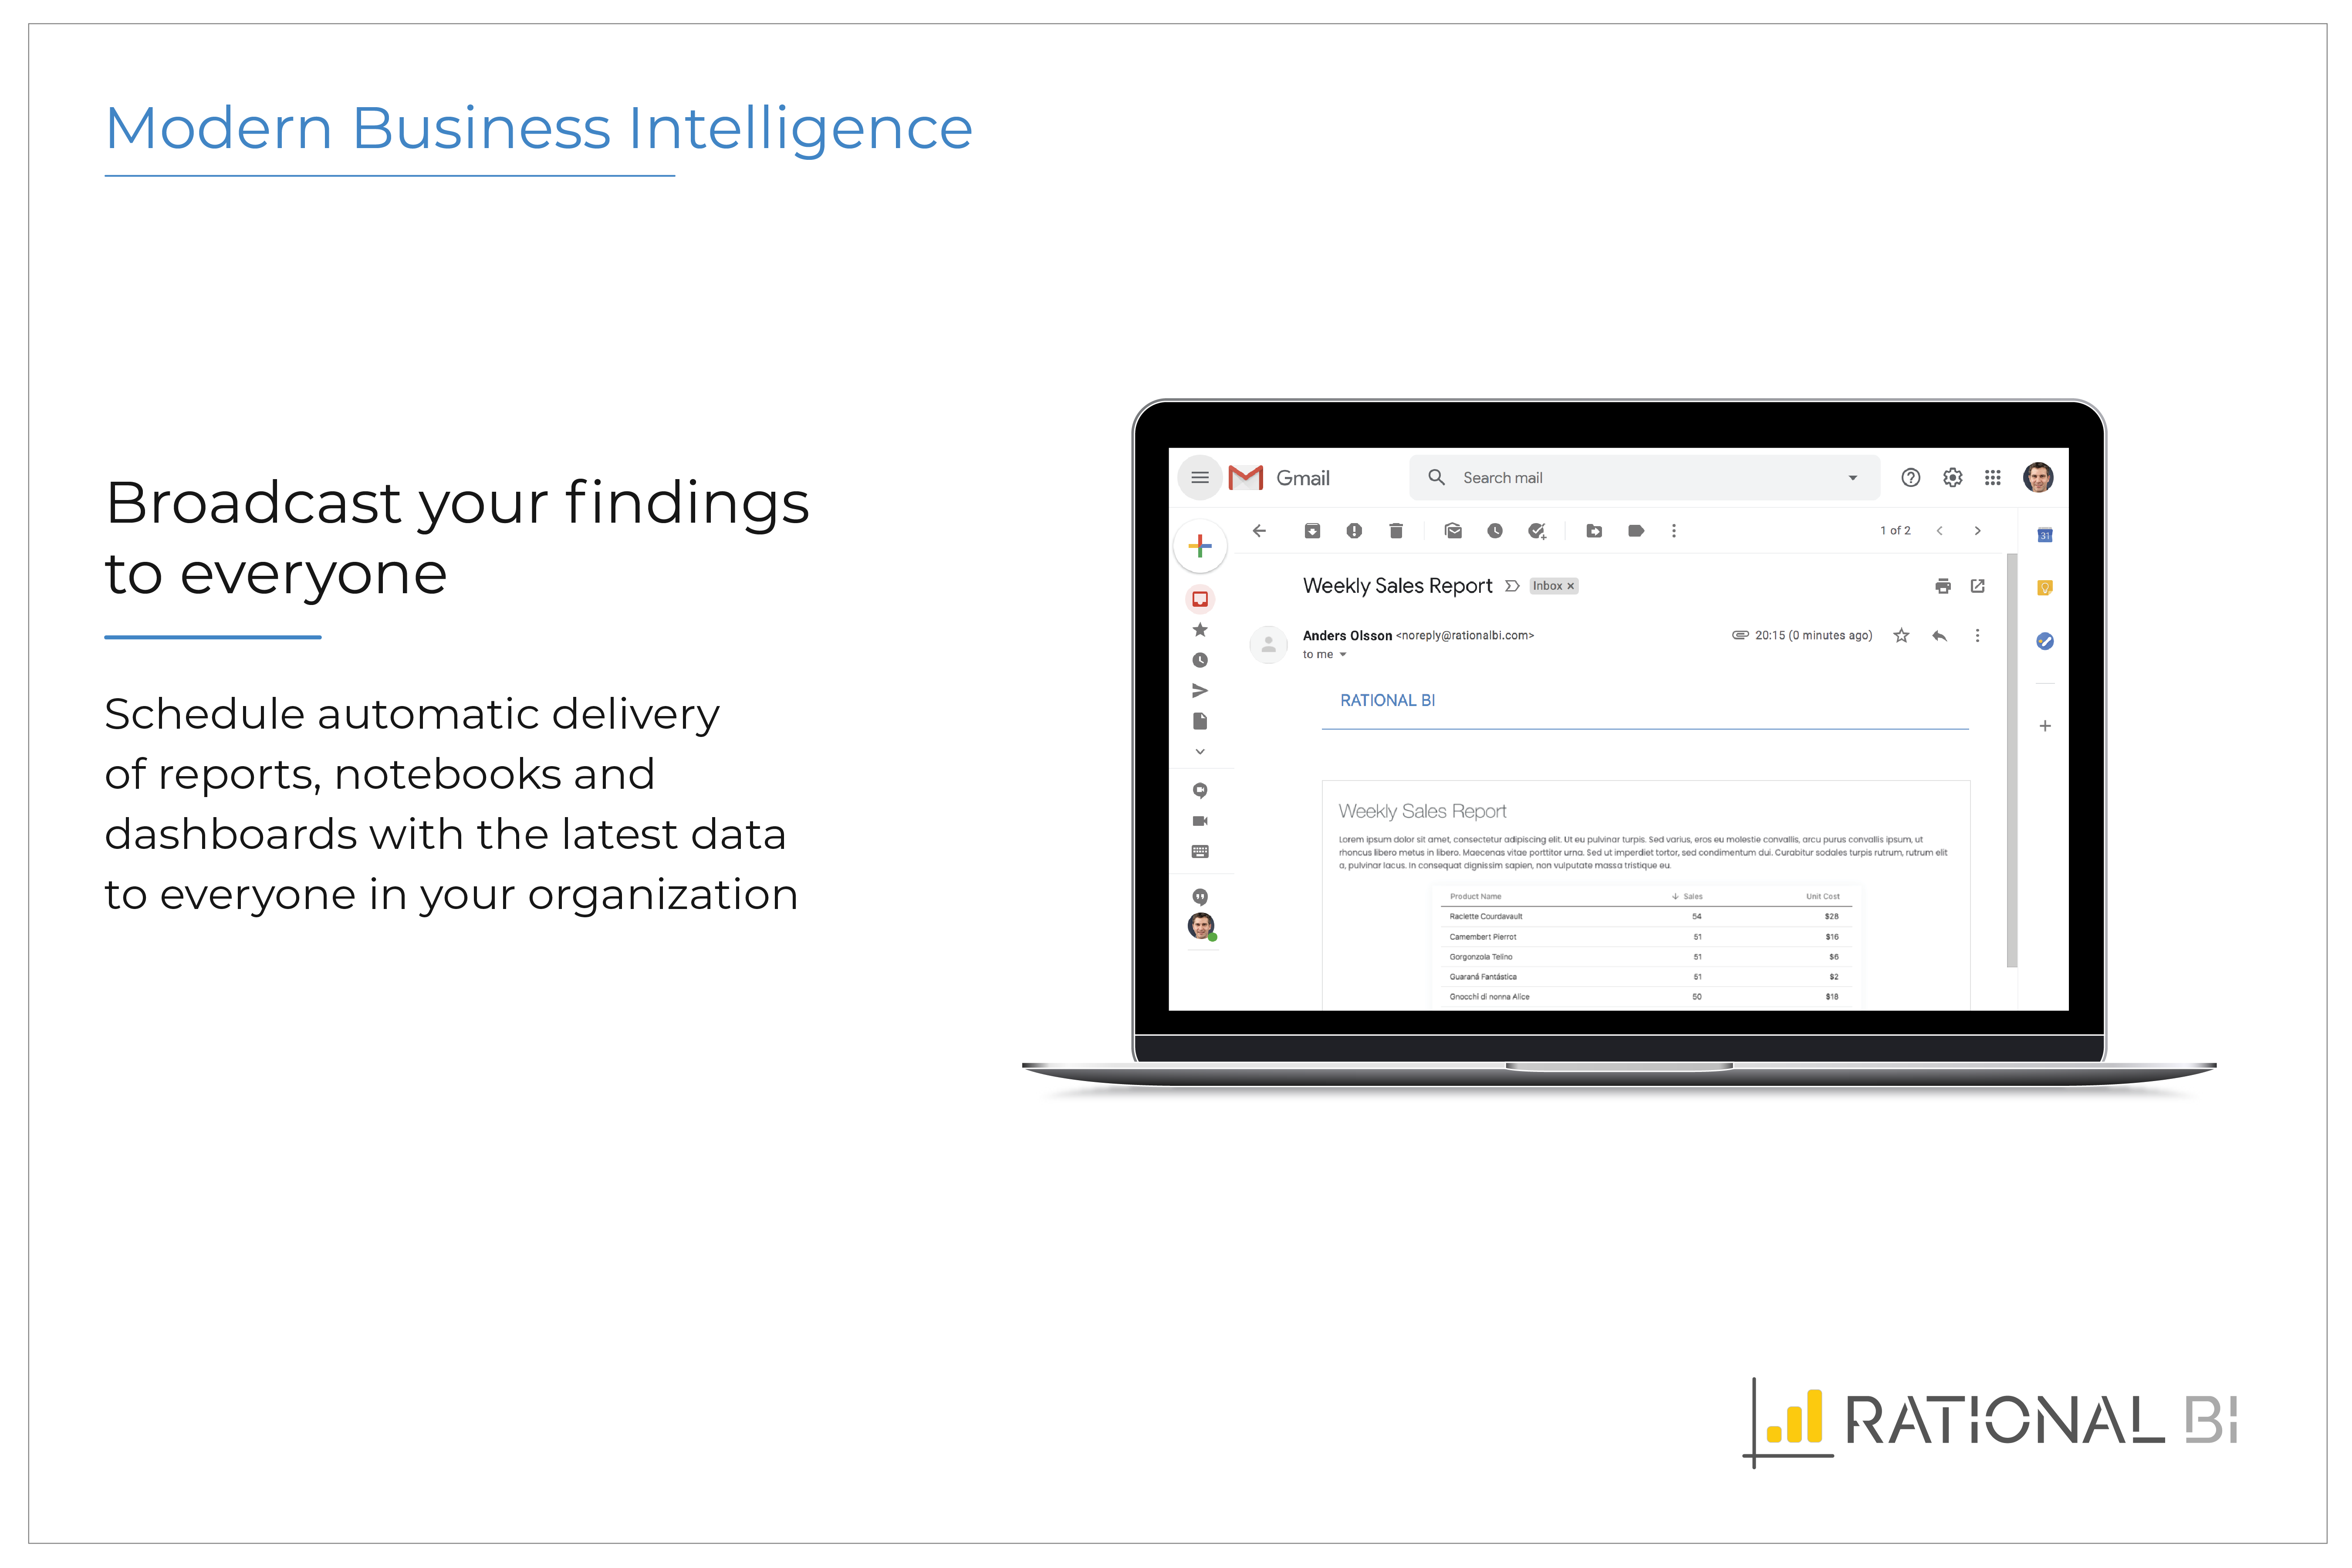 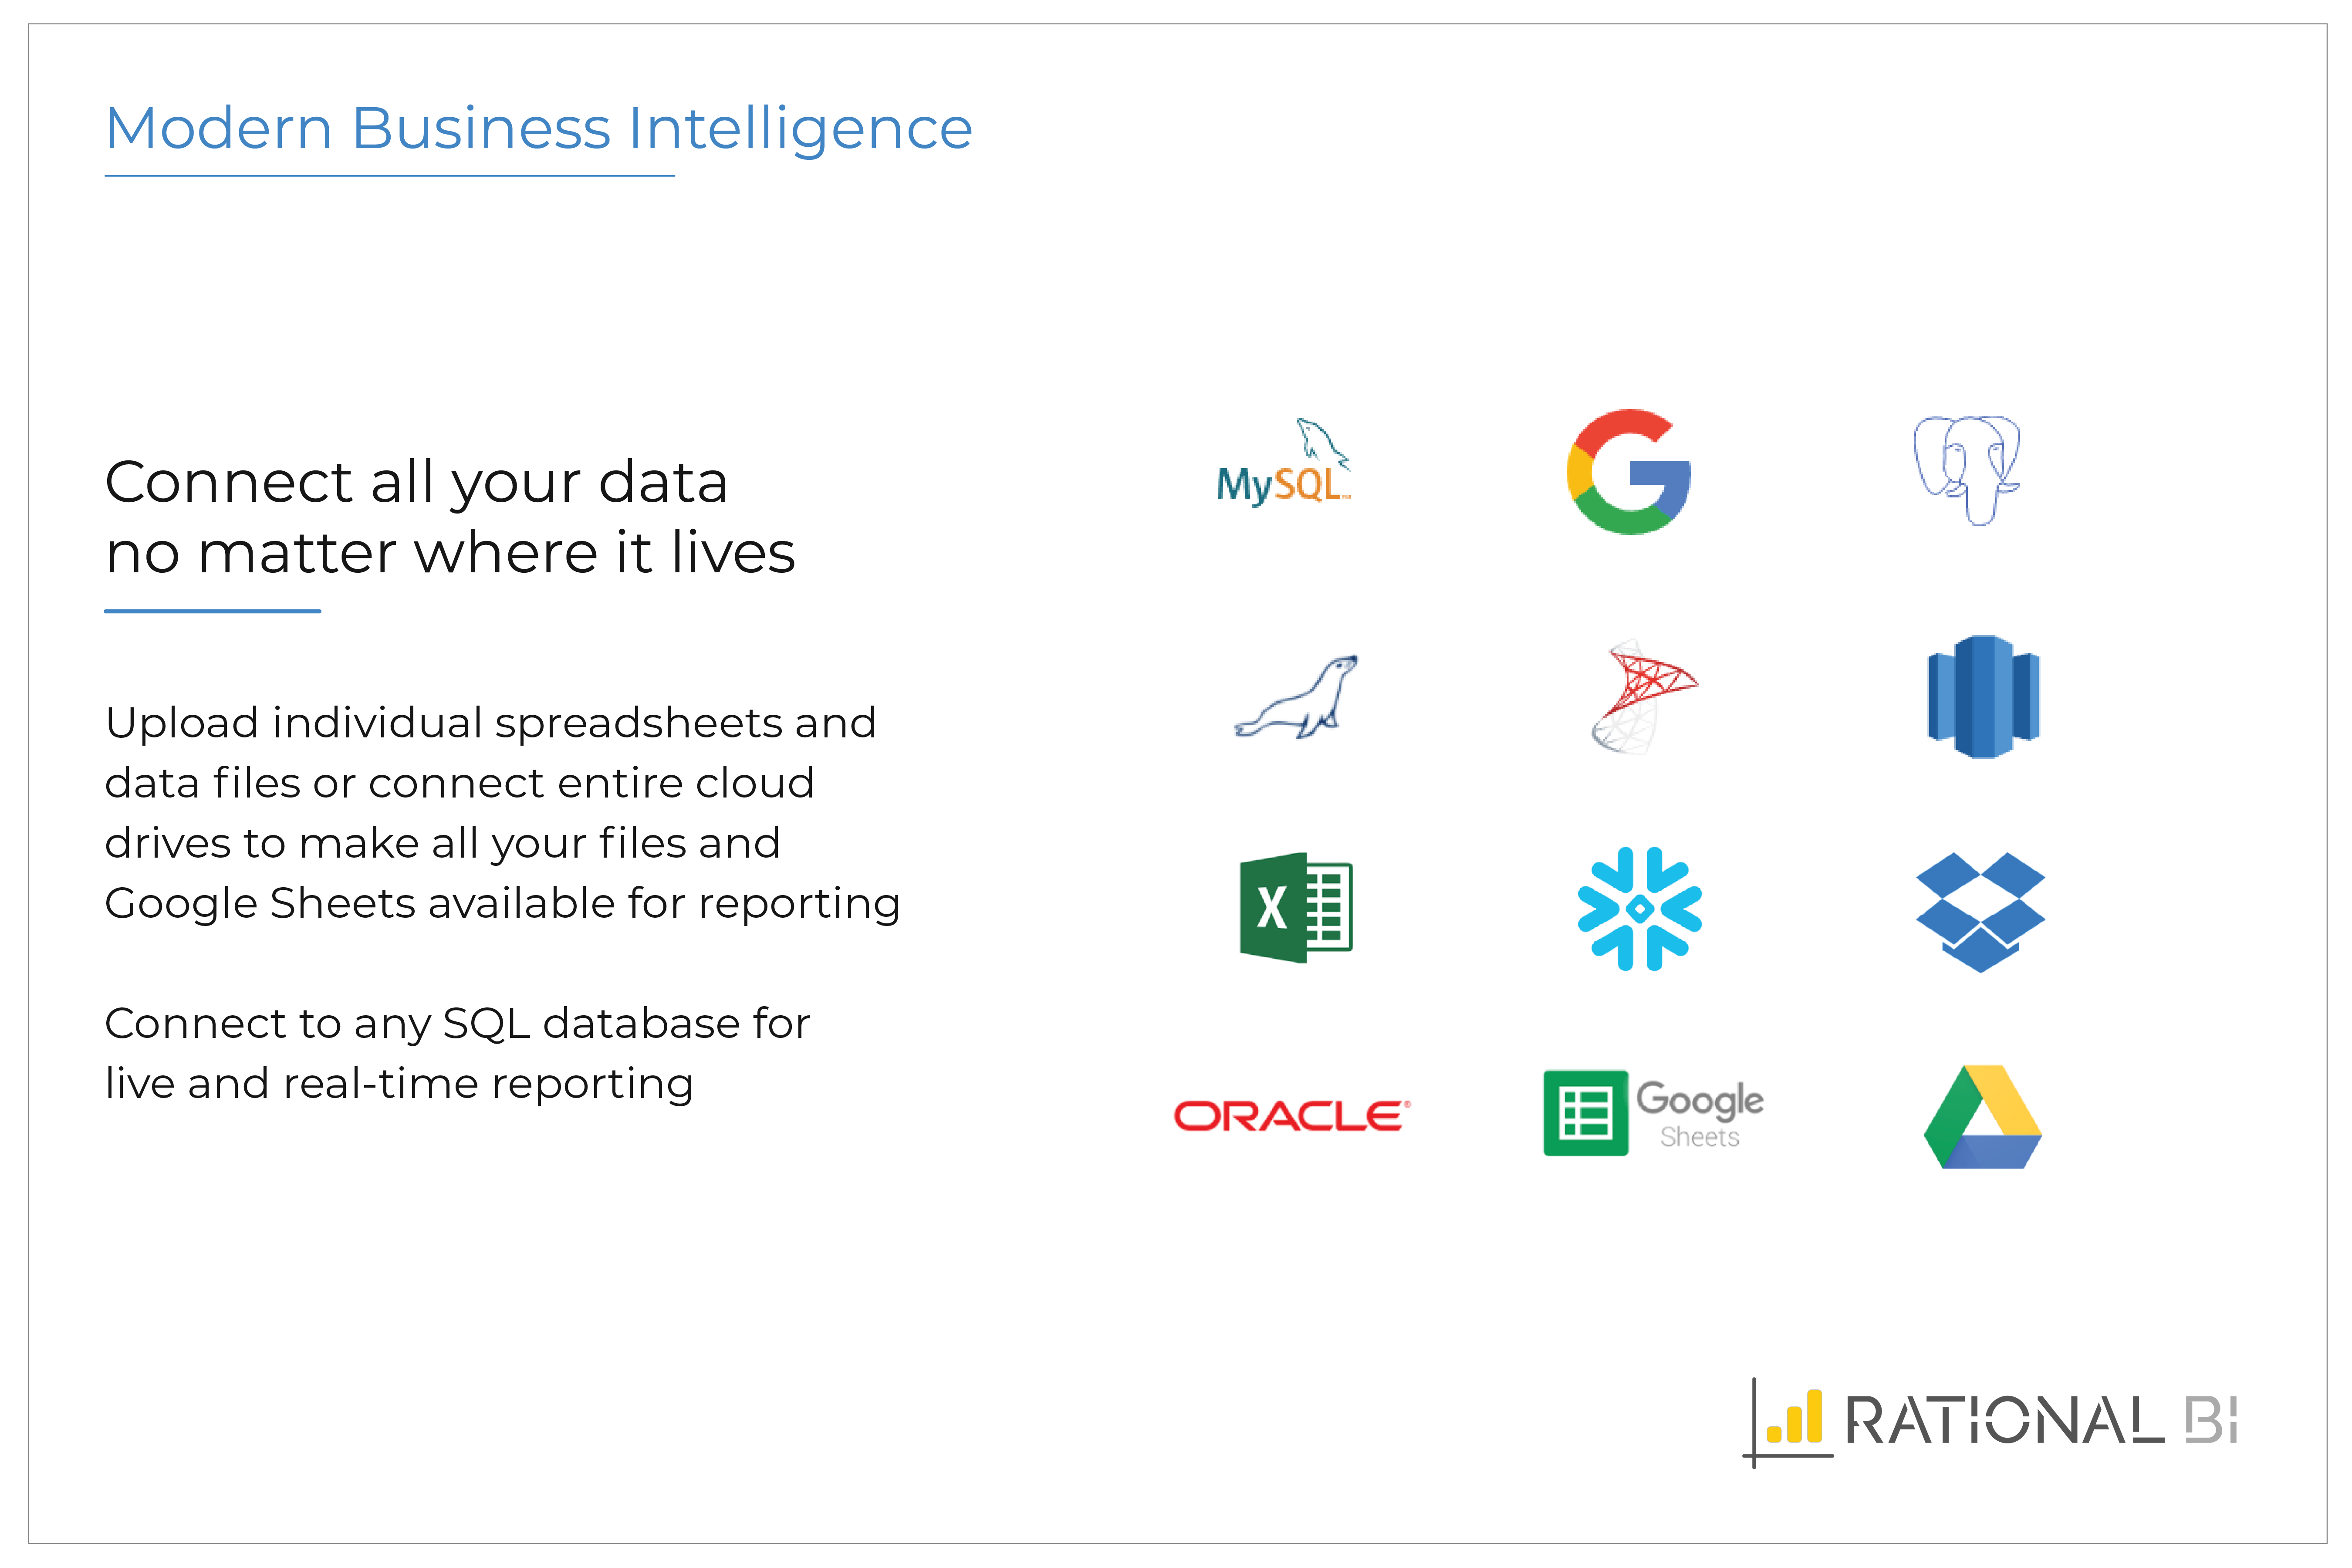 |




