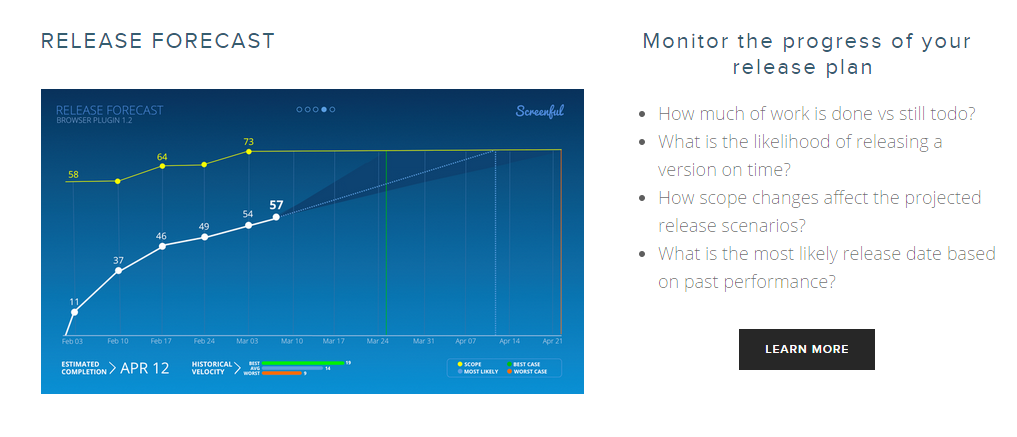
Screenful is a business intelligence solution that is targeted towards agile teams. The solution focuses on large visible screens and the content is designed to meet a specific use case.
N/A
Tableau Cloud
Score 8.0 out of 10
N/A
Tableau Cloud (formerly Tableau Online) is a self-service analytics platform that is fully hosted in the cloud. Tableau Cloud enables users to publish dashboards and invite colleagues to explore hidden opportunities with interactive visualizations and accurate data, from any browser or mobile device.
$15
per month per user
Pricing
Screenful
Tableau Cloud
Editions & Modules
No answers on this topic
Tableau Viewer
$15
per month billed annually per user
Enterprise Viewer
$35
per month billed annually per user
Tableau Explorer
$42
per month billed annually per user
Enterprise Explorer
$70
per month billed annually per user
Tableau Creator
$75
per month billed annually per user
Enterprise Creator
$115
per month billed annually per user
Tableau+
Contact Sales
Offerings
Pricing Offerings
Screenful
Tableau Cloud
Free Trial
Yes
No
Free/Freemium Version
No
No
Premium Consulting/Integration Services
Yes
No
Entry-level Setup Fee
No setup fee
No setup fee
Additional Details
—
—
More Pricing Information
Community Pulse
Screenful
Tableau Cloud
Features
Screenful
Tableau Cloud
BI Standard Reporting
Comparison of BI Standard Reporting features of Product A and Product B
Screenful
-
Ratings
Tableau Cloud
7.6
74 Ratings
7% below category average
Pixel Perfect reports
00 Ratings
7.756 Ratings
Customizable dashboards
00 Ratings
8.774 Ratings
Report Formatting Templates
00 Ratings
6.563 Ratings
Ad-hoc Reporting
Comparison of Ad-hoc Reporting features of Product A and Product B
Screenful
-
Ratings
Tableau Cloud
7.6
74 Ratings
6% below category average
Drill-down analysis
00 Ratings
8.674 Ratings
Formatting capabilities
00 Ratings
7.271 Ratings
Integration with R or other statistical packages
00 Ratings
6.247 Ratings
Report sharing and collaboration
00 Ratings
8.672 Ratings
Report Output and Scheduling
Comparison of Report Output and Scheduling features of Product A and Product B
Screenful
-
Ratings
Tableau Cloud
7.8
72 Ratings
5% below category average
Publish to Web
00 Ratings
8.568 Ratings
Publish to PDF
00 Ratings
7.567 Ratings
Report Versioning
00 Ratings
7.655 Ratings
Report Delivery Scheduling
00 Ratings
8.559 Ratings
Delivery to Remote Servers
00 Ratings
6.538 Ratings
Data Discovery and Visualization
Comparison of Data Discovery and Visualization features of Product A and Product B
I feel for collaborative teams who like to work together, Screenful can be a really effective platform. For example, I clearly see the benefit for sales, account management, and marketing teams to collaborate using this dashboard. When I used it, it really made our work easy. On the flip side, I feel teams who rather work in silos, this tool is not a good return on investment.
If you're using Tableau as the primary BI tool, then Tableau Cloud is well suited to publish and share the results with a wide(r) audience. It is well suited for various degrees of self-service proficiency, from pure consumers of analytical work to more advanced users who can use web editing for smaller or larger adjustments, and even for desktop power users who will publish their work to Tableau Cloud. It has many good ways to organize the content and make it easily accessible via search, favorites, folders, collections ("playlists for your data"), or history ("recents"). It might not be ideally suited if there are many on-prem sources to be used (even though there are options to connect them) or if you have very special requirements regarding custom server setup, which is limited in a shared cloud environment like Tableau Cloud.
Tableau Online is completely cloud based and that's why the reports and dashboards are accessible even on the go. One doesn't always need to access the office laptop to access the reports.
The visualizations are interactive and one can quickly change the level at which they want to view the information. For example, one person might be more interested in looking at the country level performances rather than client level. This is intuitive and one doesn't need to create multiple reports for the same.
The feature to ask questions in plain vanilla English language is great and helpful. For quick adhoc fact checks one can simply type what they are looking for and the Natural Language Programming algorithms under the hood parse the query, interpret it and then fetch the results accordingly in a visual form.
Based on comments from our clients, I awarded it this grade. Non-technical customers frequently compliment us on the ease with which they can utilize Tableau Online. Usability is rarely a source of contention amongst our customers. Few complaints have come from me as a user of our internal products.
I have not had any issues that require customer support from Tableau at this time, which speaks well to Tableau. I have taken an online course with Tableau and it was very professional and well done, so based on that I would assume a similar level of quality for their customer service.
Screenful has a clear advantage over Tableau because it is much easier to integrate with Jira and GitHub. Screenful gives powerful ready-made project planning visualisations that would be difficult to build from Tableau. Screenful is also much better than Geckoboard in terms of integration with Jira and GitHub as well as better project planning visualisations.
In determining whether to go with Tableau Online versus Alteryx, two important factors stood out in determining our go-to solution. First, while Alteryx is an impressive tool for data cleansing, it did not stack up in terms of data visualization capabilities. Tableau, on the other hand, provided us everything we needed in terms of visualizing our data and analytics. The second factor is cost. Well neither solution would be considered cheap, Tableau was the more cost effective solution for our needs.